TURBOThe price may pull back and appears to be approaching a key support level around 0.003100 USDT, which was also a previous area of interest. There's an indicated potential for the price to find support within zone 0.003100 USDT and then rebound towards the 0.005600 USDT level. This suggests that while there might be further short-term volatility, the market could be looking for a base before attempting another move higher. Use stop loss at 0.002266 to manage your risk.
TURBOUSDT.P trade ideas

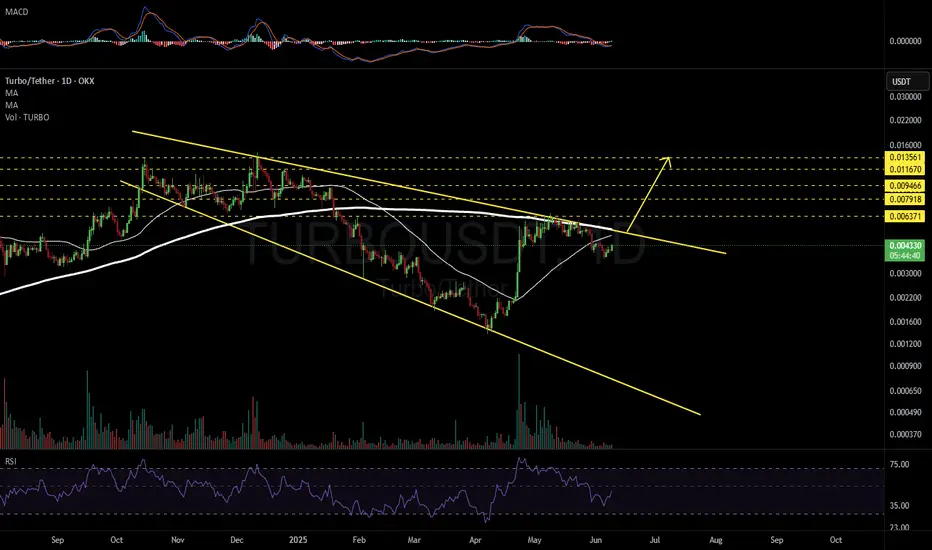
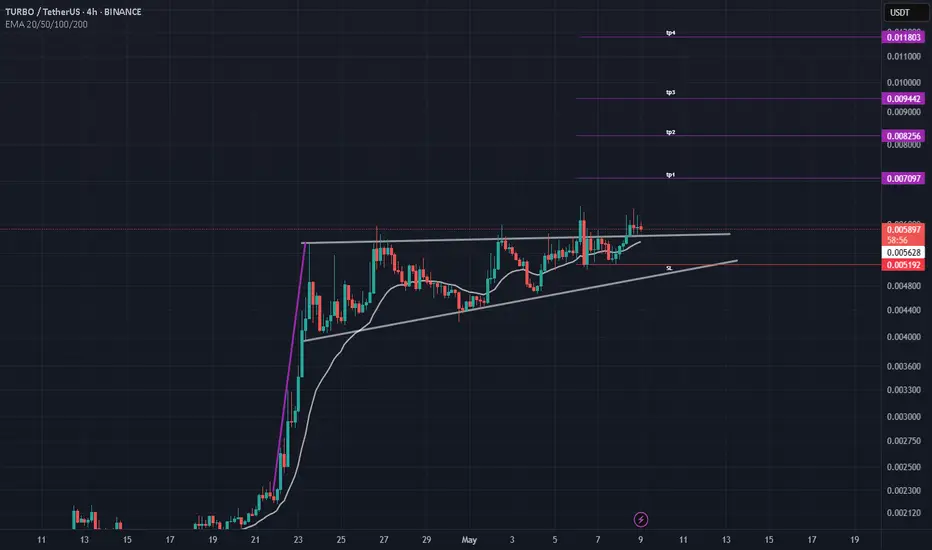
TURBOUSDT 1D#TURBO — Ready to Explode? 💥
#TURBO has formed a Megaphone Pattern on the daily chart, and a golden cross looks set to form soon — a strong bullish signal.
A breakout above the pattern resistance could trigger a massive bullish wave. If that happens, the targets are:
🎯 $0.006371
🎯 $0.007918
🎯 $0.009466
🎯 $0.011670
🎯 $0.013561
⚠️ Always use a tight stop-loss to manage risk and protect your capital.
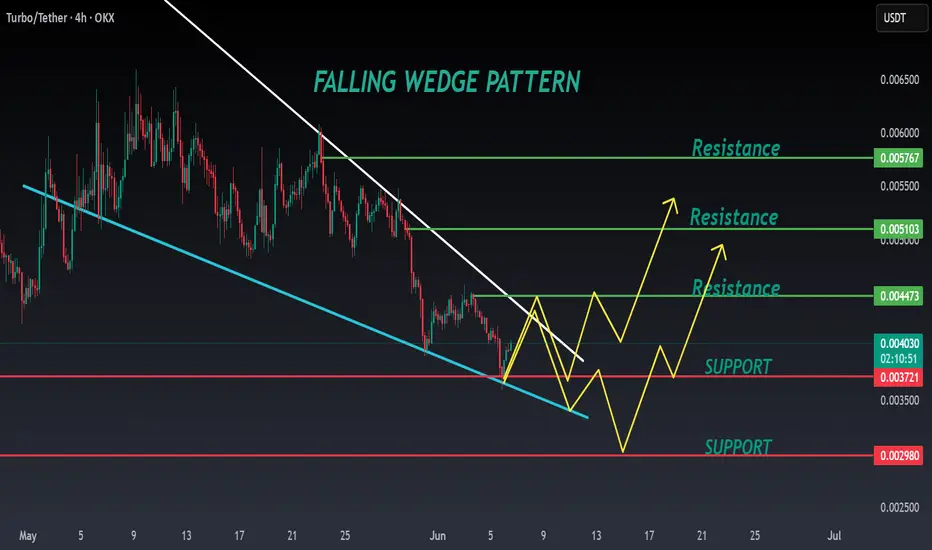
TURBO ANALYSIS📊 #TURBO Analysis
✅There is a formation of Falling Wedge Pattern on daily chart and currently pullback around its major support zone🧐
Pattern signals potential bullish movement incoming after sustain above the major support zone and breaks the pattern with good volume
👀Current Price: $0.004050
🚀 Target Price: $0.004470
⚡️What to do ?
👀Keep an eye on #TURBO price action and volume. We can trade according to the chart and make some profits⚡️⚡️
#TURBO #Cryptocurrency #TechnicalAnalysis #DYOR
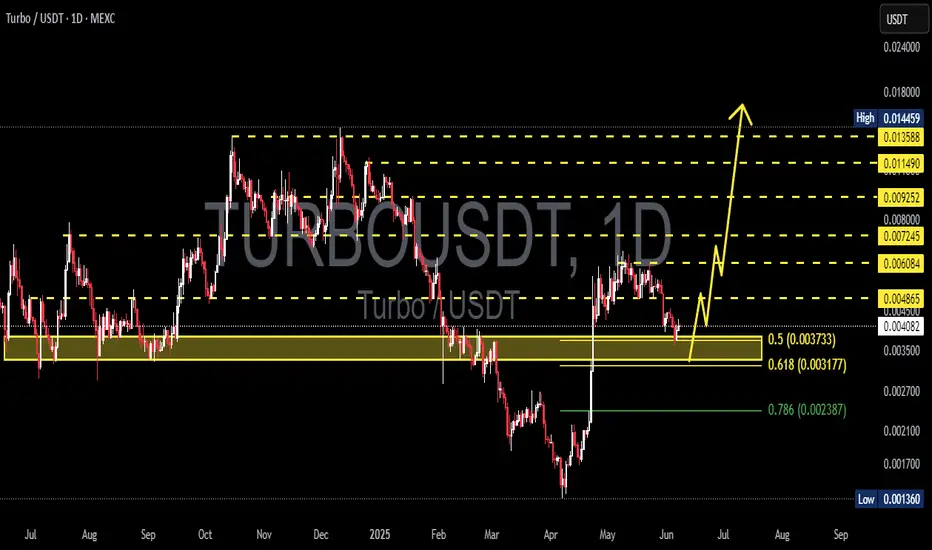
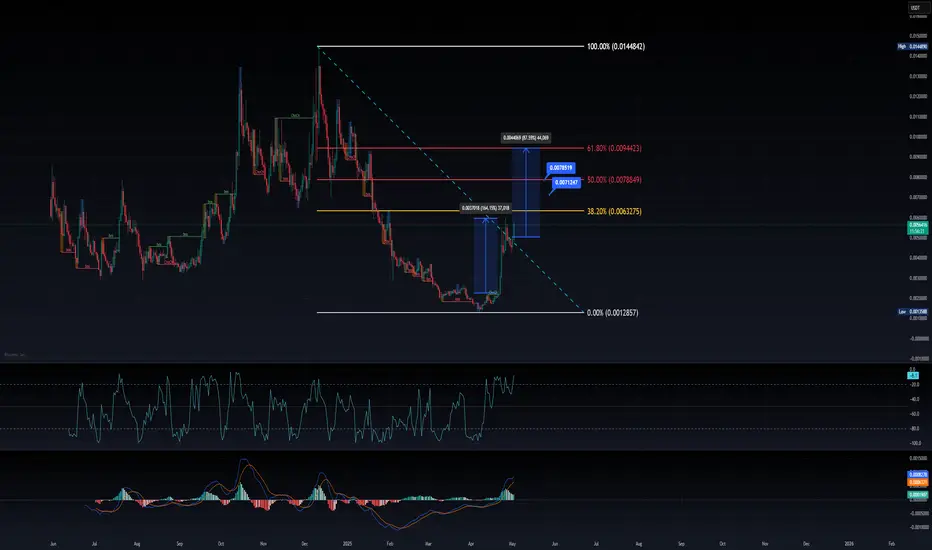
TURBOUSDT 1D AnalysisTURBO ~ 1D Analysis
#TURBO Buy gradually from here if you still have confidence in this coin with a short term target of at least 15%+ from here. Long term target $0.0145
TURBO USDT UPDATE The currency is being updated, but there is a warning for those who have entered it and those who want to enter it now. If you look back at its old indicators, you'll notice that it always corrects between 65% and 70%.
I wanted to point out that if it closes weekly above 0.0061.5, we'll see the targets specified above.
However, if it closes weekly below 0.0050, escape from it and you'll be headed for a 65% correction.
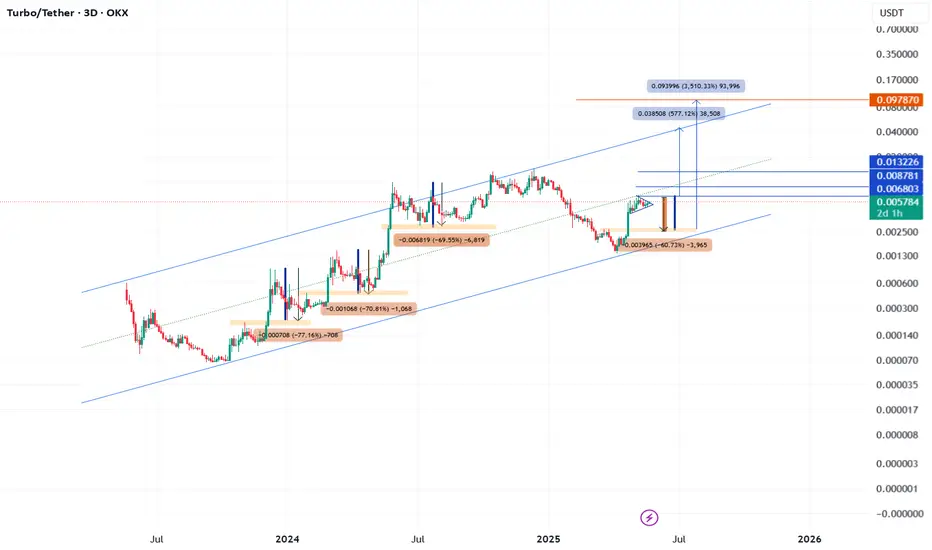
Buy in fear, sell in greed.Hello dears
Due to the price growth, now in the pullback you can buy in support areas in steps and move with it to the specified targets, of course with capital management.
*Trade safely with us*
TurboTurbo is cryptocurrency with low volume be careful
Entry price
0.0036
stop loss 0.0009
take profit
0.012
0.031

#TURBO/USDT#TURBO
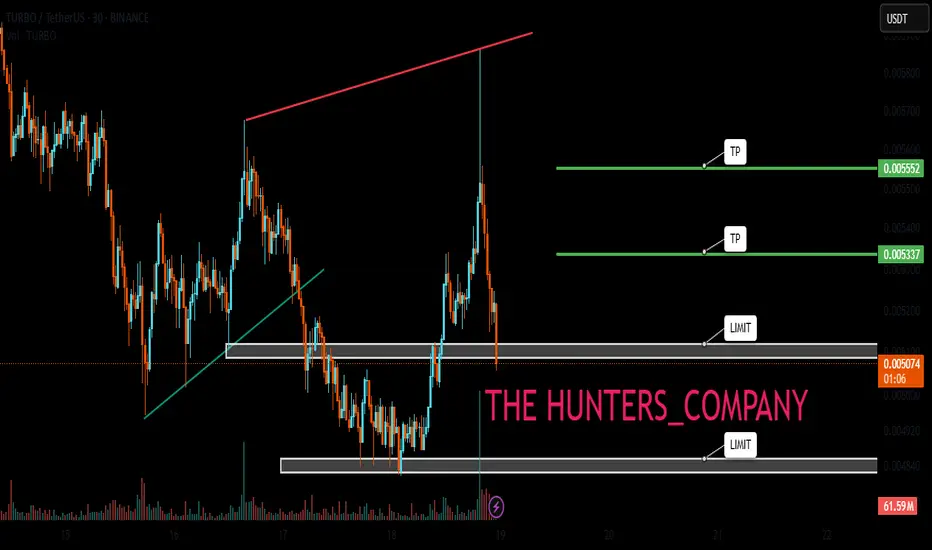
The price is moving within a descending channel on the 1-hour frame, adhering well to it, and is heading for a strong breakout and retest.
We are seeing a bounce from the lower boundary of the descending channel, which is support at 0.005170.
We have a downtrend on the RSI indicator that is about to be broken and retested, supporting the upward trend.
We are looking for stability above the 100 moving average.
Entry price: 0.005466
First target: 0.005592
Second target: 0.005746
Third target: 0.005962

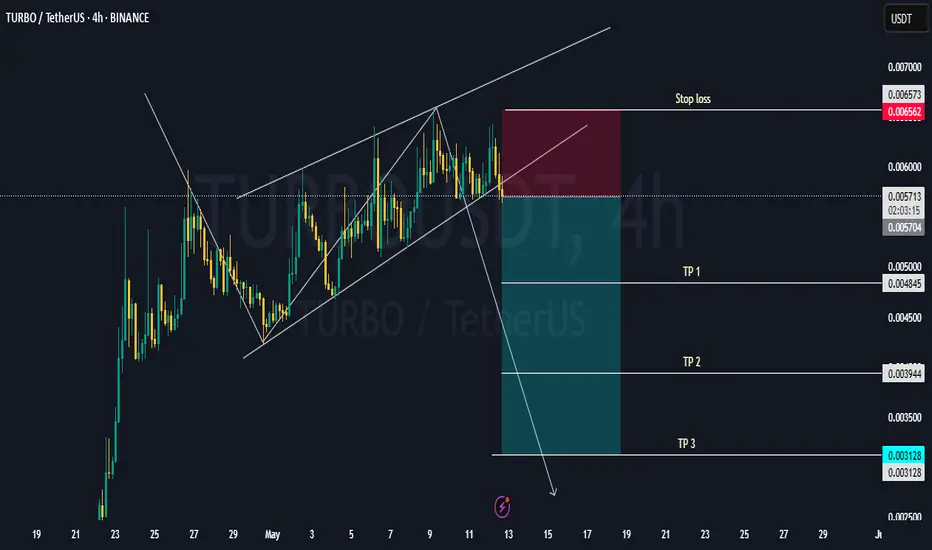
TURBO BEAR FLAG PATTERN - TIME TO SELLSeen here is MYX:TURBO breaking the support trendline and signal a downtrend. You may want to take profit here or pick a short position. For Turbo short,
Entry price: $0.005713
Stop loss: $0.006562
Take profit 1: 0.004845
Take profit 2: 0.003944
Take profit 3: $0.0031
Not a financial advice.
Please support this idea with a LIKE👍 if you find it useful🥳
Happy Trading💰🥳🤗
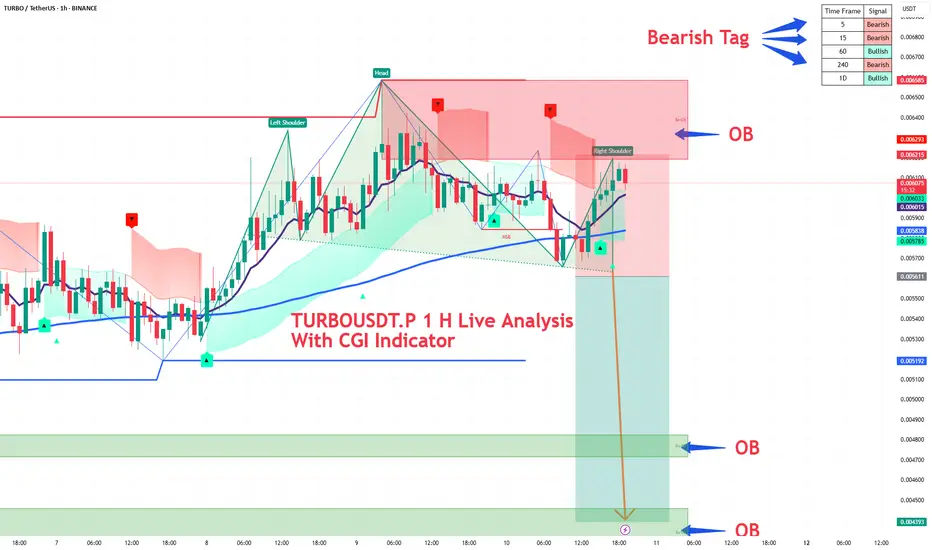
TURBOUSDT.P coin is forming a Head & Shoulder Pattern on the 1H TURBOUSDT.P coin is forming a Head & Shoulder Pattern on the 1H Time Frame.
After the chart pattern breakout, we can enter a Short Position.
According to our CGI Indicator, the 5M, 15M & 240M Time Frames are showing Bearish Tag and the 1H and 1D Charts are still showing Bullish Tag. From those two Bullish tags, 1H or Bearish Tag comes
After the Golden Cross occurs and the Short Tag comes, we can enter a Short Position.
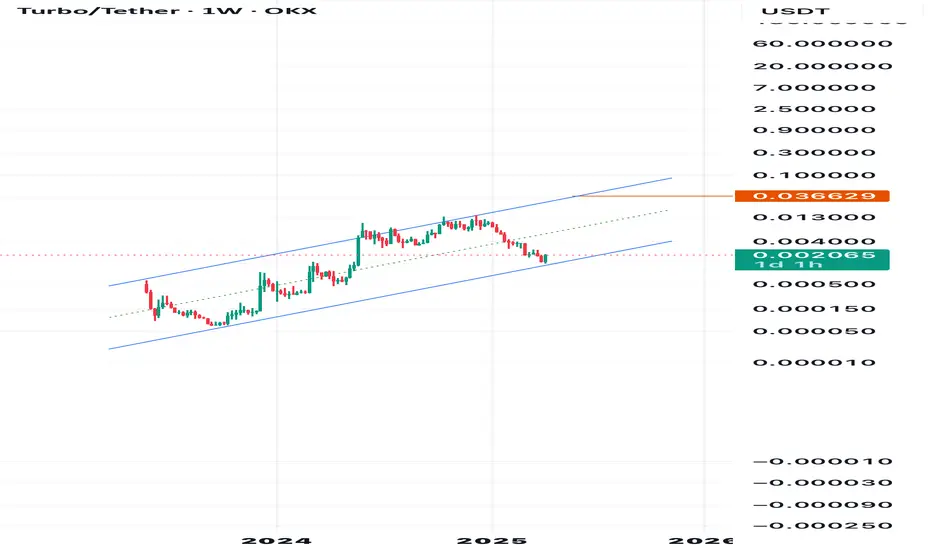
TURBO USDTTurbo coin has finished testing the support, especially the support of 0.0012, and now it has rebounded upon touching the bottom of the channel, so I believe its next target is 0.036.
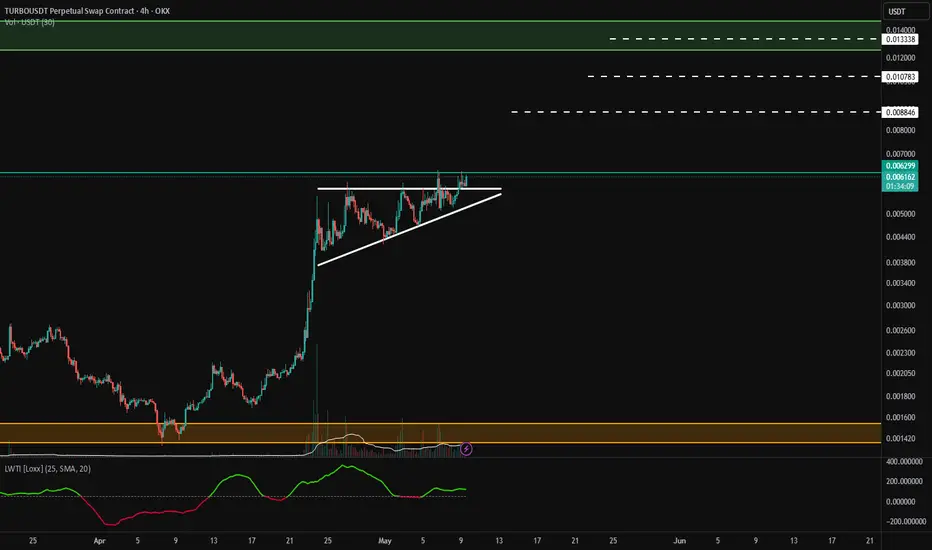
$TURBO Loading Up — Breakout Incoming?🚀 MYX:TURBO – Breakout Loading…
MYX:TURBO is showing serious signs of strength. Price has been consolidating just below key resistance, forming a classic compression zone — and higher lows continue to step in with conviction.
🟢 Key Structure:
Consistent higher lows
Tight range consolidation
Building volume = Pressure cooker setup
Once this upper resistance breaks, we could see a strong move toward $0.01+, potentially kicking off the next leg up.
📌 Watching for:
Break and retest of resistance zone
Surge in volume on breakout
Quick momentum toward target
This setup screams low-risk, high-reward with a clean invalidation below recent swing lows.
Breakout season is here. Don’t sleep on $TURBO.
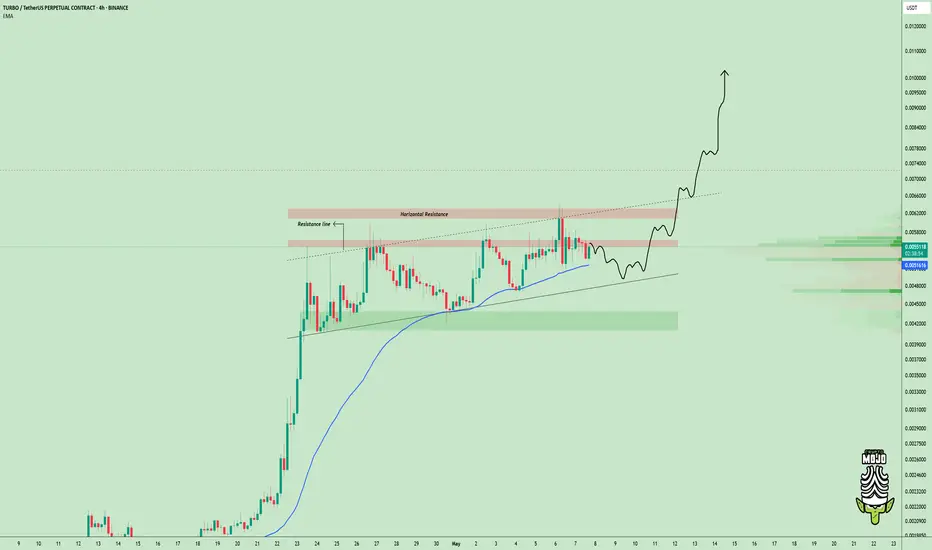
TURBOUSDT Forming an Ascending Triangle | Breakout Incoming?Hey traders! 👋
TURBOUSDT has been catching some serious attention lately, and for good reason. After a sharp rally, it’s now forming one of the most powerful bullish continuation patterns out there — an ascending triangle.
Let’s take a closer look at what’s happening here 👇
📐 Technical Structure: Ascending Triangle
The chart clearly shows higher lows pressing against a horizontal resistance — a classic ascending triangle. This often signals that buyers are building pressure and a breakout could be around the corner.
Key Observations:
Flat Resistance: Around the 0.00629 area. Price has tapped it multiple times, showing strong supply.
Rising Support Trendline: Buyers are stepping in at higher levels, tightening the range.
Volume: There's a noticeable increase in volume near the resistance, which could fuel the breakout.
🎯 Target Levels if Breakout Occurs
If price breaks above the horizontal resistance with strong momentum, here are the potential targets based on recent structure and extension zones:
TP1: 0.008846
TP2: 0.010783
TP3: 0.013338
TP4 (Stretch Target): 0.014000
Each level aligns with key psychological or historical resistance zones.
⚠️ What Could Go Wrong?
Not every triangle breaks upward — here's what to watch for:
False Breakouts: A wick above the resistance without follow-through could be a trap.
Break of Ascending Trendline: If price falls below the rising support, this could invalidate the pattern and trigger a deeper pullback.
Volume Drops: Weak volume during breakout attempts often signals a lack of conviction.
🛠️ How to Approach This Trade
Wait for Confirmation: Look for a candle close above 0.00629 with increased volume.
Manage Risk: Set a stop-loss just below the ascending trendline or recent swing low.
Scale Out: Take partial profits at each target level to lock in gains.
📌 Final Thoughts
TURBO is gearing up for a potential explosive move. Whether it breaks out or fakes out, this pattern is one to watch closely. Keep alerts on the breakout zone and be ready for action — but as always, protect your capital first.
📢 Do you think it’ll explode from here, or is this another bull trap? Let me know in the comments below and share your own analysis!
Turbo Trade!!!Turbo is getting ready for the next Leg Up
I think is a good time to add some using SL.
DYOR
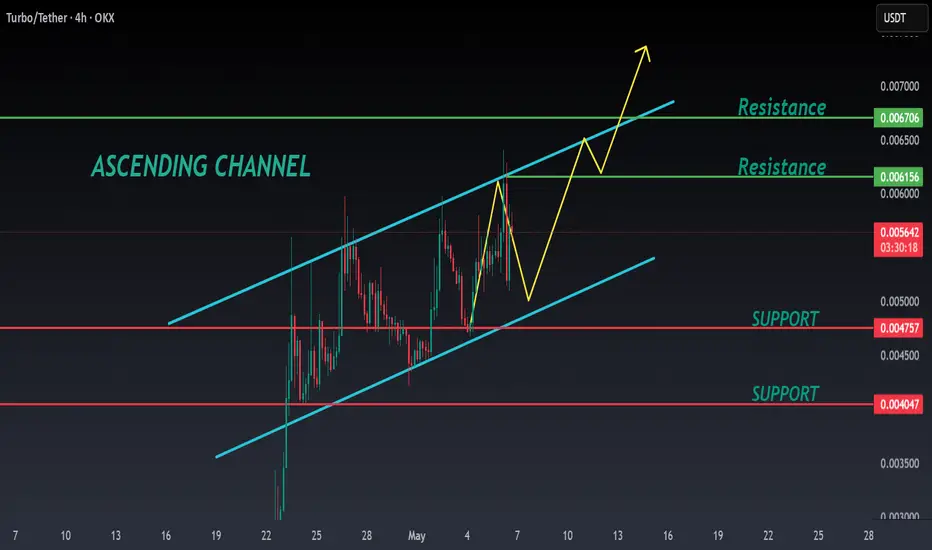
TURBO ANALYSIS🔆#TURBO Analysis : Channel Following ⛔️⛔️
As we can see that #TURBO is following ascending channel on 4h time frame. We can see a bullish formation here. And if it trade with good volume then we can see a proper bullish move in #TURBO📈📈
🔖 Current Price: $0.005610
⏳️ Target Price: $0.006160
⁉️ What to do?
- Keep your eyes on the chart, observe trading volume and stay accustom to market moves.🚀💸
#TURBO #Cryptocurrency #ChartPattern #DYOR
turboThere is a 50% selling pressure area against it that is likely to be allowed to enter the red box to stimulate buyers and this is if the green lines do not disappear
After that I think it can ......
Although there is a visible pattern for the price to increase
But I do not accept the risk of that area very much

TURBO price analysisWell, admit it, at least someone took a chance / was lucky enough to buy #TURBO at $0.0014-0.0015 with a pending limit order that they forgot about ?)
The price of OKX:TURBOUSDT rebounded well, now it would be a "blessing lucky" to buy this #memcoin at $0.0029-$0.0033
With the prospect of #Turbo continuing to grow at least to $0.010
_____________________
Did you like our analysis? Leave a comment, like, and follow to get more

TURBOIt seems like Turbo it will lead the Bull Market this season.
i am following Turbo since was firstly entered into the market and honestly u am very satisficed with it.
Now how will Turbo perform, i think that as i have shown in the chart must go next 2-4 days.
I wish.
Please trade carefully and make your own research before entering the market.
NFA
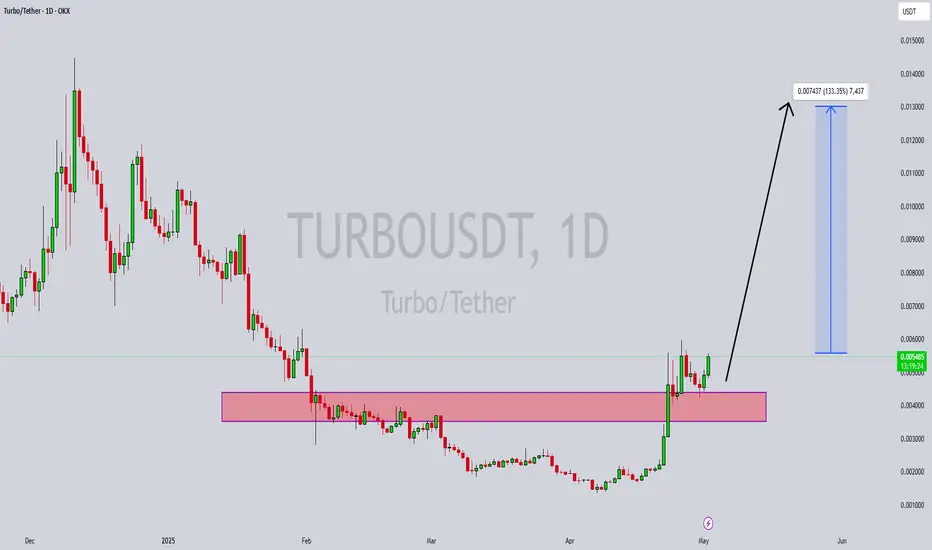
TURBOUSDT Showing Bullish Breakout
TURBOUSDT has successfully bounced from a strong support zone, marked by extended consolidation and accumulation in the highlighted pink range. This critical area acted as a base for bullish interest and now the price is showing a breakout pattern with a surge in both volume and momentum. This is typically a strong sign of renewed bullish sentiment among retail and institutional traders.
As seen in the chart, Turbo is currently trading around 0.0055 and could be setting up for a major move towards the projected price target of approximately 0.013. That’s a potential gain of over 130%, which makes this trade highly attractive for short to mid-term swing traders. The volume confirmation adds further strength to the breakout, suggesting that demand is increasing and sellers are drying up.
Technically, the market structure has shifted with higher highs and higher lows, signaling trend reversal from the downtrend seen earlier in the year. If price holds above the breakout zone, we could witness rapid movement to the upside. Investors are taking interest in this low-cap gem, especially with current sentiment favoring altcoin breakouts.
✅ Show your support by hitting the like button and
✅ Leaving a comment below! (What is You opinion about this Coin)
Your feedback and engagement keep me inspired to share more insightful market analysis with you!
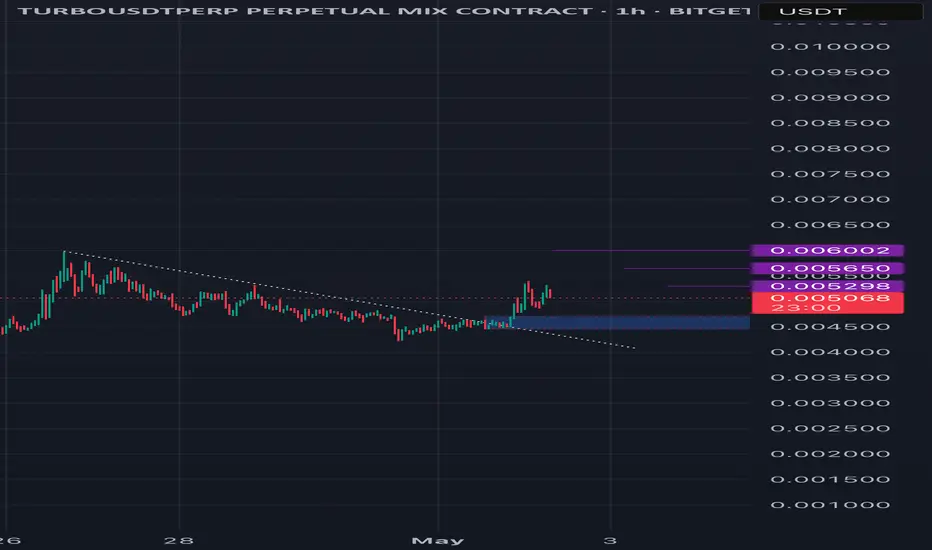
TURBO/USDT (1H Chart) – Breakout AlertA clean breakout from the descending trendline has occurred, followed by a strong bullish push. Price is now consolidating above the previous resistance at 0.005298, which is likely to act as new support.
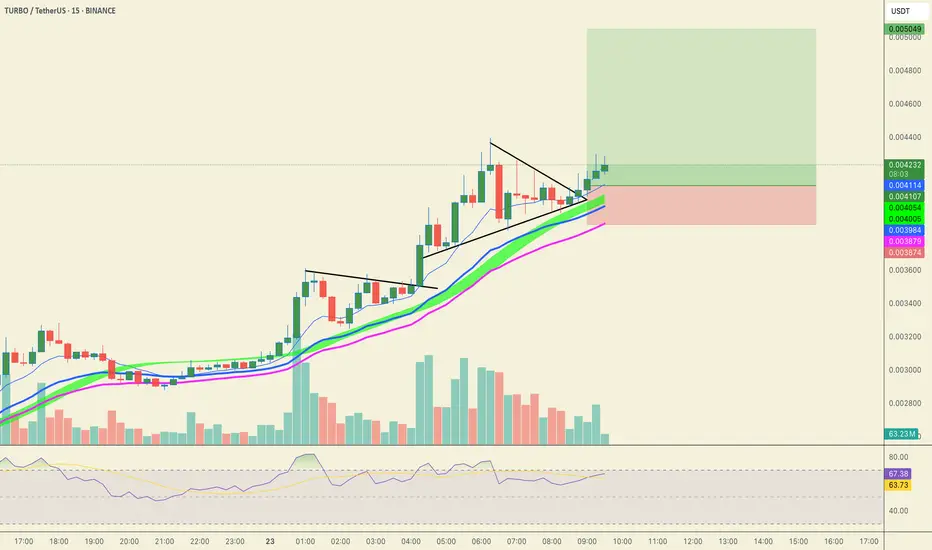
#TURBO/USDT Trade Setup, 22% Scalping Signal!TURBO is ready for another round!
Entry:- .004212 to .003955.004744
Targets:
.004434
.004833
.005010
Stop Loss:- .003874
Leverage: 3x to 5x
Just keep your SL intact.
dyor, nfa.
Please hit the like button if you like these charts.
thank you
#PEACE
TURBOUSDT CHART ANALYSİSWHAT IS CRYPTOCURRENCY?
Simply put, cryptocurrencies (also known as digital currencies, cryptos, virtual assets, or digital assets) are digital forms of currencies. They can be used to pay for goods and services just like conventional currencies. Like how the traditional forms of currencies can be traded against each other on the forex, cryptocurrencies can also be traded against specific pairs on specialized platforms called cryptocurrency exchanges.
The difference is that, unlike conventional currencies such as the U.S. dollar, cryptocurrencies are often not controlled by a single entity. They are also secured using complex cryptography coupled with a new form of online public ledger called a blockchain. It is distributed to anyone and everyone interested in having a copy. More than 21,960 cryptocurrencies currently exist at the time of writing.

TURBO long-term outlookAfter completing its first cycle TURBO seems to stabilize around the 0.0010-0.0020$ region which marks the last ATH from 2023. What's interesting here is that TURBO follows the DOGE coin pattern levels almost to a T, in speedrun mode. It is absolutely not the same structure but it respects the same trading ranges and shows a lot of similarities, which is quite remarkable.
Watch out for this yearly trendline in the TURBO chart and expect some volatility for the next months. Breaking under 0.0010$ could potentially confirm a longer downtrend if we don't see a big impulsive bounce to the upside in the near future.
