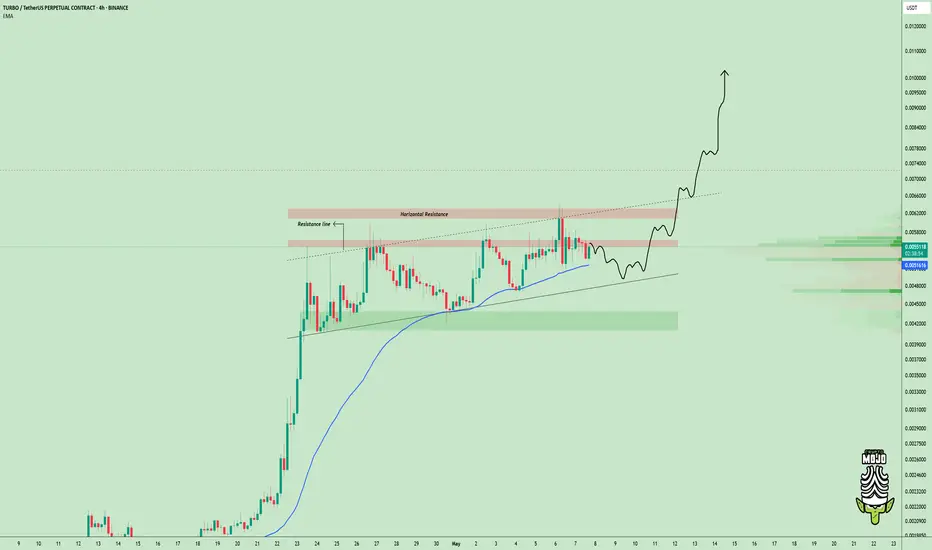
TURBOUSDT Forming Bullish PennantTURBOUSDT is currently exhibiting a bullish pennant pattern on the charts—a continuation setup that often leads to strong upward movement after a period of consolidation. This pattern typically forms after a sharp upward move, followed by a tightening range that resembles a pennant or small symmetrical triangle. The breakout from this structure is generally explosive, especially when backed by strong volume. TURBOUSDT has seen just that—an increase in trading volume that aligns with growing investor confidence.
The technical structure suggests that the recent consolidation phase is nearing its end, and a breakout to the upside could potentially yield a move of 80% to 90% or more. Bullish pennants are powerful indicators of renewed buying interest, and with price coiling near resistance, the odds of a breakout are increasing. Traders are watching this setup closely for confirmation, as a successful breakout could attract further momentum and trigger a new bullish trend leg.
Beyond the technicals, TURBO’s growing presence in the meme and altcoin sectors has captured investor attention. The project has been gaining traction due to its unique branding, active community engagement, and listings on major exchanges. These fundamental strengths further reinforce the bullish outlook from a technical standpoint.
If the breakout confirms with strong volume, this could be one of the top short-term opportunities in the current market. Keep a close eye on the price action in the coming sessions as the pattern nears its apex—TURBOUSDT could soon enter a high-velocity rally phase.
✅ Show your support by hitting the like button and
✅ Leaving a comment below! (What is You opinion about this Coin)
Your feedback and engagement keep me inspired to share more insightful market analysis with you!
TURBOUSDT trade ideas

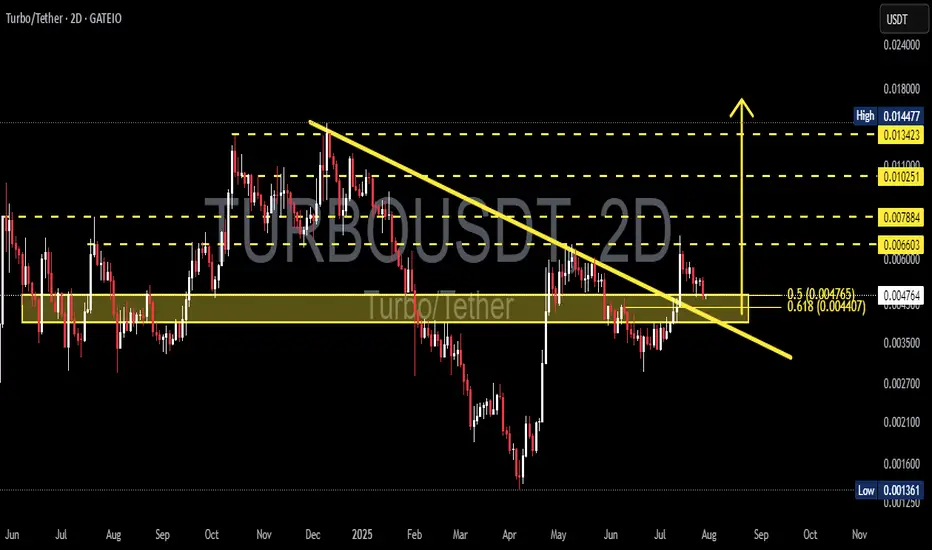
TURBO/USDT: Critical Decision Point – Breakout or Bull Trap?🧩 Overview
TURBO/USDT is currently sitting at a decisive technical juncture. After a prolonged downtrend since its late 2024 peak, the price has recently shown signs of a momentum shift by breaking out from a major descending trendline. The key question now: Is this the beginning of a bullish reversal, or just a temporary fakeout?
---
📉 Pattern Breakdown
Descending Triangle Breakout (Confirmed)
This classical bearish continuation pattern had formed since November 2024 with consistent lower highs. The recent breakout to the upside suggests a shift in market sentiment.
Historical Accumulation Zone (Demand Zone)
The yellow horizontal box (around 0.0042 – 0.0047 USDT) has acted as a strong historical accumulation and reaction area.
Golden Pocket Retest (Fibonacci 0.5 – 0.618)
The price is currently retesting the golden pocket retracement zone, which often acts as a decision zone for institutional buyers and swing traders.
---
📈 Bullish Scenario (Breakout Confirmation)
If the price holds above the golden pocket zone and prints a higher low, we could see:
🎯 Next Bullish Targets:
0.00660 USDT – Minor resistance
0.00788 USDT – Psychological level
0.01025 USDT – Mid-range resistance
0.01342 USDT – Major key level before recent highs
0.01447 USDT – Local high and full breakout target
✅ Bullish Confirmation:
A strong 2D candle close above 0.0066 with rising volume would validate the bullish breakout and signal continuation.
---
📉 Bearish Scenario (Fakeout Risk)
If price fails to hold the 0.0044 – 0.0047 USDT range and breaks back down:
🔻 Bearish Targets:
0.0035 USDT – Previous local support
0.0025 USDT – Old consolidation zone
0.00136 USDT – All-time low (last defense level)
❗️Bearish Confirmation:
A breakdown below 0.0044 USDT with bearish volume would invalidate the breakout and open the door for deeper downside.
---
🧠 Additional Insights
The initial breakout had solid volume, but current price action is testing the breakout validity.
RSI or momentum indicators (not shown here) should be monitored for divergence or confluence with this setup.
---
📌 Conclusion
> TURBO/USDT is at a make-or-break moment. While the breakout from the descending triangle is a strong bullish signal, the retest of the golden pocket zone must hold to confirm the trend reversal. Failure to do so could turn this into a bull trap with deeper downside risk.
⏳ Eyes on this level — market is choosing a direction.
#TURBO #USDT #CryptoAnalysis #BreakoutOrFakeout #TechnicalAnalysis #DescendingTriangle #FibonacciGoldenPocket #BullishScenario #BearishScenario #AltcoinWatch #CryptoTrading
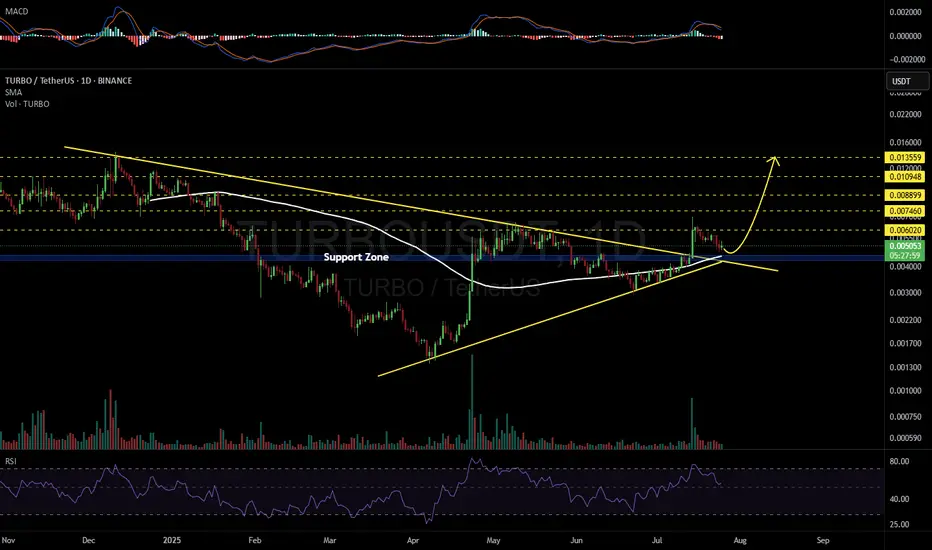
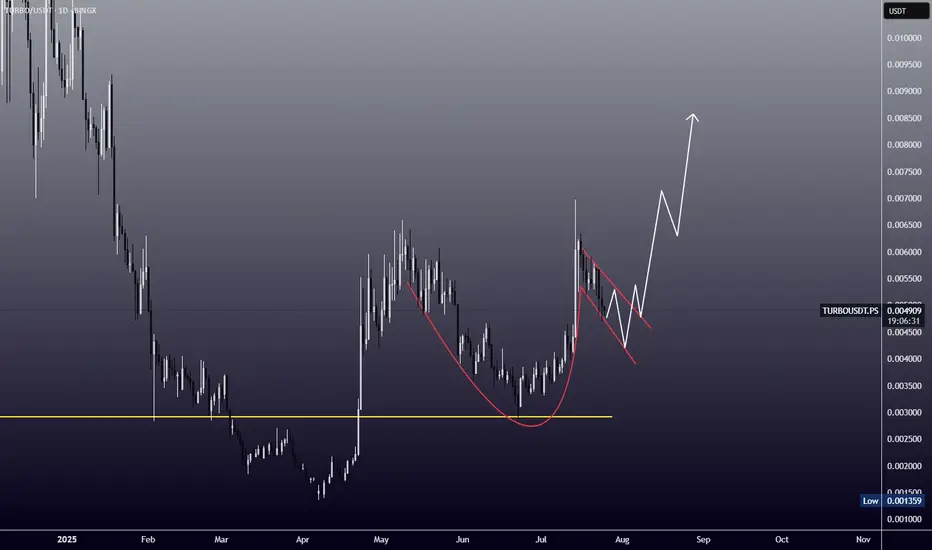
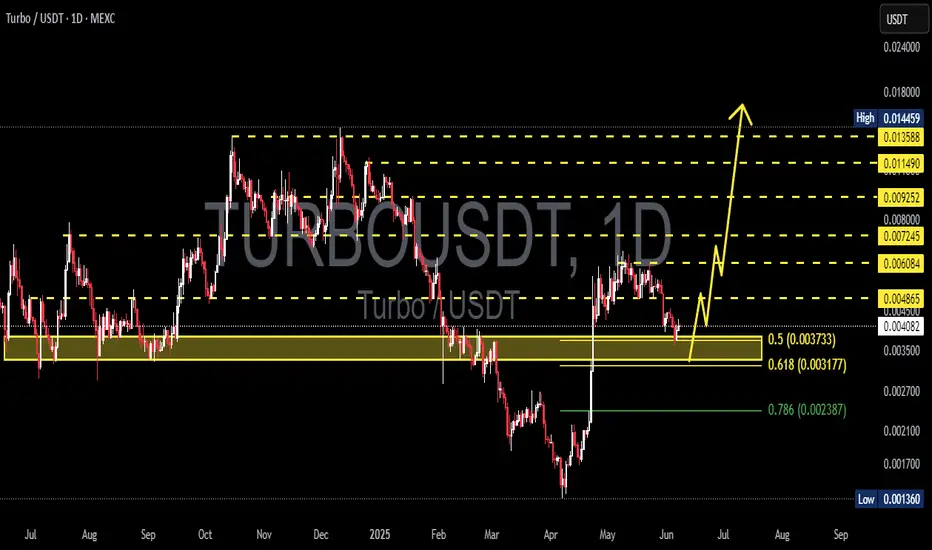
TURBOUSDT 1D#TURBO has broken above the symmetrical triangle and is now testing the support zone. This zone is further strengthened by multiple layers of support, including the Ichimoku Cloud and the SMA100 — making it a strong area for a potential bounce. We're expecting a price reversal from this zone. In case of a successful bounce, the targets are:
🎯 $0.006020
🎯 $0.007460
🎯 $0.008899
🎯 $0.010948
🎯 $0.013559
⚠️ As always, use a tight stop-loss and apply proper risk management.
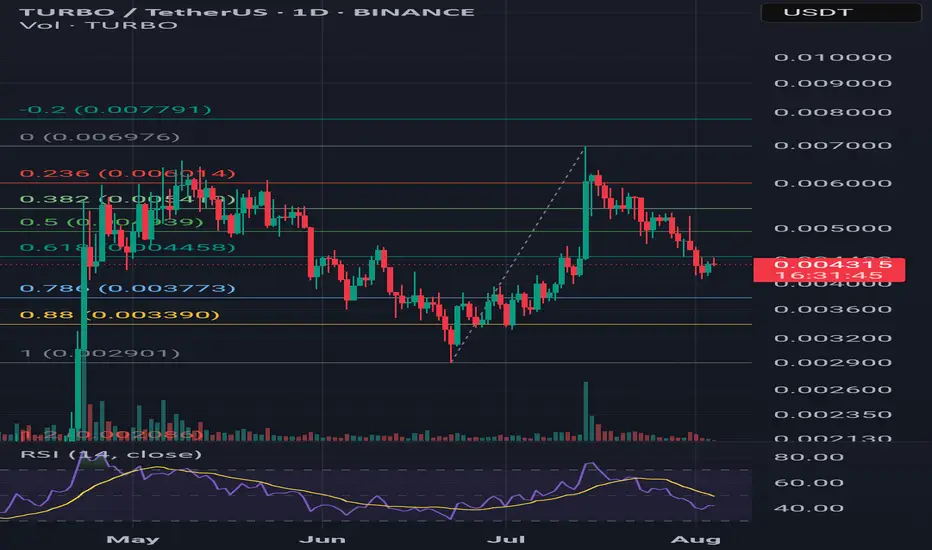
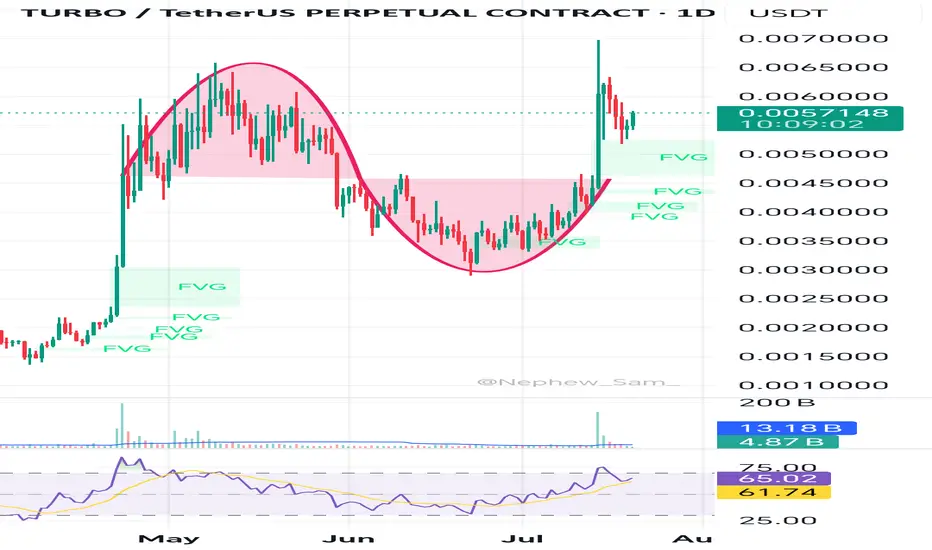
TURBO/USDT – Cup and Handle Formation (1D Chart)Overview:
TURBO/USDT is potentially forming a textbook Cup and Handle pattern on the 1-day chart. Price action suggests a rounded bottom (the “cup”) followed by a consolidation range (the “handle”), setting up for a possible breakout.
---
🔍 Pattern Structure:
- Cup Formation:
Price rallied from ~0.0029 to ~0.0060 USDT, retracing slightly from the top. This rounded rise resembles the classic cup shape.
- Handle Formation:
Recent price consolidation between 0.0042–0.0049 USDT hints at the formation of the handle. A breakout above resistance could validate the pattern.
---
📈 Key Technical Levels:
Entry Zone | 0.0047 – 0.0050 |
| Resistance (Breakout)| ~0.0060 |
| Target 1 | ~0.0064 |
| Target 2 | 0.0078 – 0.0084 |
| Stop Loss | Below 0.0042 |
🔄 Additional Indicators:
- Volume: Watch for increasing volume to confirm breakout momentum.
- RSI (14-day): Neutral zone with room for upward movement. Momentum is building.
- Fibonacci Levels: 0.618 retracement (~0.004458 USDT) has acted as a key support during handle formation.
---
💡 Idea: Monitor for a daily close above 0.0060 with volume confirmation. That could mark the beginning of a bullish continuation. Risk management is essential if price fails to hold above the handle support.
Cup and handle on TOSHIEvery time I look at the TURBO chart I can't help but see this cup and handle formation.
TURBOStill in a corrective wave with larger wave up, the correction may have ended already at 0.004842
The confirmation would be the break out of the corrective wave channel

Just a couple of lines.Depending on what waves of liquidity will be pumped from bitcoin to slagcoins,
many things are possible. Faster? Lower price.
Slower? More accumulation, stronger level protection.
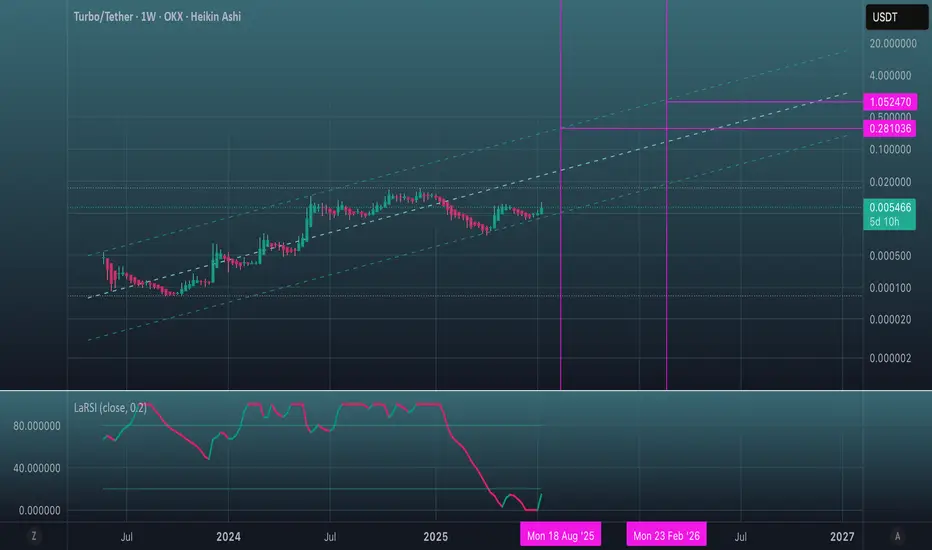
LaRSI may be preparing to storm the 20 line on the weekly chart.
Positive.
You may agree or disagree, at your discretion.
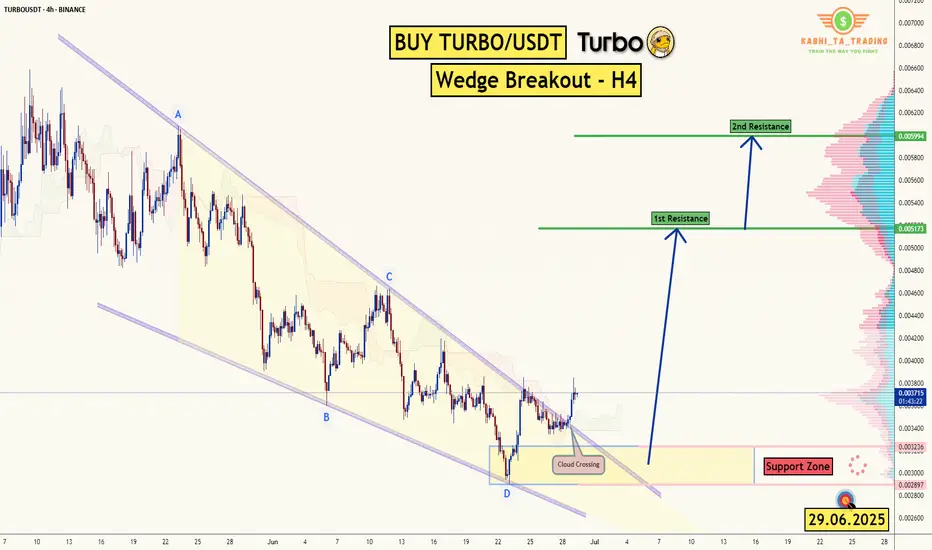
TURBO/USDT - H4 - Wedge Breakout (29.06.2025)The TURBO/USDT pair on the H4 timeframe presents a Potential Buying Opportunity due to a recent Formation of a Wedge Breakout Pattern. This suggests a shift in momentum towards the upside and a higher likelihood of further advances in the coming Days.
Possible Long Trade:
Entry: Consider Entering A Long Position around Trendline Of The Pattern.
Target Levels:
1st Resistance – 0.005173
2nd Resistance – 0.005994
🎁 Please hit the like button and
🎁 Leave a comment to support for My Post !
Your likes and comments are incredibly motivating and will encourage me to share more analysis with you.
Best Regards, KABHI_TA_TRADING
Thank you.
TURBOThe price may pull back and appears to be approaching a key support level around 0.003100 USDT, which was also a previous area of interest. There's an indicated potential for the price to find support within zone 0.003100 USDT and then rebound towards the 0.005600 USDT level. This suggests that while there might be further short-term volatility, the market could be looking for a base before attempting another move higher. Use stop loss at 0.002266 to manage your risk.

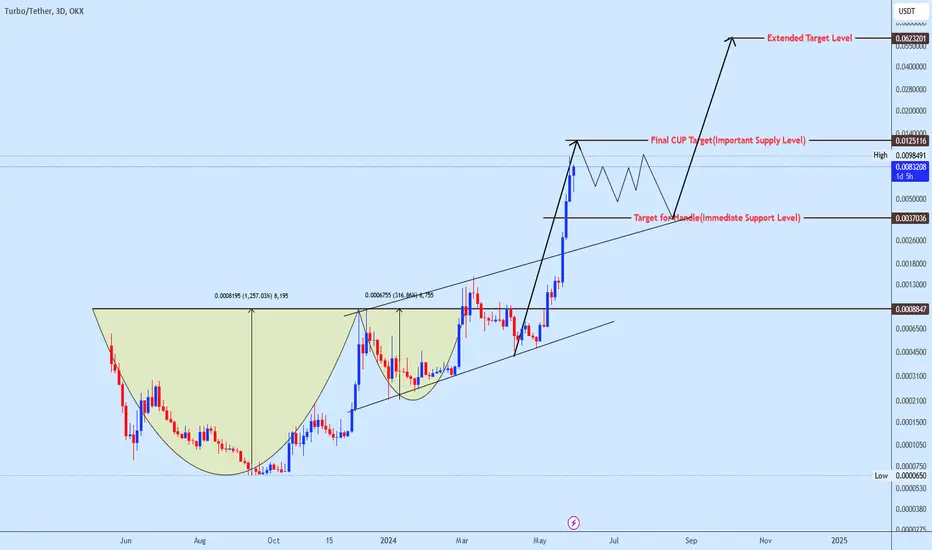
Turbousdt trade ideaTURBOUSDT has made a significant move following a breakout from a cup and handle formation. This classic bullish pattern indicates strong potential for upward momentum. The price is currently approaching the final target of this setup, which corresponds to the height of the cup.
We anticipate that this level will serve as a strong supply zone, where a price correction is likely to occur. We should be prepared for this potential correction and look to the handle level, as shown on the chart, for immediate support.
This handle level is expected to act as a key area for immediate buy back zone, potentially providing a favorable entry point for those looking to capitalize on the next phase of the trend. Careful monitoring of price action around these critical levels will be essential for effective trading decisions.
TURBO - Nailed the dropCalled this short setup last month we just hit target. A swing 45% drop happened!
Check it out here
Please support this idea with a LIKE👍 if you find it useful🥳
Happy Trading💰🥳🤗
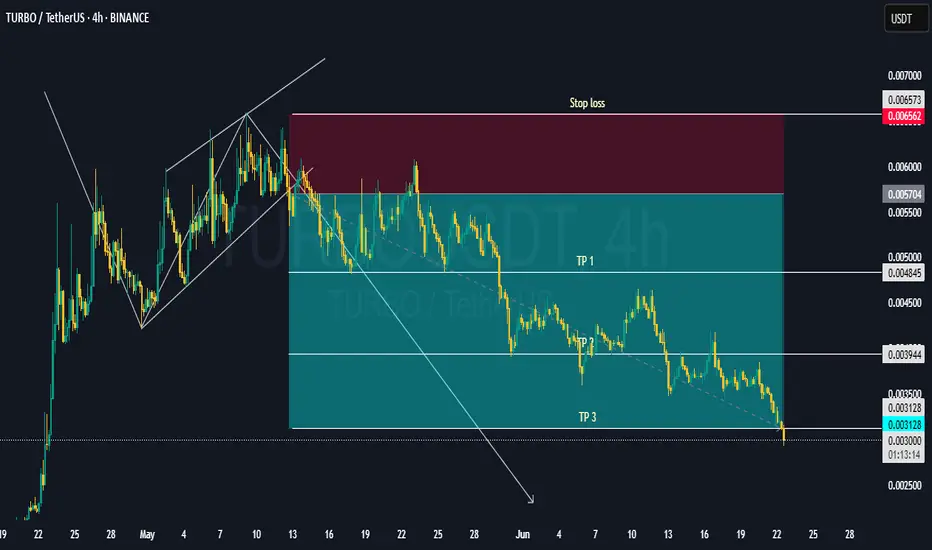
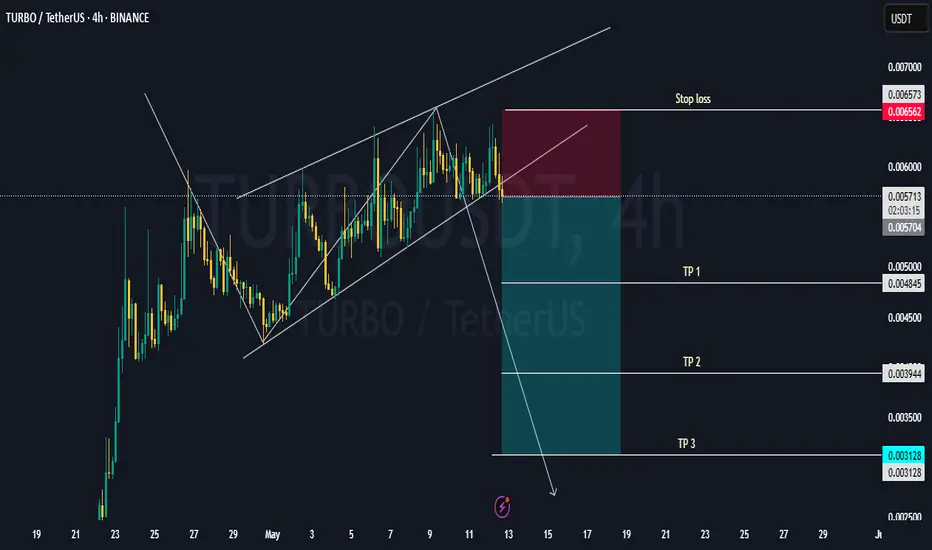
TURBO BEAR FLAG PATTERN - TIME TO SELLSeen here is MYX:TURBO breaking the support trendline and signal a downtrend. You may want to take profit here or pick a short position. For Turbo short,
Entry price: $0.005713
Stop loss: $0.006562
Take profit 1: 0.004845
Take profit 2: 0.003944
Take profit 3: $0.0031
Not a financial advice.
Please support this idea with a LIKE👍 if you find it useful🥳
Happy Trading💰🥳🤗
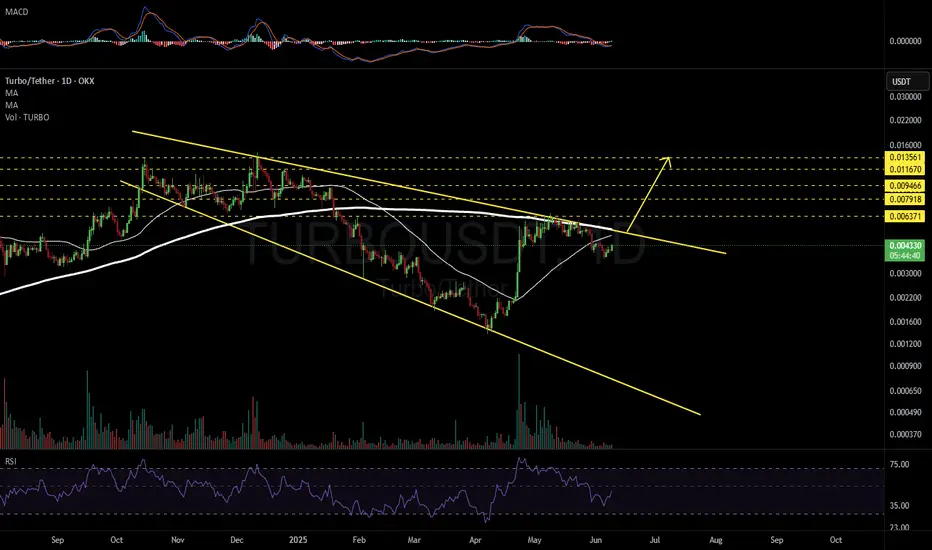
TURBOUSDT 1D#TURBO — Ready to Explode? 💥
#TURBO has formed a Megaphone Pattern on the daily chart, and a golden cross looks set to form soon — a strong bullish signal.
A breakout above the pattern resistance could trigger a massive bullish wave. If that happens, the targets are:
🎯 $0.006371
🎯 $0.007918
🎯 $0.009466
🎯 $0.011670
🎯 $0.013561
⚠️ Always use a tight stop-loss to manage risk and protect your capital.
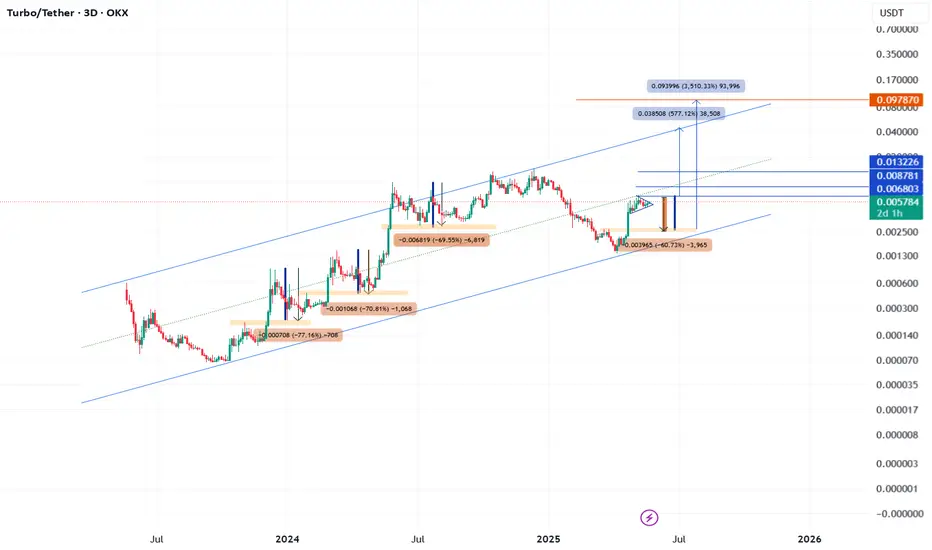
TURBOUSDT 1D AnalysisTURBO ~ 1D Analysis
#TURBO Buy gradually from here if you still have confidence in this coin with a short term target of at least 15%+ from here. Long term target $0.0145
TURBO ANALYSIS📊 #TURBO Analysis
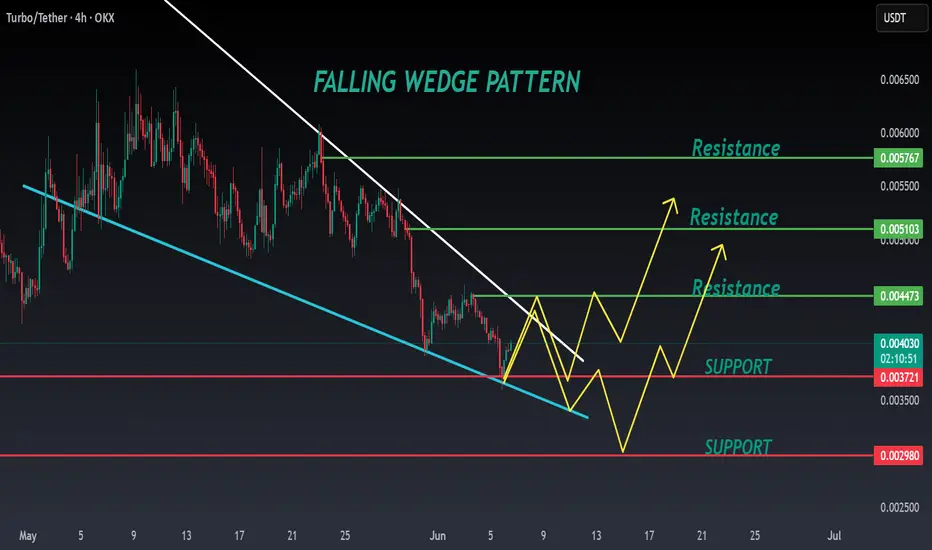
✅There is a formation of Falling Wedge Pattern on daily chart and currently pullback around its major support zone🧐
Pattern signals potential bullish movement incoming after sustain above the major support zone and breaks the pattern with good volume
👀Current Price: $0.004050
🚀 Target Price: $0.004470
⚡️What to do ?
👀Keep an eye on #TURBO price action and volume. We can trade according to the chart and make some profits⚡️⚡️
#TURBO #Cryptocurrency #TechnicalAnalysis #DYOR
TURBO USDT UPDATE The currency is being updated, but there is a warning for those who have entered it and those who want to enter it now. If you look back at its old indicators, you'll notice that it always corrects between 65% and 70%.
I wanted to point out that if it closes weekly above 0.0061.5, we'll see the targets specified above.
However, if it closes weekly below 0.0050, escape from it and you'll be headed for a 65% correction.
Buy in fear, sell in greed.Hello dears
Due to the price growth, now in the pullback you can buy in support areas in steps and move with it to the specified targets, of course with capital management.
*Trade safely with us*
TurboTurbo is cryptocurrency with low volume be careful
Entry price
0.0036
stop loss 0.0009
take profit
0.012
0.031

#TURBO/USDT#TURBO
The price is moving within a descending channel on the 1-hour frame, adhering well to it, and is heading for a strong breakout and retest.
We are seeing a bounce from the lower boundary of the descending channel, which is support at 0.005170.
We have a downtrend on the RSI indicator that is about to be broken and retested, supporting the upward trend.
We are looking for stability above the 100 moving average.
Entry price: 0.005466
First target: 0.005592
Second target: 0.005746
Third target: 0.005962

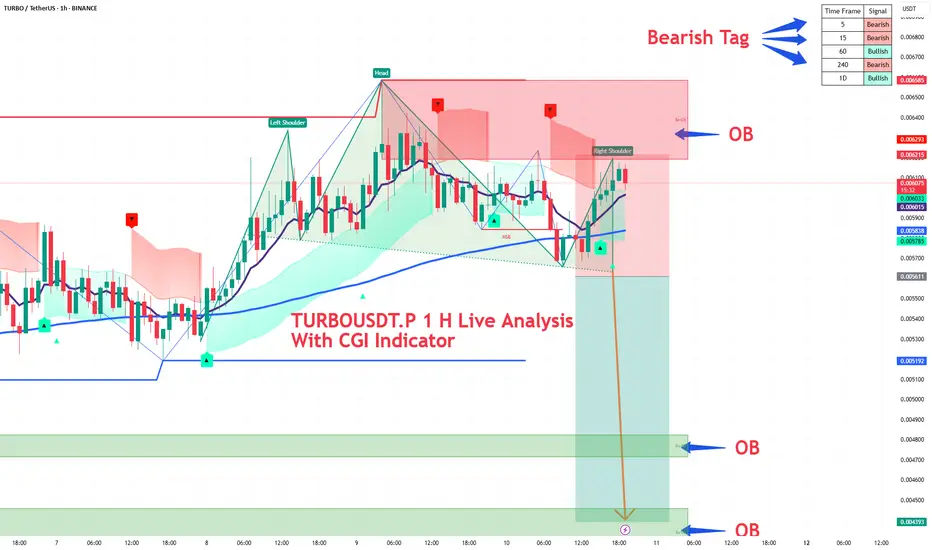
TURBOUSDT.P coin is forming a Head & Shoulder Pattern on the 1H TURBOUSDT.P coin is forming a Head & Shoulder Pattern on the 1H Time Frame.
After the chart pattern breakout, we can enter a Short Position.
According to our CGI Indicator, the 5M, 15M & 240M Time Frames are showing Bearish Tag and the 1H and 1D Charts are still showing Bullish Tag. From those two Bullish tags, 1H or Bearish Tag comes
After the Golden Cross occurs and the Short Tag comes, we can enter a Short Position.
TURBO USDTTurbo coin has finished testing the support, especially the support of 0.0012, and now it has rebounded upon touching the bottom of the channel, so I believe its next target is 0.036.
$TURBO Loading Up — Breakout Incoming?🚀 MYX:TURBO – Breakout Loading…
MYX:TURBO is showing serious signs of strength. Price has been consolidating just below key resistance, forming a classic compression zone — and higher lows continue to step in with conviction.
🟢 Key Structure:
Consistent higher lows
Tight range consolidation
Building volume = Pressure cooker setup
Once this upper resistance breaks, we could see a strong move toward $0.01+, potentially kicking off the next leg up.
📌 Watching for:
Break and retest of resistance zone
Surge in volume on breakout
Quick momentum toward target
This setup screams low-risk, high-reward with a clean invalidation below recent swing lows.
Breakout season is here. Don’t sleep on $TURBO.