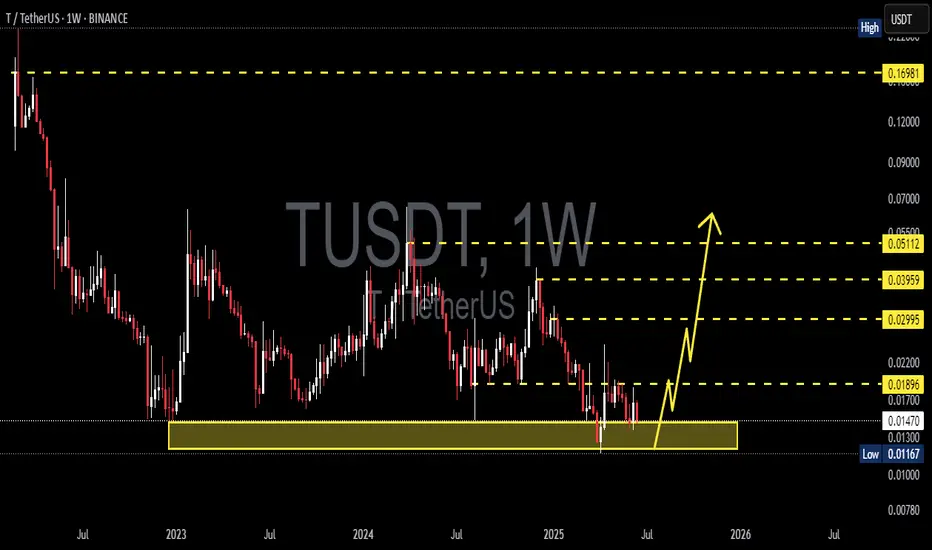
TUSDT 1W AnalysisTUSDT ~ 1W Analysis
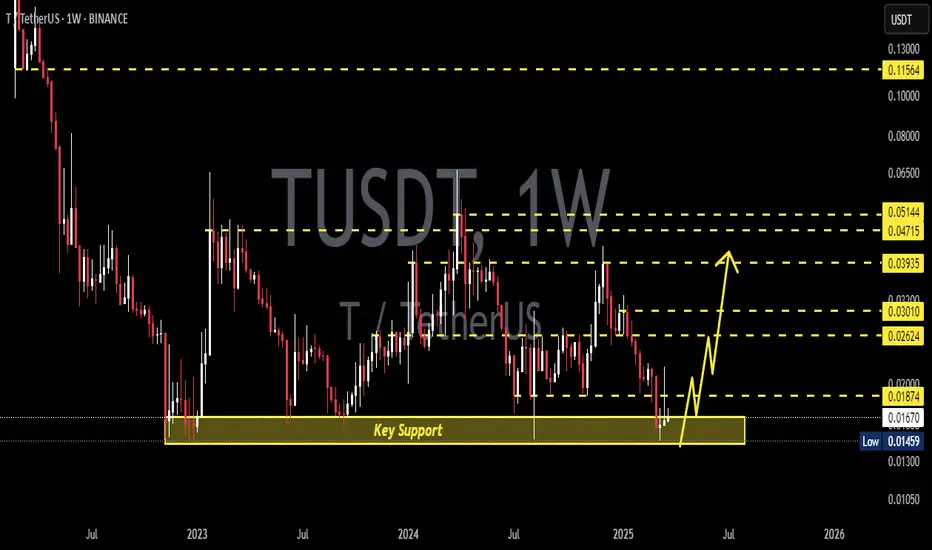
#TUSDT This trade is very high risk. Buy if you still have confidence in this coin with a short term target of at least 20%++
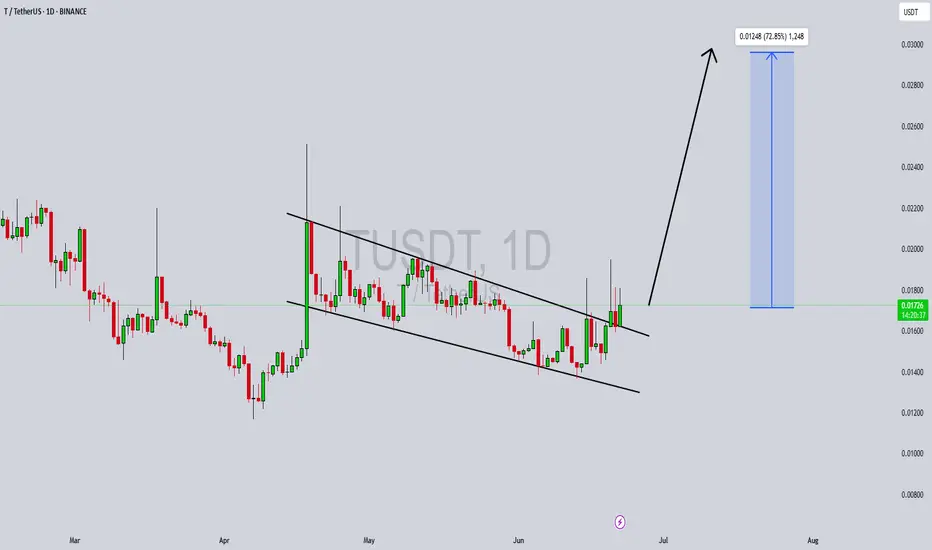
TUSDT Forming Descending Channel TUSDT is currently trading within a clearly defined descending channel pattern, which is a classic bullish reversal signal when identified in the right market context. After a prolonged period of correction, the price is now consolidating within the lower boundary of the channel, signaling that a po
#T/USDT#T
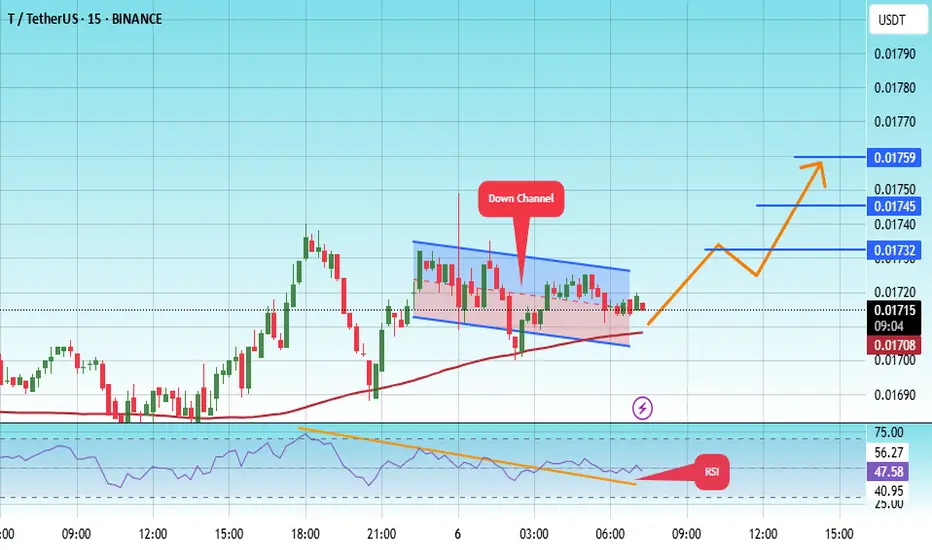
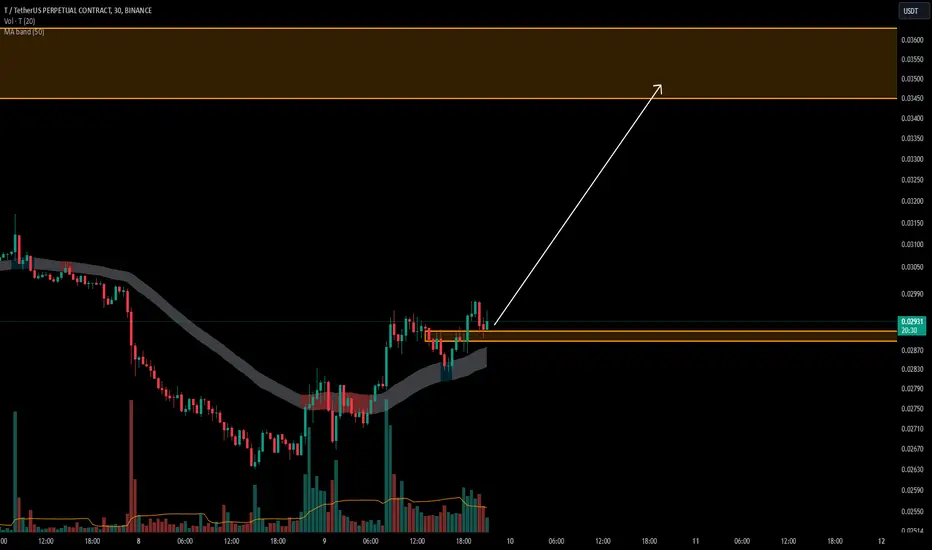
The price is moving within a descending channel on the 1-hour frame, adhering well to it, and is heading for a strong breakout and retest.
We are seeing a bounce from the lower boundary of the descending channel, which is support at 0.01704.
We have a downtrend on the RSI indicator that is abou
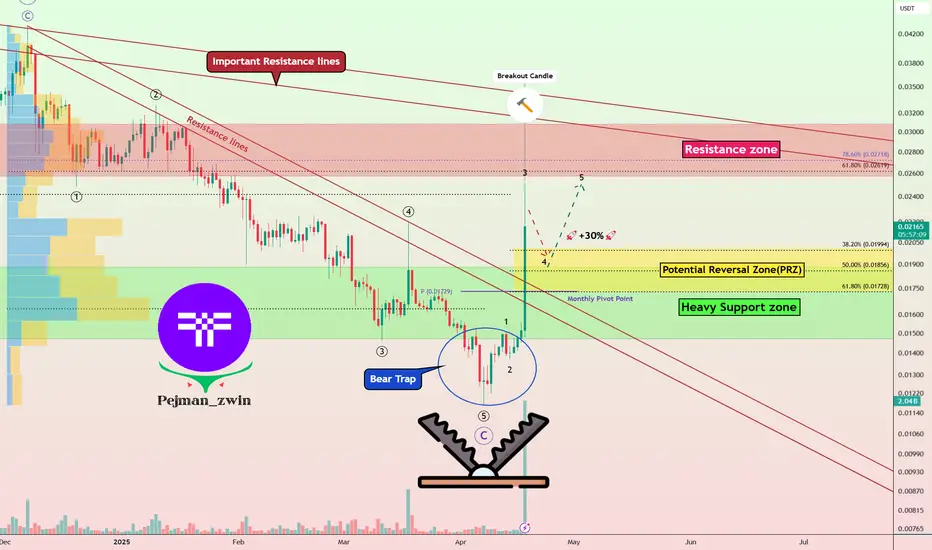
Threshold Network(T) Analysis: From Bear Trap to Bullish TrendAs long as Bitcoin ( BINANCE:BTCUSDT ) and Ethereum ( BINANCE:ETHUSDT ) are in a range, it is a good opportunity to take advantage of the movement of other tokens and take a look at their charts.
Today, I want to analyze the Threshold( BINANCE:TUSDT ) project for you, which has increased by
TUSDT 1WT ~ 1W Analysis
#T This trade is very high risk. Buy from here with a short -term target of at least 20%+. This is the lowest support for now.
T/USDT: The Bottom!Trading Strategy for T/USDT
Update:
T has reached its bottom level of $0.0146. Based on historical price action, it rebounded 300% after hitting this exact level.
Trade Setup:
~ Accumulation: $0.0145 – $0.018
~ Target 1: $0.054
~ Target 2: $0.172
~ Trade Type: Spot
~ Timeframe: Q4 2025
Note: Thi

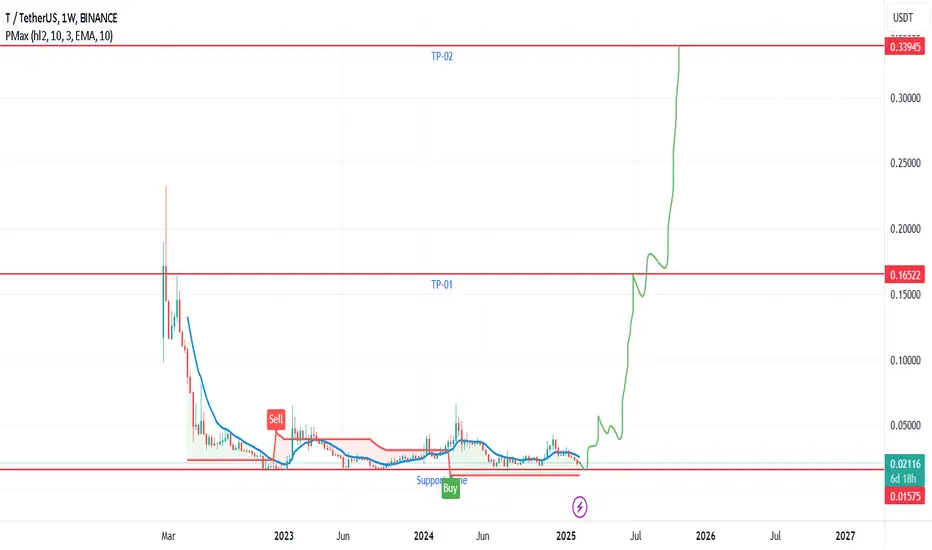
T USDT Simple AnalyisisBuying Condition-- If Weekly Candle closes above 0.015
Stoploss Condition-- If Weekly Candles closes below 0.015
Just Very Simple Myth
Targets are shown in the graph with Red lines TP-01 and TP-02
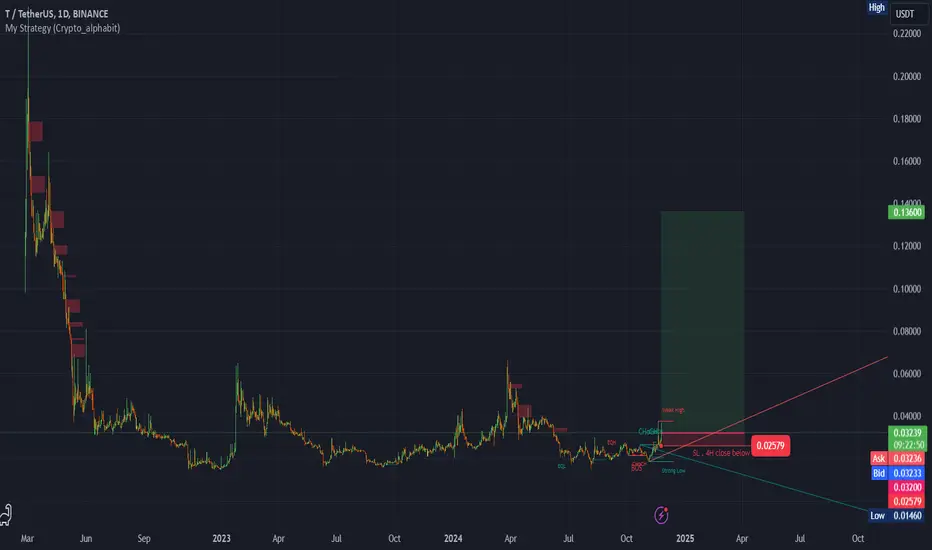
TUSDT 1D#T has broken the falling wedge pattern on the daily chart and is now facing the MA50. In case of a breakout above the MA50, the targets are:
🎯 $0.03401
🎯 $0.03684
🎯 $0.03967
🎯 $0.04370
🎯 $0.04884

T/USDTKey Level Zone : 0.02888 - 0.02910
HMT v4.1 detected. The setup looks promising, supported by a previous upward/downward trend with increasing volume and momentum, presenting an excellent reward-to-risk opportunity.
HMT (High Momentum Trending):
HMT is based on trend, momentum, volume, and market
#T (SPOT) entry (0.026- 0.032) T.(0.13600) SL(0.02579)BINANCE:TUSDT
entry range (0.026- 0.032)
Targets ( .034 - .045 - .048 - .059 - 0.065 - 0.095 - 0.1149 - 0.136 )
SL .4H close below (0.02579)
______________________________________________________________
Golden Advices.
********************
* collect the coin slowly in the entry range.
See all ideas
Summarizing what the indicators are suggesting.
Oscillators
Neutral
SellBuy
Strong sellStrong buy
Strong sellSellNeutralBuyStrong buy
Oscillators
Neutral
SellBuy
Strong sellStrong buy
Strong sellSellNeutralBuyStrong buy
Summary
Neutral
SellBuy
Strong sellStrong buy
Strong sellSellNeutralBuyStrong buy
Summary
Neutral
SellBuy
Strong sellStrong buy
Strong sellSellNeutralBuyStrong buy
Summary
Neutral
SellBuy
Strong sellStrong buy
Strong sellSellNeutralBuyStrong buy
Moving Averages
Neutral
SellBuy
Strong sellStrong buy
Strong sellSellNeutralBuyStrong buy
Moving Averages
Neutral
SellBuy
Strong sellStrong buy
Strong sellSellNeutralBuyStrong buy
Displays a symbol's price movements over previous years to identify recurring trends.