GER 30Weekly predictionFX:GER30
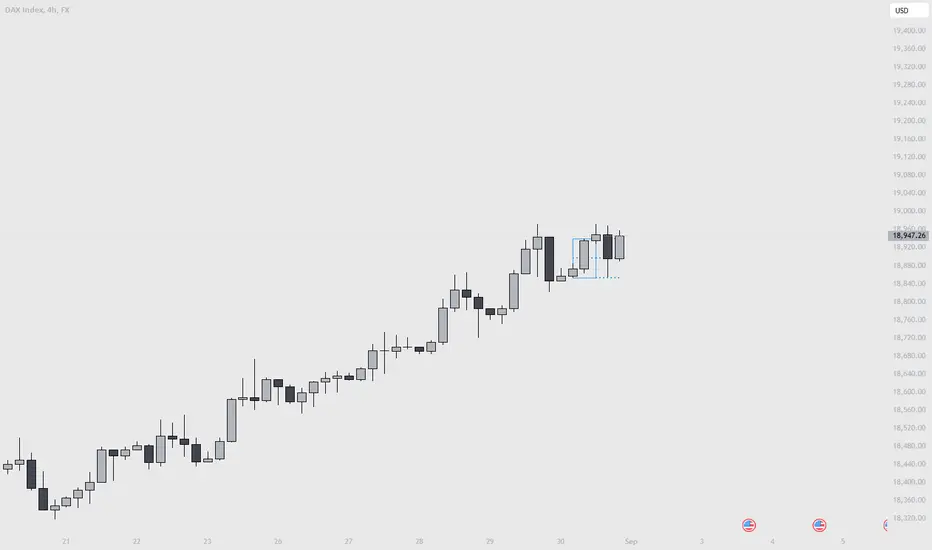
The DAX index has returned to the upper limit of the range. Here we will wait for the development of the price movement behavior.
DEU40 trade ideas
$DAX Weekly Analysis
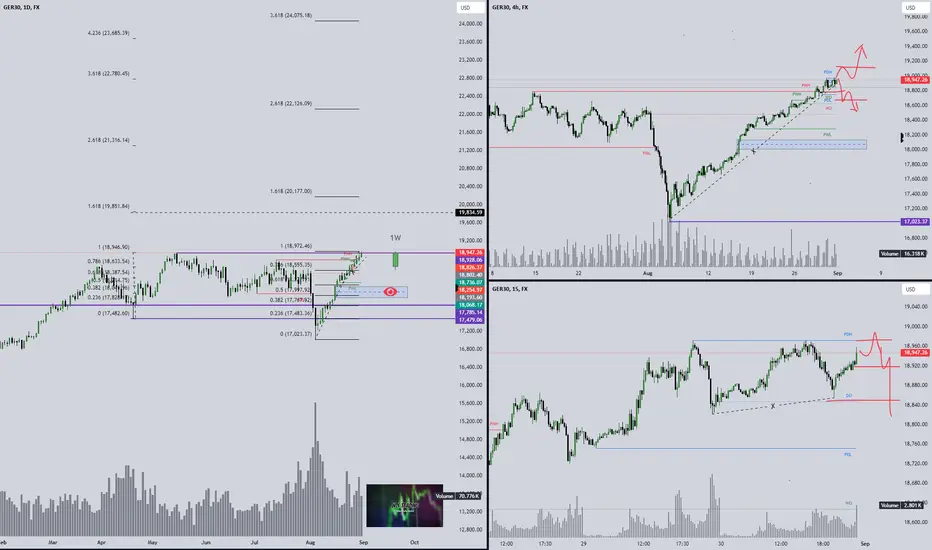
On the weekly timeframe, We are looking at price action with three bullish soldiers. This indicates a strong move towards the bullish direction. Market structure also indicates a light move-up before a retest takes place.
On the daily, we may have tapped into ERL now expecting a quick sell to previous highs for a possible continuation to the upside
4H TF looks bland and consolidation-like... After Monday plays out we may see some intent with it.
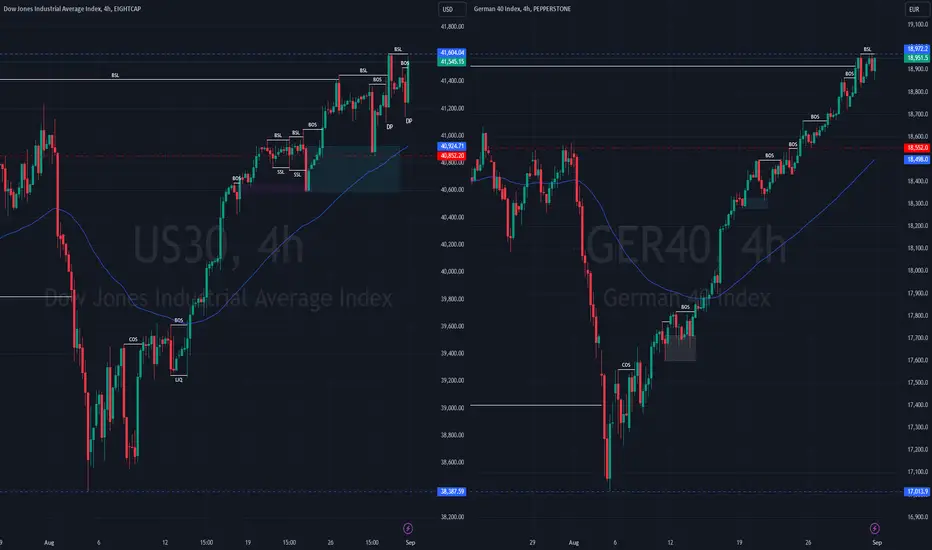
01.09.24As we have seen price has been reaching new all time highs due since August sell of. What is pricing the charts is the announcement of cutting interest rates for the Economy.
What will be in focus this new coming month and week is Friday NFP prior to Wednesday JOLTs job opening and Thursdays Inital Jobless claims.
US30: US30 has jumped past Julys all time highs at 41414.72 and Monday highs at 41447.86. I'd like to see price pushing past 41604.04 this week.
GER40: Price seemed to sail smoothly to break previous all time highs at 18916.9 and has seemed to hault at the top of that range. I will like to see price push past 18972.2 during this week
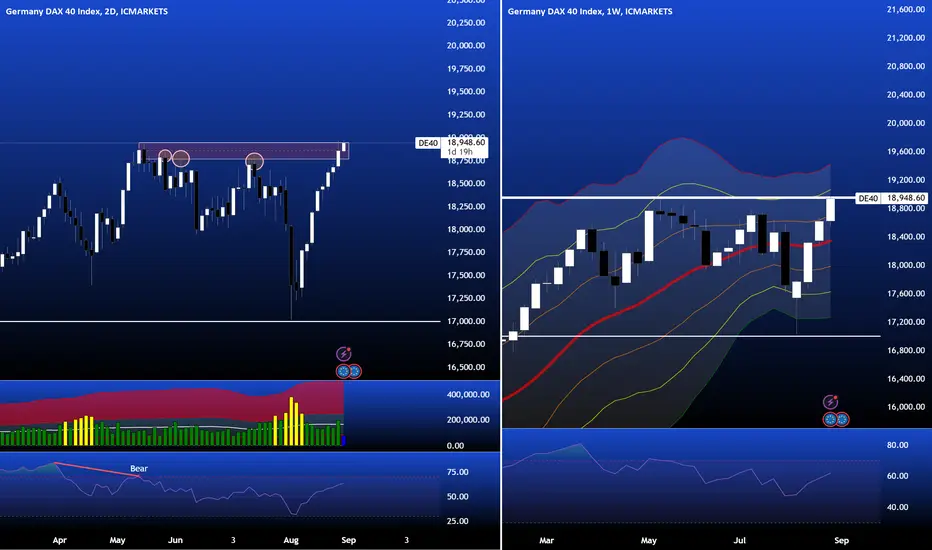
Dax - 3 White Soldiers If we look at the Dax for early August, 2 bullish overlapping weekly candlestick formations are apparent
1. Morningstar - Firstly price HAMMERS's a low at 17,000 , wicking the 3rd Standard Deviation Channel. We then have an extended range bullish candle move near 2 standard deviations , to complete the Morningstar.
2. Three White Soldiers - this last bullish candle and the following 2 , together are 3 white candles with successive HH and HL. The second candle in this formation actually gaps the first with the weekly open, adding impetus to the bullish move.
The Dax is at ATH with a price of 18948.60. It is still within the 2nd Standard Deviation Channel, and room to move up. The weekly RSI is printing 62. It reflects a buy signal, and it is a long way from oversold.
The Daily Chart shows price has entered the Supply Zone with strong conviction. This is the 4th test of this Zone. A higher probability exists for selling pressure to have abated by now.
IF we look at the VSA, Volume in the uptrend has been Average . There is no blow off. Furthermore, the last daily candle was below average. The Bulls with little volume, were able to move price easily up through this zone ( no selling pressure).
With 9 bullish daily candlesticks in a row, there has to be some retracement. It is likely to be small, probably some form of multiple Doji, narrow range candles.
Client Sentiment has 84% of traders net short. They are likely backing this retracement. A contrarian view suggests the index will rise.
Technically , there is conviction for the Dax to rise
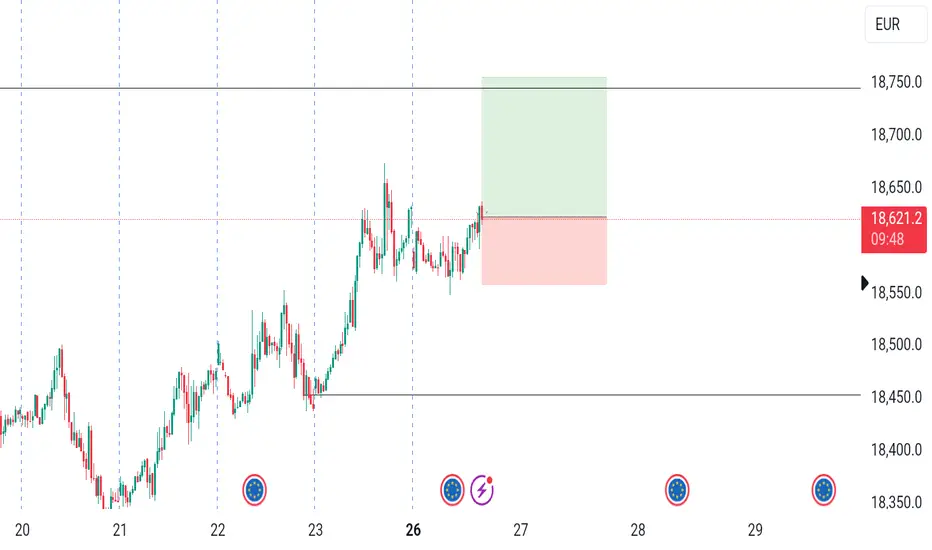
GER30GER30 has been going up for a while now, I am interested seeing it drop, but before it drops, I will be happy to see a small retracement up, thats where we will be executing trades, sniper entry or nothing, Lets Download Succes s
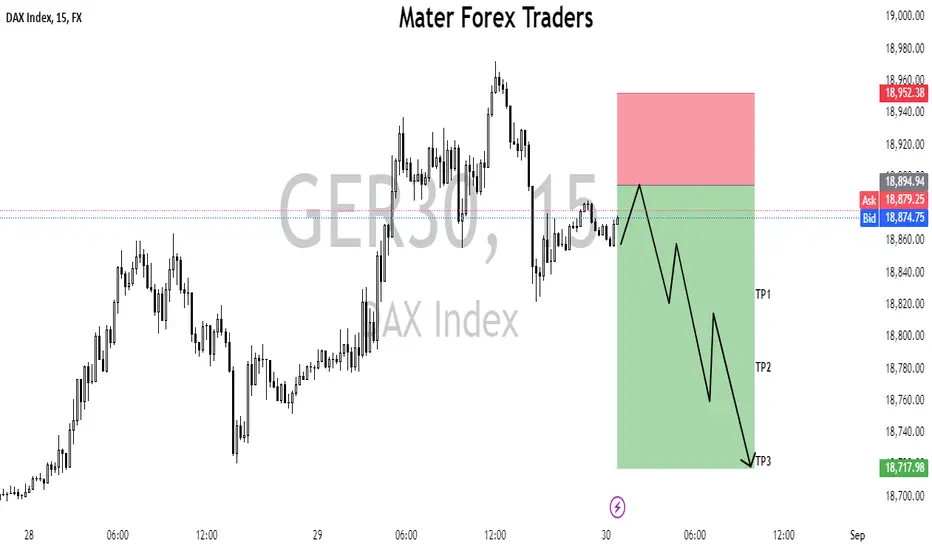
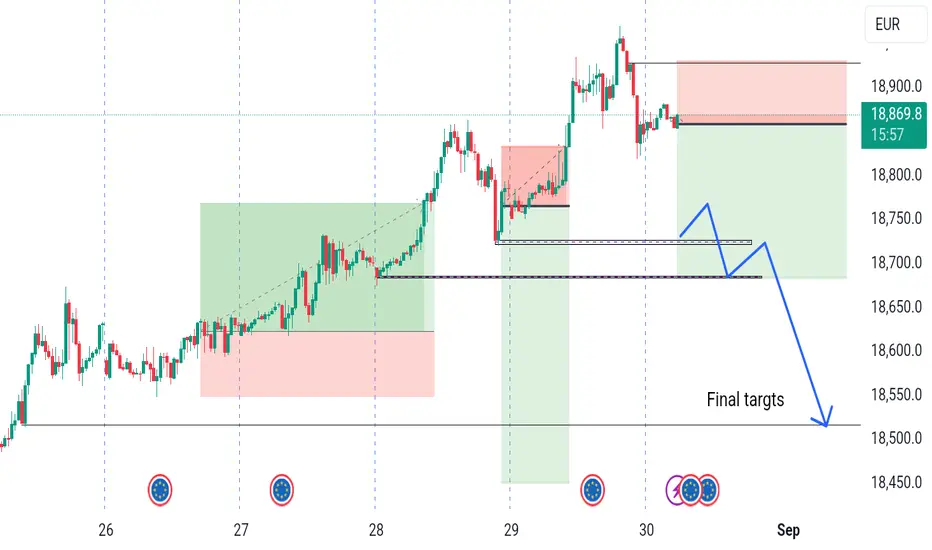
GET READY TO SHORT DAX/GER30 OR 40Good evening to everyone,
We have not seen a beautiful pricing like this for a while.
We found good opportunity once the price hit 18933 to short, with stop loss at 18977
Target 1 18889
Target 2 - 18819
Target 3 - 18761
Please note, once the price hit first target, take some partial profit, trail stop loss to 18937 then continue to focus on second target and so on.. any strong trend pull back then get out.

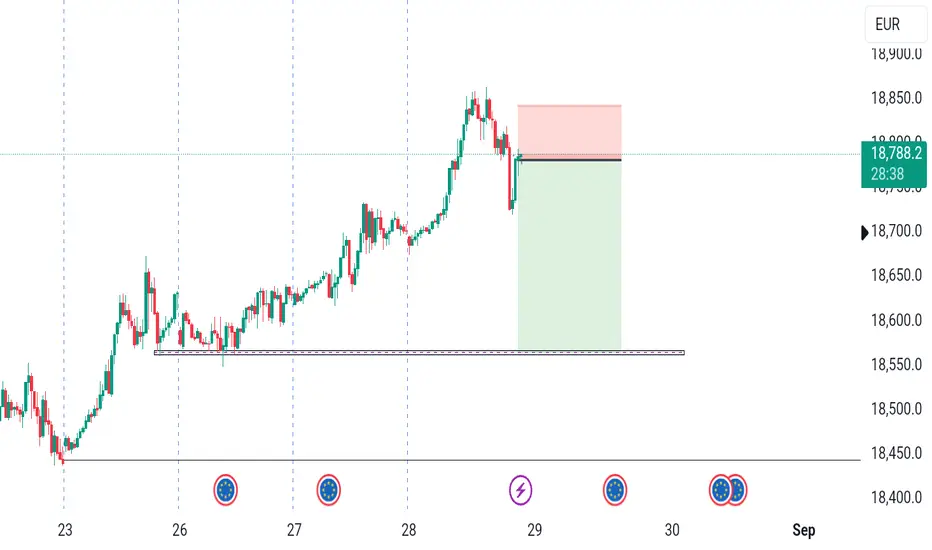
DE40- SHORT Trade Call - 4H SWINGOn 4h scale bearish divergence on RSI has formed indicating a likely trend reversal. On Daily TF price is kind of slowing down as well.
SWING Trade SHORT (Sell) values :
Entry : 18710
SL: 18980
TP1: 18440
TP2: 18180
TP3: 17920

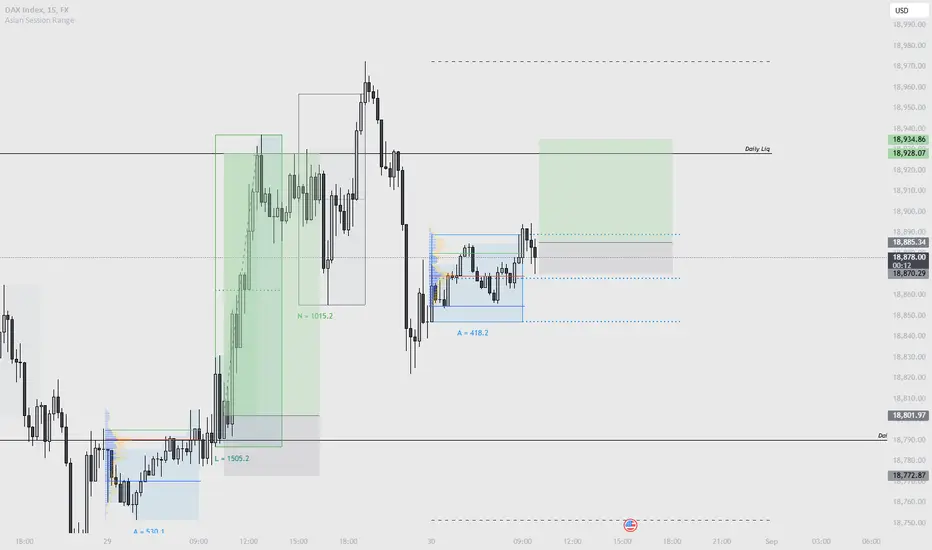
CRT + Liquidity Sweep on the DAXLet's make Money!!!
Trade responsibly and apply proper risk management. Happy Weekend

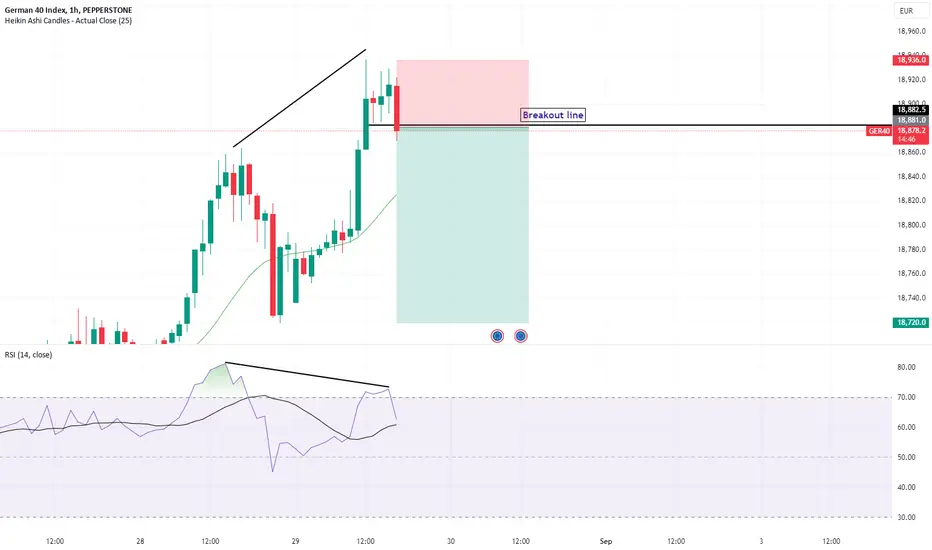
Short GER40price marking a bearsih divergence and break their last HL
Entry Point :18882
Stoploss : 18936
TP1 18828
TP2 18774
TP3 18720
TP4 18666
DAX H4 | Strong bullish momentumDAX (GER30) is looking to make a bullish break above a swing-high resistance and could potentially rise higher from here.
Buy entry is at 18,855.31 (wait for the 1-hour candle to close above this level for confirmation).
Stop loss is at 18,700.00 which is a level that lies underneath an overlap support.
Take profit is at 19,008.06 which is a resistance that aligns with the 127.2% Fibonacci extension level.
High Risk Investment Warning
Trading Forex/CFDs on margin carries a high level of risk and may not be suitable for all investors. Leverage can work against you.
Stratos Markets Limited (www.fxcm.com):
CFDs are complex instruments and come with a high risk of losing money rapidly due to leverage. 62% of retail investor accounts lose money when trading CFDs with this provider. You should consider whether you understand how CFDs work and whether you can afford to take the high risk of losing your money.
Stratos Europe Ltd (www.fxcm.com):
CFDs are complex instruments and come with a high risk of losing money rapidly due to leverage. 59% of retail investor accounts lose money when trading CFDs with this provider. You should consider whether you understand how CFDs work and whether you can afford to take the high risk of losing your money.
Stratos Trading Pty. Limited (www.fxcm.com):
Trading FX/CFDs carries significant risks. FXCM AU (AFSL 309763), please read the Financial Services Guide, Product Disclosure Statement, Target Market Determination and Terms of Business at www.fxcm.com
Stratos Global LLC (www.fxcm.com):
Losses can exceed deposits.
Please be advised that the information presented on TradingView is provided to FXCM (‘Company’, ‘we’) by a third-party provider (‘TFA Global Pte Ltd’). Please be reminded that you are solely responsible for the trading decisions on your account. There is a very high degree of risk involved in trading. Any information and/or content is intended entirely for research, educational and informational purposes only and does not constitute investment or consultation advice or investment strategy. The information is not tailored to the investment needs of any specific person and therefore does not involve a consideration of any of the investment objectives, financial situation or needs of any viewer that may receive it. Kindly also note that past performance is not a reliable indicator of future results. Actual results may differ materially from those anticipated in forward-looking or past performance statements. We assume no liability as to the accuracy or completeness of any of the information and/or content provided herein and the Company cannot be held responsible for any omission, mistake nor for any loss or damage including without limitation to any loss of profit which may arise from reliance on any information supplied by TFA Global Pte Ltd.
The speaker(s) is neither an employee, agent nor representative of FXCM and is therefore acting independently. The opinions given are their own, constitute general market commentary, and do not constitute the opinion or advice of FXCM or any form of personal or investment advice. FXCM neither endorses nor guarantees offerings of third-party speakers, nor is FXCM responsible for the content, veracity or opinions of third-party speakers, presenters or participants.

DAX ahead of a mega 1W Bullish Cross.Last month (July 15, see chart below), we made a bold Megaphone prediction on DAX (FDAX1!), which delivered both an excellent sell opportunity and a bottom buy entry:
The situation now is more difficult as despite DAX's recovery, the U.S. markets are under a certain degree of volatility. We need to zoom out to the 1W time-frame to answer that and get a better understanding of the long-term trend.
The key development will be the upcoming formation of a 1W MACD Bullish Cross. It will be the first since November 20 2023, which was in fact the last time the index hit and rebounded on the 1W MA100 (green trend-line), forming the previous Higher Low of the 2-year Channel Up.
As a result, having already tested and rebounded earlier this month on the 1W MA50 (blue trend-line) for the first time in 9 months, we believe that the current 4-week green rally will be extended.
The last two Bullish Legs of the Channel Up initially rose by +16.74% and +23.84% before their first corrective pull-back. As a result, our Target on the medium-term is 19800 (+16.74% rise from the recent bottom).
-------------------------------------------------------------------------------
** Please LIKE 👍, FOLLOW ✅, SHARE 🙌 and COMMENT ✍ if you enjoy this idea! Also share your ideas and charts in the comments section below! This is best way to keep it relevant, support us, keep the content here free and allow the idea to reach as many people as possible. **
-------------------------------------------------------------------------------
💸💸💸💸💸💸
👇 👇 👇 👇 👇 👇

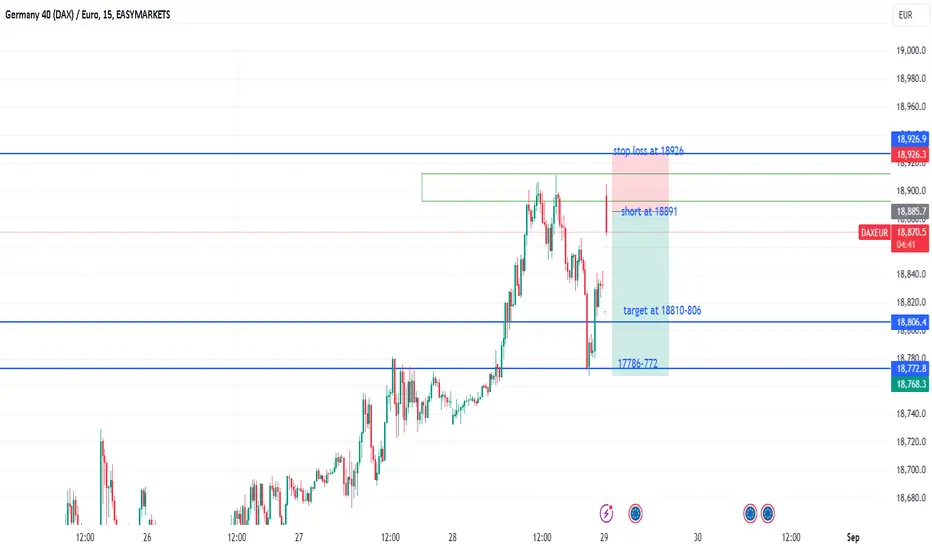
SHORTING DAX40.GER 40Team shorting DAX40 hurry,
We are expecting a little reversal for DAX
stop loss at 18926
target at 18810 and 18786