DXYThe current COT data shows a bullish bias for the U.S. Dollar, with institutional traders positioning net long. Although DXY is moving sideways, this positioning suggests a likely continuation of USD strength. If price breaks above key resistance levels, it would confirm the bullish sentiment reflected in the COT report.
DXY trade ideas
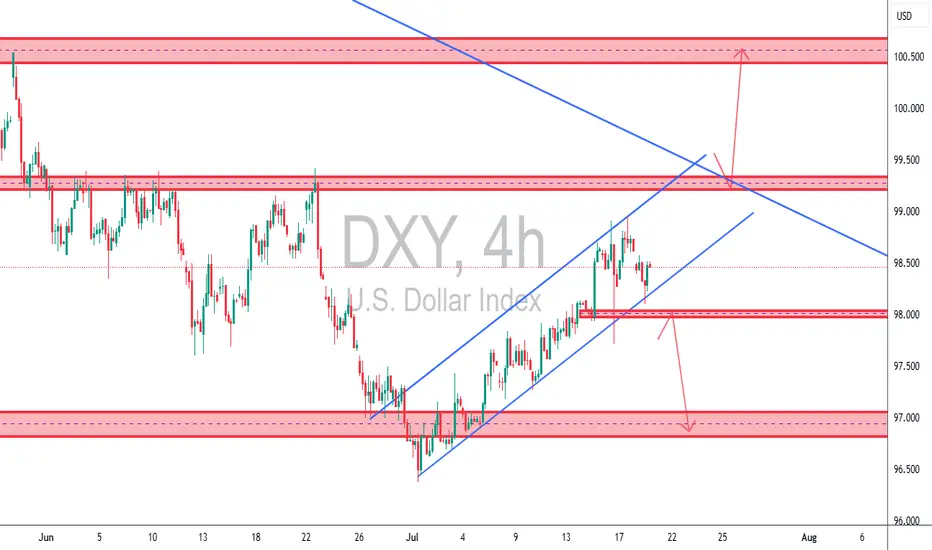
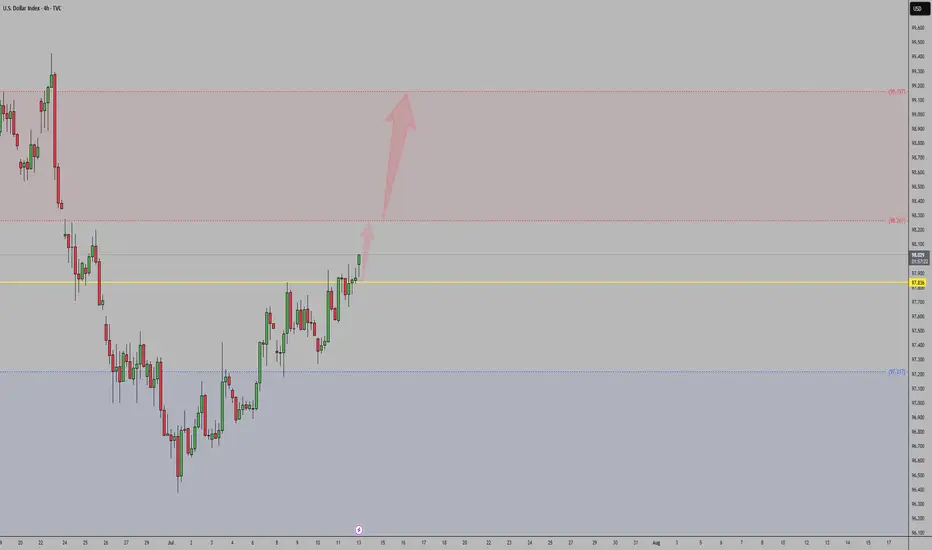
TCB Strategy Application on DXY 4H✅ TCB Strategy Application on DXY 4H
🔹 Trend → Countertrend → Breakout Structure:
• Trend: We’ve had a bullish recovery from the 97.00 zone (bottom demand), moving within an ascending channel.
• Countertrend Zone: Price has now pulled back from the 99.00–99.200 supply area.
• Breakout Watch:
o A break below the ascending channel (support line) + 98.00 zone would signal countertrend breakout → opens potential for 97.000 retest.
o A break above 99.200 would be a bullish breakout targeting the 100.500–101.000 macro supply zone.
________________________________________
🔄 What This Means for Dollar Pairs (Especially XAUUSD):
🟥 Scenario 1: Bearish DXY Breakout (98.00 loss)
• Expect XAUUSD bullish continuation, possibly reclaiming upside zones (especially if DXY targets 97.00).
• GBPUSD, EURUSD, etc., likely to gain against USD.
🟩 Scenario 2: Bullish DXY Breakout (Above 99.200)
• XAUUSD may reject from resistance or fall back toward support zones.
• USD strength will put pressure on GBPUSD, EURUSD, and other majors.
________________________________________
🧠 TCB Notes:
• Checklist Score (Pre-Breakout): ~75%
o ✔ Structure zones marked
o ✔ Channel support tested
o ✔ Reaction to supply zone
o ✖ Awaiting breakout candle + NY session confirmation
________________________________________
🔔 Suggested Alerts (Set in TradingView):
• DXY Breakout Alert: 98.00 (bearish trigger)
• DXY Bullish Trigger Alert: 99.20 or trendline breakout
• Match these alerts with corresponding TCB setups on XAUUSD, GBPUSD, etc.
FX Matrix: DXY, EUR/USD, GBP/USD Weekly AnalysisWeekly Targets: (Gun to my head)
DXY: 99.957, 100.424, 100.689
GBPUSD: 1.31643, 1.31453,

DXY Indecisive
DXY remains locked in its previous week's range, especially locked in Wednesday's range.
The Thursday rally above Wednesday's high appears to be a fake breakout aimed at trapping traders long.
With stops seemingly below Wednesday (Previous Week Low), how we trade past the previous week high or/and low should inform the unfolding direction.
With a run to the previous week's low and high possible, caution is recommended. Await expansion avoid the surge of new's release in the coming week and the choppiness that could unfold.

DXY area to watch.Approaching the extreme of the recent bearish leg. If it holds, then expect most major pairs (EURUSD, GBPUSD etc) to continue their upside momentum. If it fails, then we can expect to see further downside moves on the majors.
As per my strategy. That extreme POI swept a previous high, created the BOS, and sits beautifully on the 71% retracement level. The majority of my confluences are ticked, just missing that clear 'Imbalance'. So now we wait, and monitor the reaction on the 4H. If we see a nice clean liquidity sweep, BOS + Imbalance then I'm in for sells.
Let me know your thoughts, anything can happen!
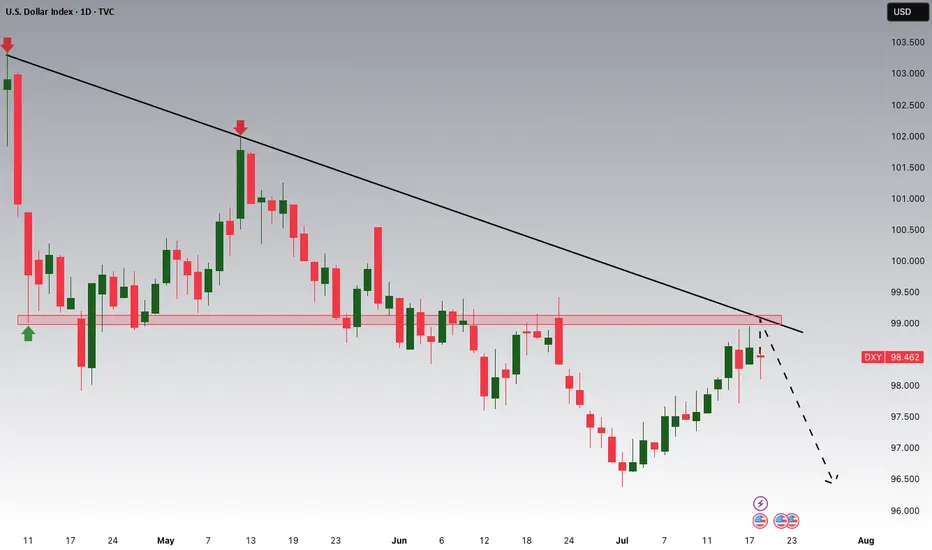
DXY Potential DownsidesHey Traders, in the coming week we are monitoring DXY for a selling opportunity around 99.000 zone, DXY is trading in a downtrend and currently is in a correction phase in which it is approaching the trend at 99.000 support and resistance area.
Trade safe, Joe.
DXY – Short-Term OutlookThis week, we’ll be analyzing several currency pairs that are showing promising trading setups.
Unlike previous weeks, we plan to focus on lower timeframes and shorter market cycles to take advantage of more agile trading opportunities.
If the price manages to give us a clear confirmation within the marked zone, we can start considering a potential shift to a bullish trend on DXY.
This would set the stage for preparing long positions, as market structure would likely begin aligning in favor of the bulls.
Until that confirmation arrives, we stay cautious and wait for price action to validate the move.

DXYShort-Term Bearish DXY – Key Reasons
1. Rate Cut Expectations
Markets are pricing in at least one Fed rate cut in Q3 2025 due to slowing inflation and weaker consumer data.
Lower interest rates reduce demand for the dollar, pushing DXY lower.
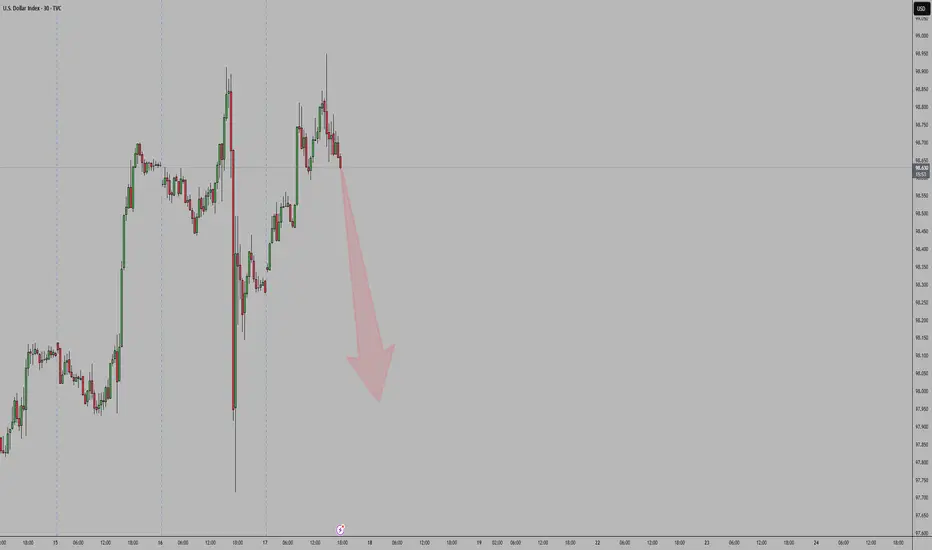
DXY BEARISH PROBABILITYThe DXY has shown a strong bearish probability after attaining the weekly premium as guided by the ICT model and BTMM.I suppose the move will be sustained as indicated else we stop at the determined level
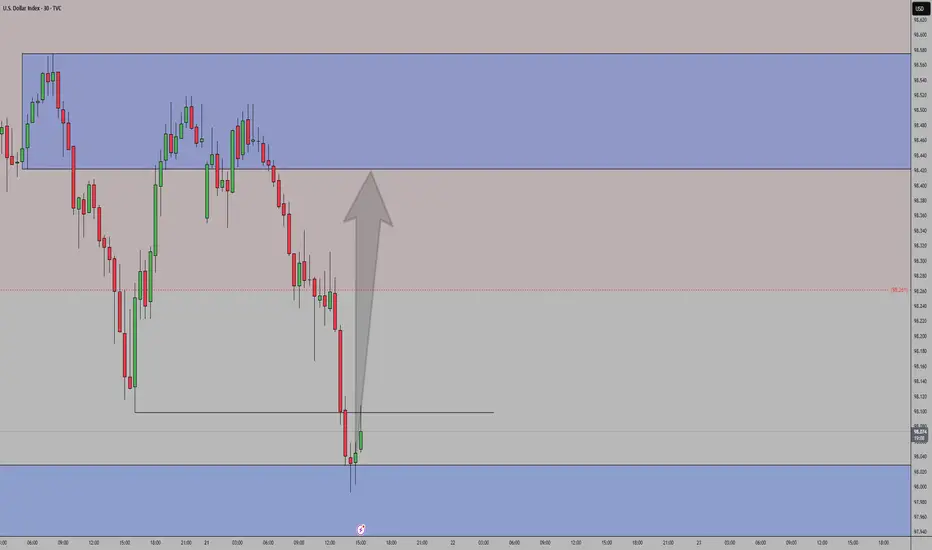
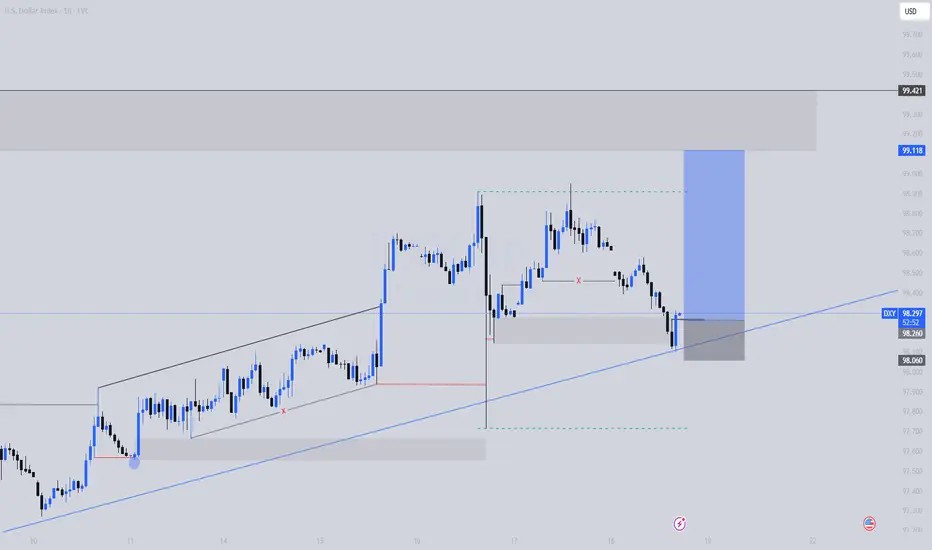
DXY LONG SETUP | Skyrocketinggggg
This is a bullish setup on the U.S. Dollar Index (DXY), taken from the 1H timeframe using Smart Money Concepts.
Price retraced into a clearly defined 1H demand zone where it also tapped a trendline support, creating a strong confluence +an LQC. The zone had internal liquidity swept and price mitigated a bullish order block, indicating potential institutional re-accumulation.
Entry was taken after bullish confirmation within the zone (engulfing candle), aligned with my SMC strategy which targets liquidity grabs and mitigation zones.
🔹 Entry: 98.06
🔹 SL: 97.83 (below the zone and structure)
🔹 TP: 99.11 (previous H1 high & clean supply zone)
🔹 RR: Approx. 4.5R
🔍 Technical Confluences:
Demand zone + OB mitigation + LQC
Trendline reaction (support respected)
Liquidity sweep + BOS (Break of Structure)
Clean imbalance above = fuel for price
Bullish engulfing as confirmation
📰 Fundamental Bias:
Today’s U.S. Jobless Claims came in better than expected, signaling labor market strength. Additionally, Retail Sales data was positive, reinforcing USD strength. These support a hawkish Fed narrative, aligning with our bullish technical setup.
Bias remains bullish unless price closes below 97.83 (invalidation level).
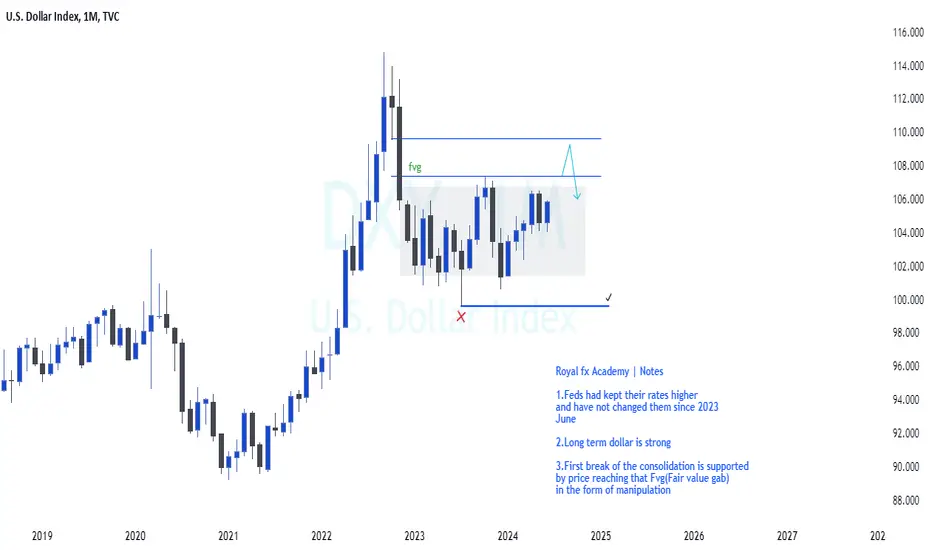
Dollar Index Macro analysisCurrently the Fed's Dollar is kept at 5.50% which is higher than any other currency except for the Kiwi , As we all know interest have high impact on currency prices. We are currently in a consolidation market profile. Therefore my interest is where the next expansion will be at, Clearly defined on my analysis it should be on the upside.

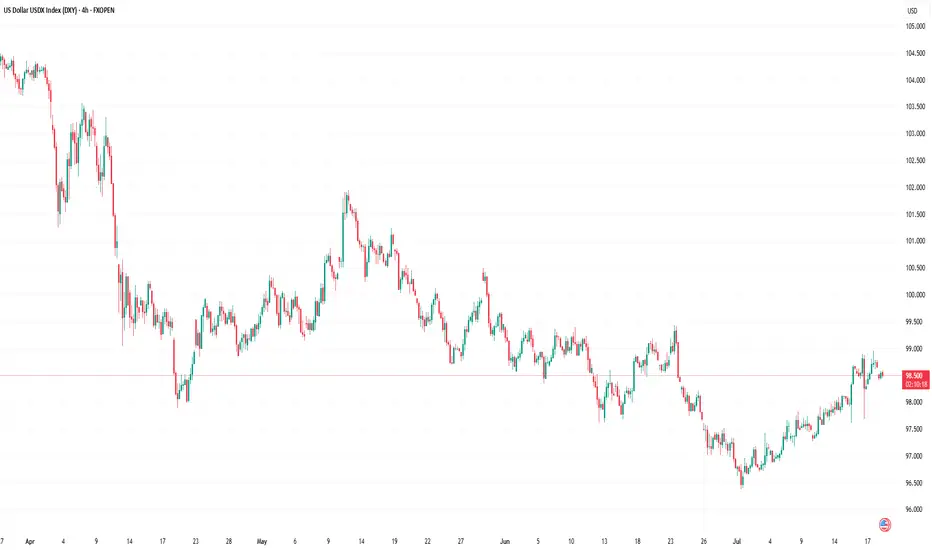
US Dollar Index (DXY) Chart AnalysisUS Dollar Index (DXY) Chart Analysis
The addition of the US Dollar Index (DXY) to FXOpen’s suite of instruments offers traders potential opportunities. This financial instrument:
→ serves as a measure of the overall strength of the US dollar;
→ is not tied to a single currency pair but reflects the value of the USD against a basket of six major global currencies, including the EUR, JPY, and GBP;
→ allows traders to capitalise on price fluctuations in the currency market;
→ is used in more advanced strategies for hedging risks in portfolios sensitive to sharp movements in the US dollar.
In today’s environment of heightened volatility, this instrument becomes particularly valuable. The active stance of US President Donald Trump — through the implementation of trade tariffs, sanctions, and unpredictable geopolitical rhetoric — gives traders even more reason to closely monitor the DXY chart.
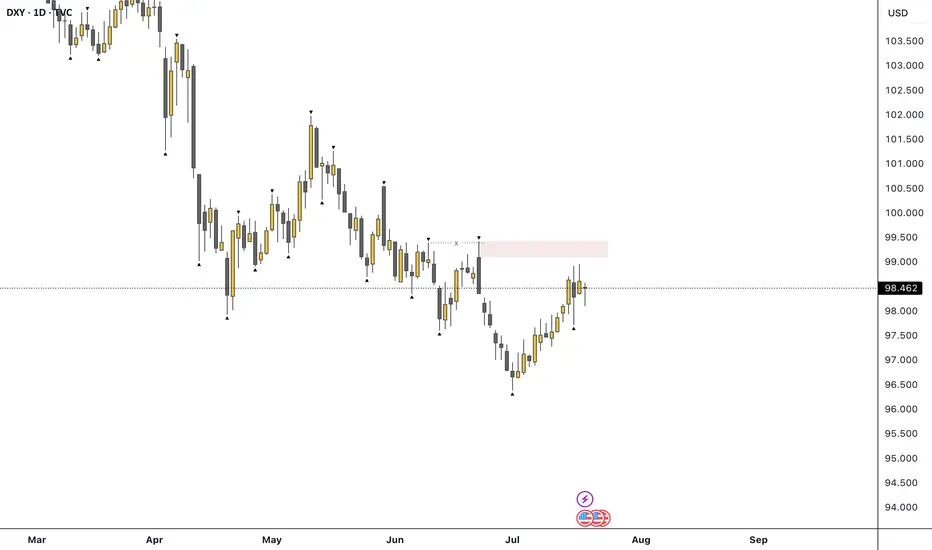
Technical Analysis of the DXY Chart
Moving averages show that the US Dollar Index displayed a predominantly bearish trend during the first half of 2025.
However, the picture shifted in July: the index began rising steadily (already up approximately +1.9% since the beginning of the month), highlighted by the blue ascending trend channel.
This suggests that the DXY may have found support following a prolonged decline, and a shift in market sentiment could be underway: after a bearish phase, a period of consolidation may follow. If this scenario plays out, we could see DXY oscillating between the 97.65 and 99.30 levels – both of which show signs of acting as support and resistance (as indicated by the arrows).
This article represents the opinion of the Companies operating under the FXOpen brand only. It is not to be construed as an offer, solicitation, or recommendation with respect to products and services provided by the Companies operating under the FXOpen brand, nor is it to be considered financial advice.
Has the DXY got you confused? Well, check out this analysis.Welcome back, traders, it’s Skeptic from Skeptic Lab! 😎 , the DXY has entered a corrective phase over the past weeks. In this analysis, I’ve broken down the technicals and chart with a skeptical eye, outlined long and short triggers on the 4h timeframe , and tried to give you a solid multi-timeframe view of the setup. At the end, I’ve shared a key educational tip that can seriously boost your win rate and R/R , so make sure you check out the full analysis.
💬If you’ve got a specific symbol in mind for analysis, drop it in the comments. Have a profitable Friday, fam <3

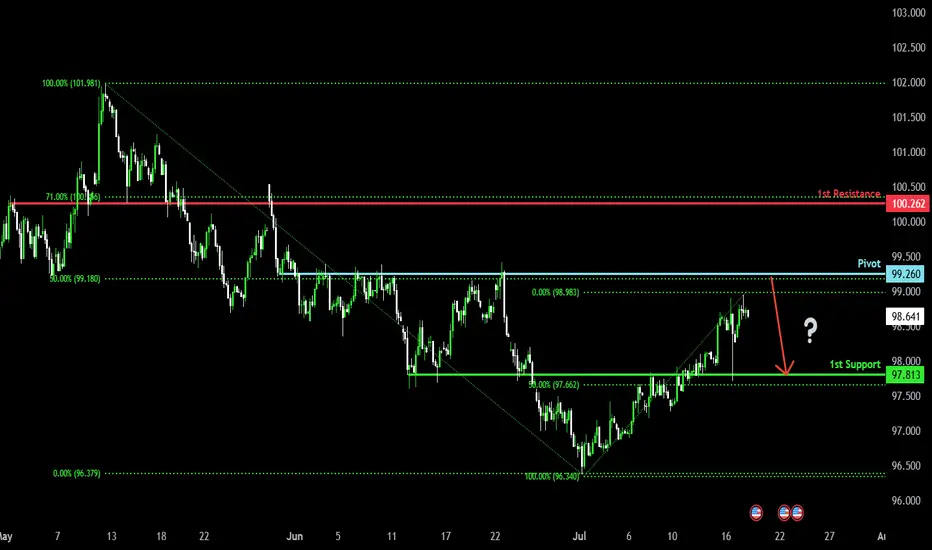
Bearish reversal?US Dollar Index (DXY) is rising towards the pivot and could reverse to the 1st support which acts as an overlap support.
Pivot: 99.26
1st Support: 97.81
1st Resistance: 100.26
Risk Warning:
Trading Forex and CFDs carries a high level of risk to your capital and you should only trade with money you can afford to lose. Trading Forex and CFDs may not be suitable for all investors, so please ensure that you fully understand the risks involved and seek independent advice if necessary.
Disclaimer:
The above opinions given constitute general market commentary, and do not constitute the opinion or advice of IC Markets or any form of personal or investment advice.
Any opinions, news, research, analyses, prices, other information, or links to third-party sites contained on this website are provided on an "as-is" basis, are intended only to be informative, is not an advice nor a recommendation, nor research, or a record of our trading prices, or an offer of, or solicitation for a transaction in any financial instrument and thus should not be treated as such. The information provided does not involve any specific investment objectives, financial situation and needs of any specific person who may receive it. Please be aware, that past performance is not a reliable indicator of future performance and/or results. Past Performance or Forward-looking scenarios based upon the reasonable beliefs of the third-party provider are not a guarantee of future performance. Actual results may differ materially from those anticipated in forward-looking or past performance statements. IC Markets makes no representation or warranty and assumes no liability as to the accuracy or completeness of the information provided, nor any loss arising from any investment based on a recommendation, forecast or any information supplied by any third-party.
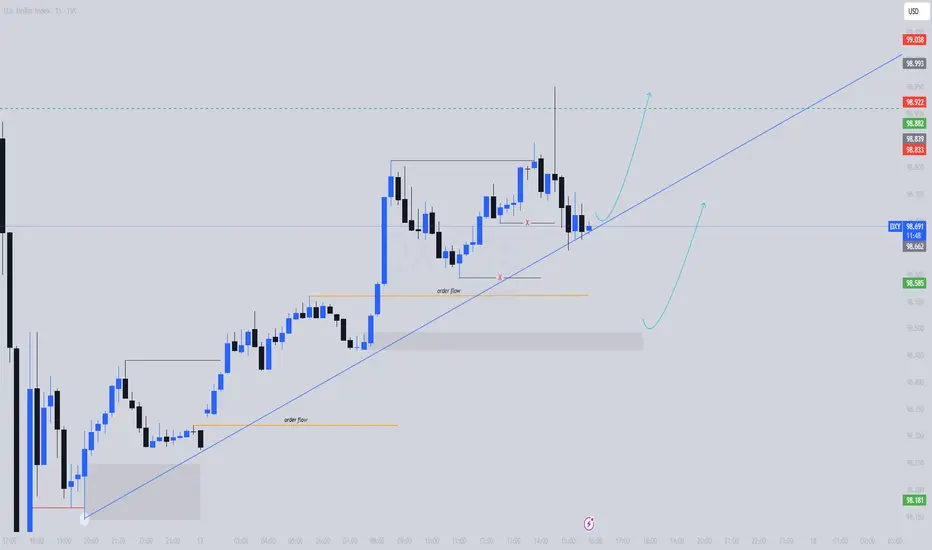
DXY Trade Bias | Bullish Continuation Structure🔍 Chart Breakdown:
Trendline support respected
Order flow blocks (OBs) unbroken — confirming demand
Minor liquidity grabs without breaking bullish structure
Double mitigation of intraday OB, implying potential bullish continuation
DXY Short Very Soon going to $96 or lowerCorruption has broken out all over America. Nothing good can come of this.
Wait for a solid Red weekly bar on DXY and short until 96 or lower.
- Earthquakes
- Wildfires over 600
- Floods
- Riots
- Epstein Files
- Housing (Only for the rich)
- Rental Increases
- Home Insurance Price increases
- Fraud for the Elite (Multiple Coins Created with withdrawals outside of US involving other Presidents)
- Crypto Investigations on Politicians
- Children Migrants being deported (Age 6 with Cancer)
TVC:DXY
FX_IDC:CADUSD
ECONOMICS:USTR
FRED:TREASURY

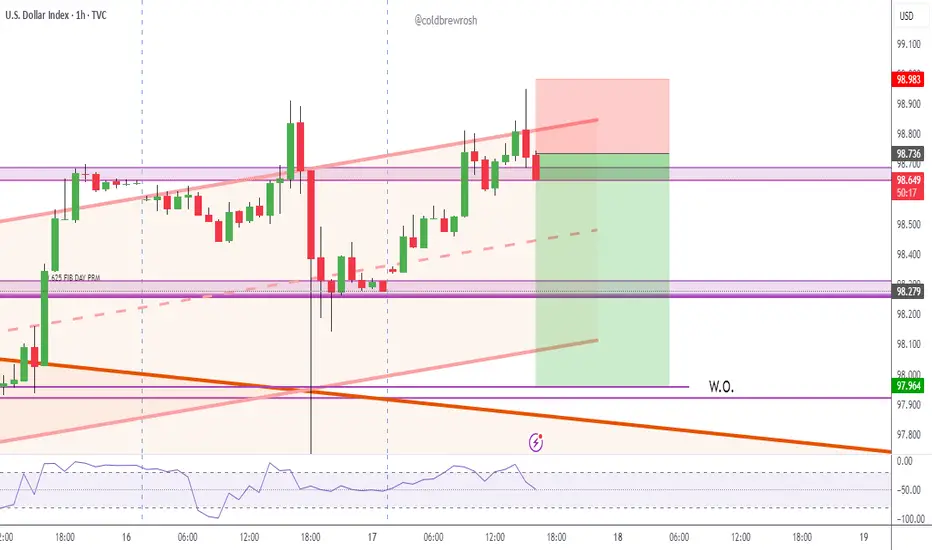
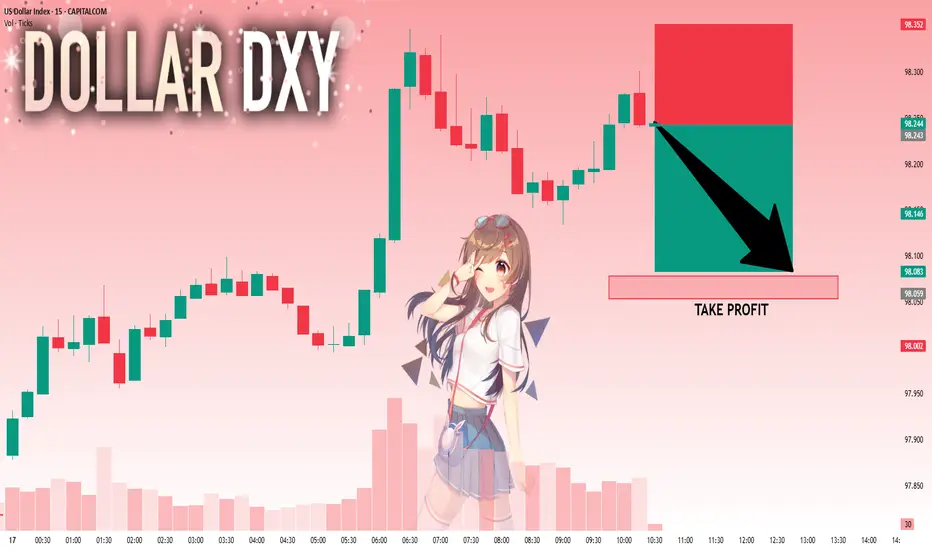
DXY: Next Move Is Down! Short!
My dear friends,
Today we will analyse DXY together☺️
The price is near a wide key level
and the pair is approaching a significant decision level of 98.243 Therefore, a strong bearish reaction here could determine the next move down.We will watch for a confirmation candle, and then target the next key level of 98.078..Recommend Stop-loss is beyond the current level.
❤️Sending you lots of Love and Hugs❤️
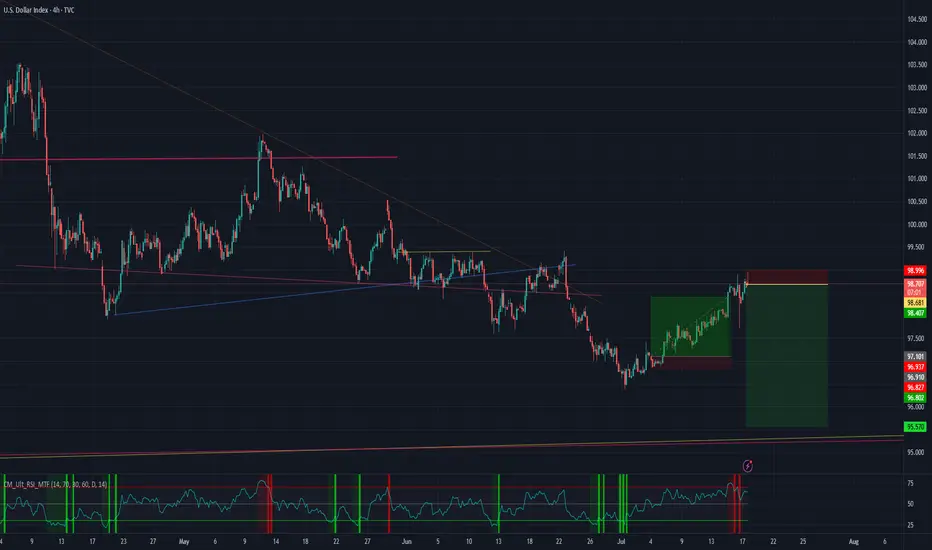
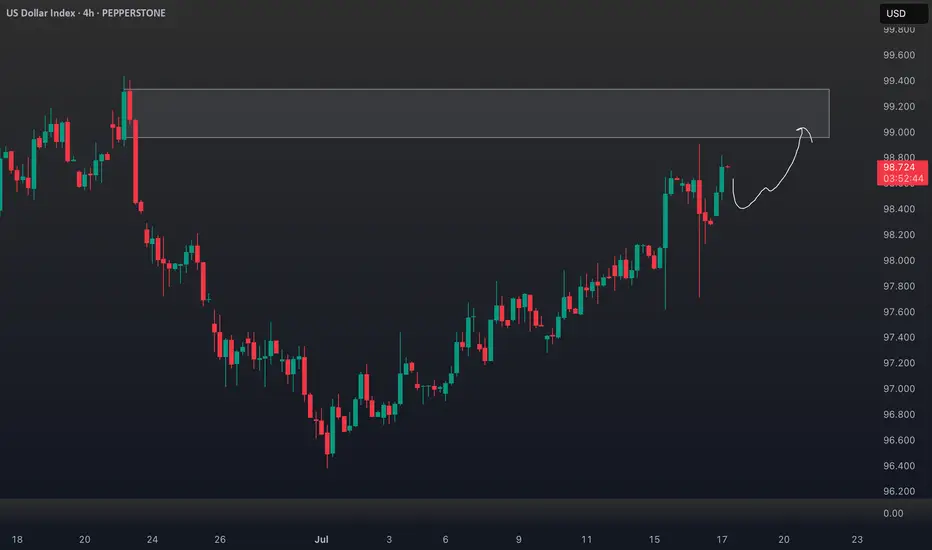
DXY Outlook: Bullish Move Fueled by Fundamentals & GeopoliticsTechnical Analysis (4H Chart & Broader Context) 📈🕓
The DXY 4H chart shows a clear bullish trend 🚀, with higher highs and higher lows since early July. DXY has caught a strong bid, breaking above short-term resistance near 98.40 and now eyeing the previous swing high 🎯. This matches the consensus among analysts: DXY remains in a bullish structure, with momentum supported by both technicals and macro factors.
Key resistance: Next upside target is the previous high (around 99.60 on the chart), with further resistance at the psychological 100 level 🏁.
Support: Immediate support at 98.20, then 97.60 🛡️.
Momentum: Strong bullish candles and no major bearish reversal signals on the 4H. Some analysts note positioning is stretched, so a short-term pullback or consolidation is possible before more upside (IG).
Fundamental Analysis 💹🌍
Why is DXY rallying?
Fed Policy & US Data: The US economy is resilient 💪, with robust services data, strong retail sales, and a recent uptick in core inflation. The Fed is less dovish, with markets now expecting a slower pace of rate cuts 🏦.
Interest Rate Differentials: The US keeps a yield advantage as the Fed is less aggressive in cutting rates compared to the ECB and BoJ, especially with Europe and Japan facing weaker growth and possible further easing 🌐.
Geopolitical Factors: Ongoing trade tensions (Trump’s tariff threats) and global uncertainty (including Middle East risks) are driving safe-haven flows into the dollar 🛡️🌏. DXY typically strengthens during periods of geopolitical stress.
Positioning: CFTC data shows USD long positioning at multi-month highs, which could mean the market is crowded and vulnerable to short-term corrections ⚠️ (IG).
Trade Idea (Bullish Bias, Targeting Previous High) 💡💵
Setup:
Bias: Bullish, in line with the prevailing trend and macro backdrop 🟢.
Entry: Consider buying on a minor pullback to the 98.20–98.40 support zone, or on a confirmed breakout above the recent high 🛒.
Target: Previous swing high near 99.60, with a stretch target at 100.00 🎯.
Stop: Below 97.60 (recent swing low/support) ⛔.
Risk Factors:
Overbought positioning could trigger a short-term pullback ⚠️.
Any dovish surprise from the Fed or rapid de-escalation in global tensions could cap further gains 🕊️.
In summary: The DXY’s bullish trend is underpinned by resilient US data, a hawkish Fed, and global risk aversion. Your bullish bias is well-supported, with the previous high as a logical target. Watch for short-term pullbacks, but the broader trend remains up unless key support is lost. 🚦
EURUSD heading for a bearish dropThere is a valid supply zone having a financial move that broke structure. looking properly at the left hand side of the supply zone there is no structural liquidity, so the supply zone is expected to fail before the sells, or create some form of liquidity around the supply zone.
Kindly follow Structure, POI, liquidity and can scale down to m5 for sniper entry and apply proper risk management.

DXYNet USD longs increased = Bullish sentiment
Speculators adding longs / commercials reducing shorts
Price broke previous weekly high = BOS
✅ Holding weekly demand zone
Note: COT is supportive — align with technicals
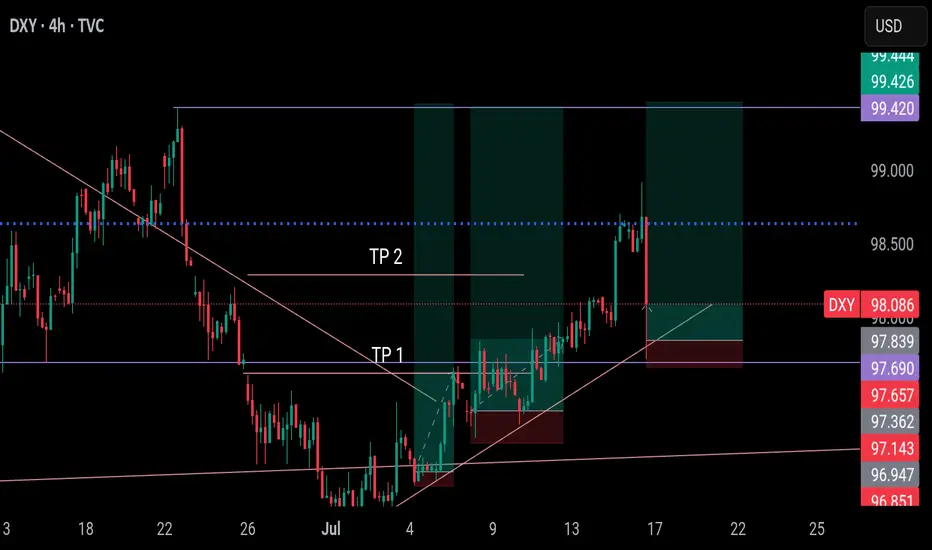
Sometimes, it can be this easy. DXY BULLISH continuationAs I'm trying to give reason, the market is running away.
I've guided you from the low till now, stop doubting my analysis please.
This is a discount price, DXY is still bullish till 99.42. Dont be caught on the sideline. EURUSD and other pairs are bearish. Trade accordingly
Follow me as my trades are market orders, so you will see them on time and enter the trade on time
Enjoy