Eurobonds: Europe Seizes on Trump’s Fiscal MisstepBy Ion Jauregui – Analyst at ActivTrades
The tax bill proposal put forward by the Trump administration — known as the “Big Beautiful Bill” — includes a controversial clause, number 899, which threatens to tax dividends and coupons from U.S. assets received by foreign investors from countries deemed “hostile” or “discriminatory” toward the United States. While designed as a geopolitical pressure tool, this measure could ultimately undermine the U.S. market itself and present a historic window of opportunity for Europe.
For years, Brussels has aimed to boost the appeal of its markets against U.S. dominance. Regulatory measures like MiFID II, the push for strategic autonomy, and the introduction of common debt instruments such as Eurobonds have steadily gained ground. Now, with the prospect of a direct penalty on foreign investment in the U.S., European assets — offering favorable real yields and a strengthening currency — are emerging as a solid alternative.
The European Central Bank has already warned that this is “a window not to be missed.” Christine Lagarde has hinted that the euro could strengthen to the point of becoming a global reserve currency, particularly if new joint debt issuances are used to fund defense spending. Amid growing geopolitical tensions and declining confidence in “American exceptionalism,” the debate over mutualizing European debt is returning with renewed momentum.
Clause 899 effectively acts as a self-imposed competitive disadvantage for the U.S. In a globalized market, such a tax reduces the real returns of American assets and redirects capital flows elsewhere. If Europe accelerates Eurobond issuance and reinforces its fiscal framework, it could turn this American fiscal crisis into an unprecedented geopolitical opportunity.
Building a Eurobond Market
Since the landmark Next Generation EU plan in 2020, the European Union has made steady progress toward creating a joint debt market. By 2025, over €450 billion in debt has been issued, with new rounds under discussion to fund defense, security, and the green transition. This has helped develop a more complete yield curve, improved market liquidity, and strengthened the euro’s role as a reserve currency.
Relative Yields and Monetary Context
Although European bonds offer lower yields than their U.S. counterparts (e.g., the 10-year German Bund yields around 2.5% versus 4.3% for the U.S. Treasury), the ECB’s monetary tightening cycle has moderated. Inflation in the eurozone has fallen below 3%, and interest rates are beginning to decline. This supports the appreciation of long-term European bonds in anticipation of future rate cuts. Additionally, the risk premiums for countries like Italy and Spain have narrowed, reinforcing confidence in European fiscal cohesion.
Rising Foreign Demand
Foreign holdings of U.S. debt have fallen — from 50% in 2014 to about one-third in 2024 — while European debt is gaining traction. According to ECB and BIS data, every €100 billion in foreign purchases reduces yields by roughly 20 basis points, suggesting that continued demand could exert downward pressure on yields in the medium term.
Strong Euro and Yield Curve Management
With the euro on the rise — projected to reach 1.19 USD by 2028 — euro-denominated assets are becoming more attractive to global investors. Moreover, the ECB retains the ability to intervene in secondary markets, preventing excessive yield curve distortions and maintaining financial stability.
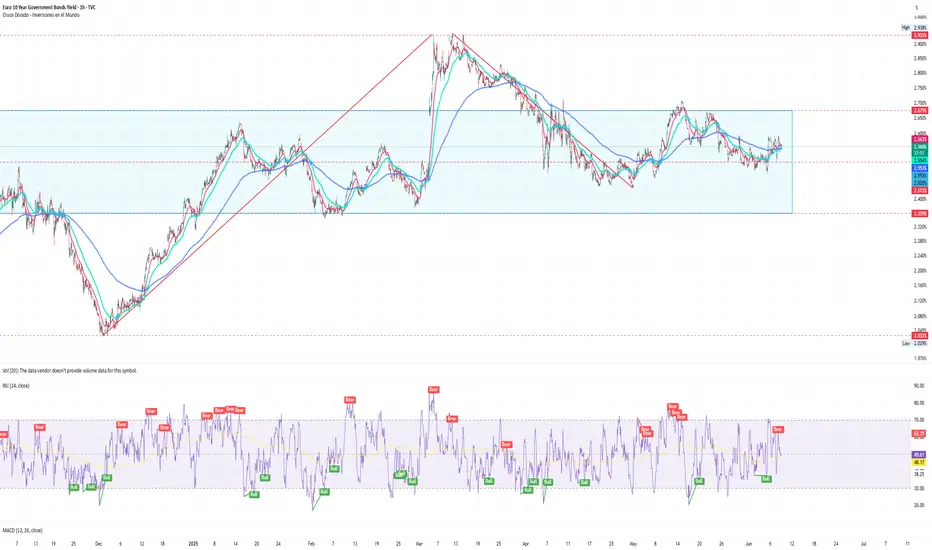
10-Year Eurobond Technical Analysis
Between the final quarter of 2024 and March 2025, 10-year Eurobonds staged a steady recovery before stabilizing in a consolidation range between 2.359% and 2.675%, with a current average of 2.512%. The bond’s technical structure signals a bullish trend, supported by a positive moving average crossover, which could push yields toward the upper end of the range.
The RSI currently stands at a neutral level of 52.38, indicating room for further upward movement without entering overbought territory. Additionally, the 2.568% level has proven to be a dynamic support, having rebounded multiple times, reinforcing its significance as a launchpad for further yield increases.
Conclusion
European bonds are experiencing a structural opportunity driven by U.S. fiscal missteps, growing fiscal integration within the eurozone, and a declining interest rate environment. If Europe continues to push joint bond issuances to fund strategic initiatives such as defense, energy transition, and digitalization, Eurobonds could solidify their status as a viable and competitive alternative to U.S. Treasuries.
*******************************************************************************************
The information provided does not constitute investment research. The material has not been prepared in accordance with the legal requirements designed to promote the independence of investment research and such should be considered a marketing communication.
All information has been prepared by ActivTrades ("AT"). The information does not contain a record of AT's prices, or an offer of or solicitation for a transaction in any financial instrument. No representation or warranty is given as to the accuracy or completeness of this information.
Any material provided does not have regard to the specific investment objective and financial situation of any person who may receive it. Past performance is not reliable indicator of future performance. AT provides an execution-only service. Consequently, any person acting on the information provided does so at their own risk.
EU10Y trade ideas
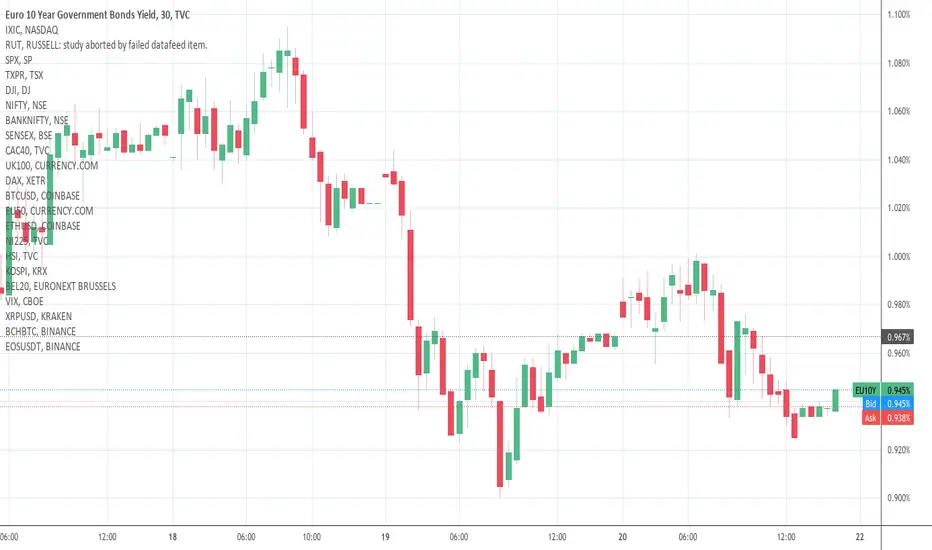
Market Update: EU 10-Year Yield Under Pressure The 10-year yield has faced mounting pressure over the past month, and we’re now approaching critical support levels—notably, 2.00/2.01, the recent low.
🔍 Key Insights:
• The RSI has dipped to 16, suggesting that this zone may hold on the initial test.
• However, the broader pattern since 2023 is starting to resemble a potential topping formation.
⚠️ What to Watch For:
A weekly close below 2.00 could expose the market to significant downside risks:
➡️ Targets include:
• The 2024 low at 1.89
• The December 2022 low at 1.75
• Longer-term potential to slide toward the 200-week moving average, currently around 1.46
As the bond market approaches these pivotal levels, it’s critical for investors to stay vigilant and prepared for potential shifts in the macro landscape.
Disclaimer:
The information posted on Trading View is for informative purposes and is not intended to constitute advice in any form, including but not limited to investment, accounting, tax, legal or regulatory advice. The information therefore has no regard to the specific investment objectives, financial situation or particular needs of any specific recipient. Opinions expressed are our current opinions as of the date appearing on Trading View only. All illustrations, forecasts or hypothetical data are for illustrative purposes only. The Society of Technical Analysts Ltd does not make representation that the information provided is appropriate for use in all jurisdictions or by all Investors or other potential Investors. Parties are therefore responsible for compliance with applicable local laws and regulations. The Society of Technical Analysts will not be held liable for any loss or damage resulting directly or indirectly from the use of any information on this site.

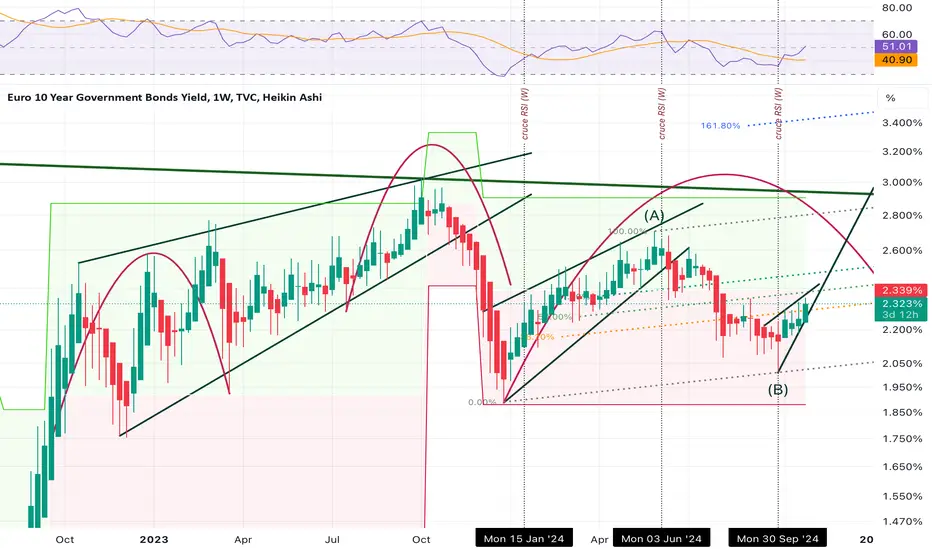
German 10 year bund (yield chart) giant HS patternGerman 10 year bund keeps scaling.
Price action is reflected on the charts. On the long term, seems like the german 10 year bund is building a huge Head and Shoulders pattern. That would be consistent with rates going down in the eurozone.
But… if the German bund should spike over 2.50%, that would probably mean that euro rate cuts will be on hold for longer than expected.
IMO, it’s all about geopolitics, as it’s also related to oil/natural gas supply from the east, commercial war with the USA, China and India, etc. all of them are inflationary and would also be pushing government spending to the upside on military and defense systems, detracting investment capacity from the private sectors…
All to be seen in coming weeks… any insights you would like to share about the topic, please let me know!
Attention is on the 200-day ma on the EU 10Y yield chartDisclaimer:
The information posted on Trading View is for informative purposes and is not intended to constitute advice in any form, including but not limited to investment, accounting, tax, legal or regulatory advice. The information therefore has no regard to the specific investment objectives, financial situation or particular needs of any specific recipient. Opinions expressed are our current opinions as of the date appearing on Trading View only. All illustrations, forecasts or hypothetical data are for illustrative purposes only. The Society of Technical Analysts Ltd does not make representation that the information provided is appropriate for use in all jurisdictions or by all Investors or other potential Investors. Parties are therefore responsible for compliance with applicable local laws and regulations. The Society of Technical Analysts will not be held liable for any loss or damage resulting directly or indirectly from the use of any information on this site.

EURO BONDS EXPLAINED:3 Reasons Why Euro Bonds Are UP trending!EURO BONDS EXPLAINED:3 Reasons Why Euro Bonds Are UP trending!
When you look at the chart of euro bonds, IN THIS FREE VIDEO REPORT,
you will see:
1-A Gap Above the 50-Day Moving Average
2- 2% yearly performance
3-50 Day Moving Average Above the 200 Day Moving Average
Trading for me is a struggle and am not good at keeping pace of the markets
this is why this video shows you the 3 Reasons to buy Euro bonds.
Remember am not good at trading so do your own research
don't just follow this strategy
At the end of the video you will see how I exit trades
to protect my greed of holding a position

Euro 10 Years Government Bonds EuropeSun Storm Investment Trading Desk & NexGen Wealth Management Service Present's: SSITD & NexGen Portfolio of the Week Series
Focus: Worldwide
By Sun Storm Investment Research & NexGen Wealth Management Service
A Profit & Solutions Strategy & Research
Trading | Investment | Stocks | ETF | Mutual Funds | Crypto | Bonds | Options | Dividend | Futures |
USA | Canada | UK | Germany | France | Italy | Rest of Europe | Mexico | India
Disclaimer: Sun Storm Investment and NexGen are not registered financial advisors, so please do your own research before trading & investing anything. This is information is for only research purposes not for actual trading & investing decision.
#debadipb #profitsolutions
The bearish argument for lower Bond markets continues ....Bund 10Y Yields are back above zero for the first time in a couple of years.
We have been viewing the bond markets as building major tops for quite some time and if we take a look at the EU 10Y yield rate, which has just breached zero, we can see that there is clear evidence that rates are now in a longer term up trend and have been for well over a year. Note that the definition of an up move is for higher reaction lows and higher reaction highs, and this has been the case since October 2020.
From both a fundamental and technical perspective the bearish argument for lower Bond markets continues to build momentum. With Oil hitting multi-year highs amid growing geopolitical tensions in the Middle East and ongoing supply tightness, we are looking for further upside pressure on the energy markets, coupled with an upside surprise for the German ZEW Economic sentiment index yesterday (it jumped to 51.7 in January) the bond markets are suffering.
In fact, technically, the EU 10Y yields have completed a base and now look ready to maintain the break above the 200-week ma at -0.18. They have been contained within a up channel extending back to 2020 and this comes in at approx. 0.07/0.08 and is likely to offer some decent resistance ahead of much tougher resistance at 0.28/0.30 (approximate lows that were seen throughout 2018). Longer term the market has completed a large base, which offers measurements much higher than this…
Disclaimer:
The information posted on Trading View is for informative purposes and is not intended to constitute advice in any form, including but not limited to investment, accounting, tax, legal or regulatory advice. The information therefore has no regard to the specific investment objectives, financial situation or particular needs of any specific recipient. Opinions expressed are our current opinions as of the date appearing on Trading View only. All illustrations, forecasts or hypothetical data are for illustrative purposes only. The Society of Technical Analysts Ltd does not make representation that the information provided is appropriate for use in all jurisdictions or by all Investors or other potential Investors. Parties are therefore responsible for compliance with applicable local laws and regulations. The Society of Technical Analysts will not be held liable for any loss or damage resulting directly or indirectly from the use of any information on this site.

bullish eu10years yieldIt is time for the next cycle in bonds to develop.
bond yield on bonds of the european union is likely to go up again according to this cycle.
bond yield goes up means, bond prices are going down, which means bonds are being sold as demand on bonds lowers again, while demand on stocks rises.
what does that mean for forex ?
this means a rising EUR!
