Daily Market Update for 1/27Trend lines drawn from the 10/30 bottom (60d), 1/21 (5d) and today 1/26 (1d).
Ideas always welcome in the comments. Errors will be amended as comments on TradingView or and corrected inline in my blog.
I'm working to condense this daily update over the next few weeks. I need to reduce it for both brevity and preparation time.
-=x=-=x=-=x=-=x=-=x=-=x=-=x=-
Wednesday, January 27, 2021
Facts: -2.61%, Volume higher, Closing range: 22%, Body: 63%
Good: Not much, held support after closing last week's gap.
Bad: Gap down, long red body with late day selling
Highs/Lows: Lower high, lower low
Candle: Mostly body with visible upper and lower wick
Advance/Decline: 0.19, five declining stocks for each advancing stock
Indexes: SPX (-2.57%), DJI (-2.05%), RUT (-1.91%), VIX (61.64%)
Sectors: Real Estate (XLRE -1.28%), Energy (XLE -1.35%) were top. Communications (XLC -3.23%) was bottom.
Expectation: Lower
-=x=-=x=-=x=-=x=-=x=-=x=-=x=-
Market Overview
Today was a little more exciting then yesterday, but not in the way we wanted. The Nasdaq opened with a gap down, chopped back and forth and then sold off after the Fed announcements. The fed will keep current monetary policy and interest rates, but said there are still a lot of headwinds for the economy.
The Nasdaq closed with a -2.61% loss after testing the 21d EMA. Volume was over 60% higher than the previous day. The gap down at open along with the selling during the day resulted in a 19% closing range and a 63% red body. There were five declining stocks for every advancing stock
The S&P 500 (SPX), Dow Jones Industrial (DJI) and Russell 2000 (RUT) all closed with losses. The RUT had the smallest loss at -1.91%, but still a big pullback. The VIX gained 61.64% for the day and ended with a 100% closing range. It is at the highest point since the beginning of November.
All sectors lost for the day. Real Estate (XLRE -1.28%) and Energy (XLE -1.35%) were the smallest losses. Communications (XLC -3.23%) had the biggest loss. Energy was in positive territory at mid-day before the late afternoon sell-off.
-=x=-=x=-=x=-=x=-=x=-=x=-=x=-
Economic Indicators
The US Dollar (DXY) gained +0.53% for the day. US 30y and 10y treasury bond yields declined for the day. US 2y treasury yields gained for the day. High Yields Corporate bond (HYG) prices declined.
Silver (SILVER) and Gold (GOLD) both declined for the day. Crude Oil (CRUDEOIL1!) gained as inventory data showed a better outlook on demand than the previous week. Timber (WOOD) declined -3.59% for the day. Copper (COPPER1!) and Aluminum (ALI1!) both declined.
-=x=-=x=-=x=-=x=-=x=-=x=-=x=-
Investor Sentiment
The put/call ratio rose for the day, but remained at a low level of 0.588. The put/call ratio (PCCE) is a contrarian indicator that shows overly bullish or overly bearish investor behavior. The 0.7 level is considered normal. As it approaches 0.60 (overly bullish) and below, watch for a possible pullback in the market.
-=x=-=x=-=x=-=x=-=x=-=x=-=x=-
Market Leaders
Three of the four largest mega-caps all declined for the day. Alphabet (GOOGL) had the biggest loss at -4.67%. Apple (AAPL) had the smallest loss at -0.77%, but declined another -3.23% after hours despite beating earnings and revenue expectations. Amazon (AMZN) lost -2.81%. Microsoft (MSFT) closed the session with a +0.25% advance, but at one point was up +3.5% after pleasing investors with yesterday's earnings release.
Microsoft was the only mega-cap with a gain. Netflix lost nearly all of its post-earnings gap with a -6.88% loss today.
A few growth stocks still did OK today. Palantir (PLTR) ended the day with a +10.26% gain, although was much higher mid-day. Beyond Meat (BYND) added to yesterday's big gains with a +2.81% gain.
Tesla (TSLA) is down -5% in post-market trading after missing earnings expectations. Facebook (FB) is down -2.07% after hours, despite beating earnings and revenue expectations.
-=x=-=x=-=x=-=x=-=x=-=x=-=x=-
Looking ahead
Tomorrow's economic news will include Q4 GDP data and Initial Jobless claims before market open.
After the market opens, New Home Sales data for December will be released.
Earnings tomorrow will include Mastercard (MA) before market open and Visa (V) after market close. Comcast (CMCSA) and McDonalds (MCD) will also announce earnings before market open. Atlassian (TEAM) will release earnings after market close. Several airlines including Southwest (LUV), American Airlines (AAL) and JetBlue (JBLU) will also release earnings tomorrow.
-=x=-=x=-=x=-=x=-=x=-=x=-=x=-
Trends, Support and Resistance
The index moved back below the long-term trend line from the 10/30 bottom. Returning to that line would be a +2.36% gain. The five-day trend line is under that point with a +1.74%.
Continuing the one-day trend points to a -1.22% loss. That would be below the 21d EMA which provided support today.
In addition to the 21d EMA, the previous two week's highs around 13,200 acted as support after the index closed last week's gap up. Beyond that, 13,000 support seemed to hold up well. The index also held the 12,550 area recently. If it passes that area, the next support area is 12,250.
-=x=-=x=-=x=-=x=-=x=-=x=-=x=-
Wrap-up
It was a distribution day for the major indexes today. Certainly a character change in the market. The gap up from last Wednesday's open was filled and the index seemed to pause at that point. As a defense to the selling, there was some purchasing of bonds but not a huge amount. The more alarming signal is the negative after hours reactions to fairly positive earnings reports from Apple and Facebook.
Some extra caution is required heading into tomorrow's session. The market can choose which direction it wants to go, and that could be a reversal off the 21d EMA for gains tomorrow. Or it could be further downside.
Take a look at your portfolio and have a plan based on your trading style and risk comfort level.
Stay healthy and take care!
IXIC trade ideas

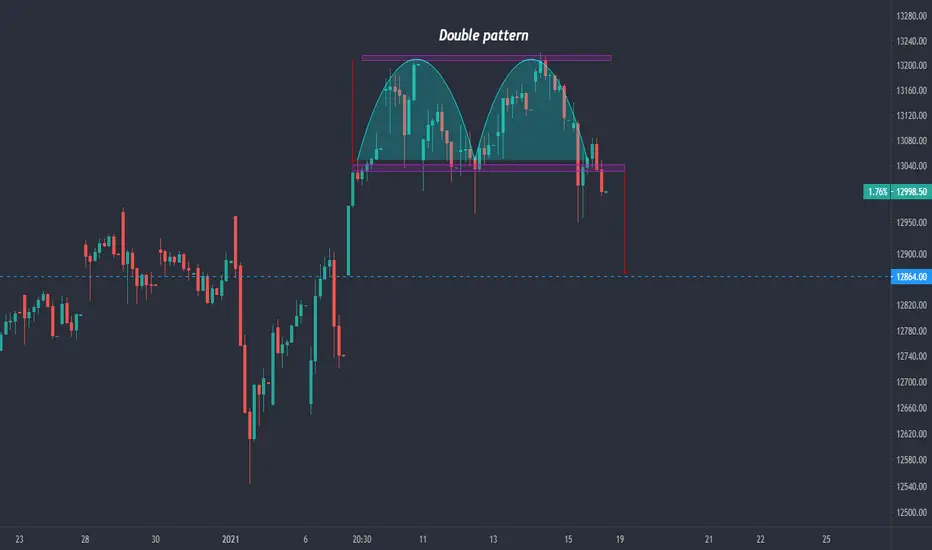
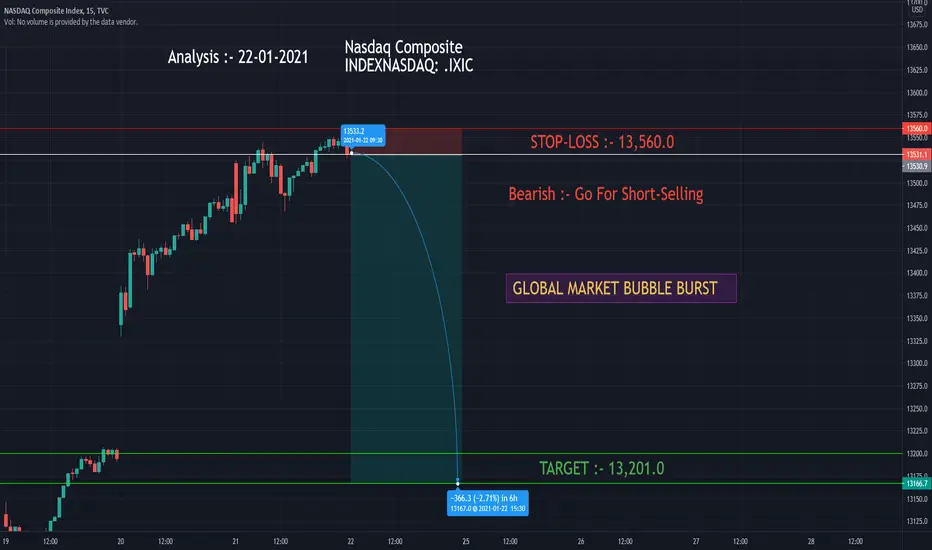
What goes up must come down...Things that rise also fall. NASDAQ \ IXIC will eventually return to lower prices due to take profits. First target 12100$
This is what I think about IXIC not an advice
Daily Market Update for 1/26Trend lines drawn from the 10/30 bottom (59d), 1/20 (5d) and today 1/26 (1d).
Ideas always welcome in the comments. Errors will be amended as comments on TradingView or and corrected inline in my blog.
I'm working to condense this daily update over the next few weeks. I need to reduce it for both brevity and preparation time.
-=x=-=x=-=x=-=x=-=x=-=x=-=x=-
Tuesday, January 26, 2021
Facts: -0.07%, Volume lower, Closing range: 23%, Body: 56%
Good: Low is well-above last week's highs
Bad: Thich red body relative to rest of candle, closing range
Highs/Lows: Lower high, higher low
Candle: Mostly body with tiny upper and lower wicks, insider day
Advance/Decline: 0.59, more declining stocks than advancing stocks
Indexes: SPX (-0.15%), DJI (-0.07%), RUT (-0.62%), VIX (-0.73%)
Sectors: Communications (XLC +1.36%) and Real Estate (XLRE +1.02%) were top. Materials (XLB -1.38%) and Energy (XLE -2.14%) were bottom.
Expectation: Sideways or Lower
-=x=-=x=-=x=-=x=-=x=-=x=-=x=-
Market Overview
Although some wild happenings continue to occur in the market, the Nasdaq composite index had a rather boring day. And that can be a good thing. Yesterday's big dip and recovery followed a week of huge growth. So a day of mostly sideways action, which held lows well above last week's highs, can be very constructive for the index.
The Nasdaq ended with a -0.07% on lower volume. The closing range of 23% and 56% red body sounds bad, but is within a candle that is only 0.73% from top to bottom. Compare that to the previous days candle that had a 2.70% trading range. There were more declining stocks than advancing stocks.
The S&P 500 (SPX), Dow Jones Industrial (DJI) and Russell 2000 (RUT) all closed with losses. The RUT had the biggest loss at -0.62%. The S&P 500 set a new all-time high before pulling back a bit.
Communications (XLC +1.36%) and Real Estate (XLRE +1.02%) were at the top of the sector list. Consumer Staples (XLP +0.90%) and Technology (XLK +0.07%) were the only other sectors to end the day with gains. Materials (XLB -1.38%) and Energy (XLE -2.14%) were bottom. Energy was up 1.48% at open but quickly sold off to end the day in last place.
-=x=-=x=-=x=-=x=-=x=-=x=-=x=-
Economic Indicators
The US Dollar (DXY) declined -0.24% for the day. US 30y treasury bond yields were flat while 10y yields rose slightly. 2y yields dropped as investors purchased the bonds.
High Yields Corporate bond (HYG) prices declined.
Silver (SILVER) advanced while Gold (GOLD) declined for the day. Crude Oil (CRUDEOIL1!) remained flat. Timber (WOOD) advanced for the day. Copper (COPPER1!) remained flat while Aluminum (ALI1!) advanced.
-=x=-=x=-=x=-=x=-=x=-=x=-=x=-
Investor Sentiment
The put/call ratio dropped slightly to 0.524. The put/call ratio (PCCE) is a contrarian indicator that shows overly bullish or overly bearish investor behavior. The 0.7 level is considered normal. As it approaches 0.60 (overly bullish) and below, watch for a possible pullback in the market.
-=x=-=x=-=x=-=x=-=x=-=x=-=x=-
Market Leaders
All four of the largest mega-caps ended the day with gains. Microsoft (MSFT) had the biggest gain of +1.22% and continued to advance after hours with a beat on earnings and revenue expectations. Amazon (AMZN) and Alphabet (GOOGL) had gains of +0.98% and +0.72% respectively. Apple (AAPL) had the smallest gain of the four.
Johnson & Johnson (JNJ) led the mega-caps with a 2.71% gain after releasing pre-market earnings that beat expectations and gave positive guidance. Comcast (CMCSA) and AT&T (T) also had gains exceeding 2%, helping Communications to lead the sector list.
Growth stocks had a mixed day. One of the big winners was Beyond Meat (BYND) which followed yesterday's 13% gain with a 17.7% gain today. The stock soared 40% after Beyond Meat revealed a partnership with Pepsi to make products from plant-based proteins.
GameStop (GME) continued to…. nah, let's move on.
-=x=-=x=-=x=-=x=-=x=-=x=-=x=-
Looking ahead
Core Durable Goods Orders data will be released before market open. Crude Oil Inventories will be released after market open. Today's API Weekly Crude number was lower than expected, a good sign for crude prices.
The big economic news tomorrow will be from the meeting of the Federal Open Market Committee. Out of the meeting, we will hear about changes in outlook on the economy and whether the Fed plans any changes to interest rates or monetary policy.
Tomorrow will be another big day for earnings releases. Apple (AAPL), Tesla (TSLA) and Facebook (FB) will all report earnings after market close. There are numerous other reports before and after the market, so be sure to check your portfolio for any companies that announce earnings tomorrow.
-=x=-=x=-=x=-=x=-=x=-=x=-=x=-
Trends, Support and Resistance
The five-day trend line points to a +0.68% gain. The one-day trend line points to another sideways day, slightly to the positive.
The long trend line from the 10/30 bottom points to a -0.55% loss.
If there is a further downside move, its notable that the index held support today above last week's highs. The low was 13,567.14, and would hopefully continue to hold support above that area.
The 21d EMA is at 13,146.21 which could offer an area of support at 3.44% below today's close. 13,000 support seems to be holding up well. The index also held the 12,550 area recently. If it passes that area, the next support area is 12,250.
-=x=-=x=-=x=-=x=-=x=-=x=-=x=-
Wrap-up
The indexes are doing what would be expected after last week's gains and Monday's big swings. Pausing for a day or two and allowing enthusiasm to cool off a bit will be good for the market. However, wild moves of stocks being manipulated by large groups of retail traders continues underneath the surface.
Nothing is fundamentally broken, but continue to be cautious as always.
Stay healthy and take care!

NASDAQ / DAX Ratio (Channel - Cycle)
Nasdaq Composite / DAX (German Stock Index).
The ratio has reached the 20 Year Cyclical Channel upper limit. Against the odds, Decision time Next.


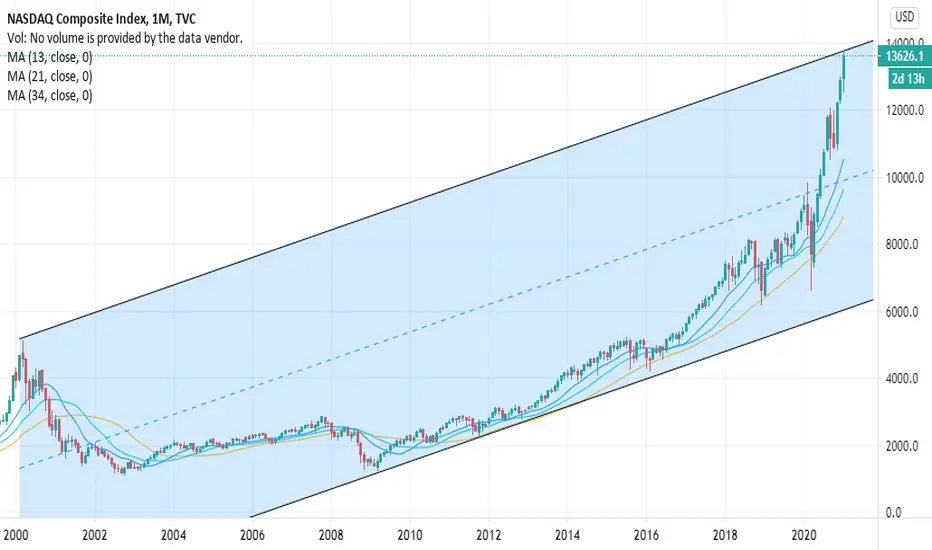
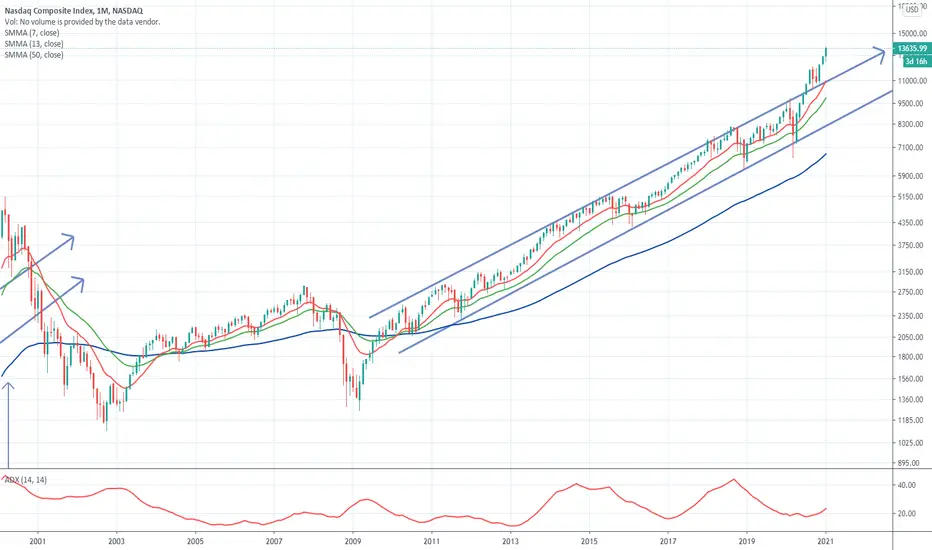
Target Nasdaq 25,000 for market topThere is a discussion that the market might be heading for a top. I have reviewed the monthly chart going back 20 years to the great big bull of the 90s, the index at the time was consistently uptrending with the the price being 80% above the 50Month MA. The market traded in a channel for years and once it broke above that channel, which became support in 1999 and in the following year topped when the price hit 210% above of the 50Month MA (5132 high vs 1645 50month MA).
If history repeats itself (at the time of writing this note in January 2021) at the moment the 50 month SMA is around 6812 whilst the index however around 13,635. That means that even though the index price is trading outside of the normal channel band since July of last year, it is now possible that it will go forward to do a climax top sometime around summer target being September of this year. At the moment the index is trading at double (100%) above the 50 Month MA. However in order to become extremely overbought, it needs to continue to grind higher and consolidate sideways as it has been doing.
What are the parallels of 1999.
1) In 1999 there were IPOs today there are SPACs.
2) In 1999 there was AOL today there is TSLA.
3) Top stocks were splitting and raising money with secondaries just like they do nowadays.
4) In 1999 was the era of the Internet / communications, today we have EVs and now moving to EV infrastructure and Space exploration.
5) Everyone wanted a piece of the market, Joe Public started becoming a "professional" trader and making more money than his normal income.
6) Everyone was rushing for the next big stock to buy, everyone was pumping, swings were very wild and the nasdaq was not trading in sync with the normal s&p index.
All of the above and more factors convince me that history is repeating itself and that we are in for a great year. I am expecting that the 50Month MA to move up another 25% in the next few months to around 8500 and the index could peak at 250%-300% of the 50 month MA which would equate to a price of 21,300 - 25,500. Calling the Nasdaq top at 25,000 looks extremely optimistic, but at the same time frame in 1999 the market kept moving up by 80% to reach the market top. Based on today's price a move of 80% up also gives a price of 24,500 so this call although absurb is quite feasible.
I am long the stocks and plan to remain long and buy stocks until the Nasdaq hits 20,000 from which then the market will become extremely volatile and will start unwinding positions and take a break.
Good luck to everyone, do your own DD.
How I Create Chart Art for my TradingView IdeasI've gotten a lot of questions on some of my trading view ideas on how do I paste images on the chart. And others compliment me on my artistic skill. The secret is that I don't paste images on the chart, but I'm also hardly an artist. I do like to take some time to create the art because it helps me tell the story of the company that I'm presenting in the idea.
Here's a video that shows how I create chart art. Happy to share my secrets with the TradingView community.

Daily Market Update for 1/25Trend lines drawn from the 10/30 bottom (58d), 1/19 (5d) and today 1/25 (1d).
Ideas always welcome in the comments. Errors will be amended as comments on TradingView or and corrected inline in my blog.
I'm working to condense this daily update over the next few weeks. I need to reduce it for both brevity and preparation time.
-=x=-=x=-=x=-=x=-=x=-=x=-=x=-
Monday, January 25, 2021
Facts: +0.69%, Volume higher, Closing range: 74%, Body: 13%
Good: Stayed above the gap from last Wed, bulls fought back in afternoon
Bad: Long sudden trip to the days low, volume heavy on the way down
Highs/Lows: Higher high, lower low
Candle: Similar to bearish doji star, but body a little thick
Advance/Decline: 0.91, more declining than advancing stocks
Indexes: SPX (+0.36%), DJI (-0.12%), RUT (-0.25%), VIX (+5.84%)
Sectors: Utilities (XLU +2.01%) and Consumer Staples (XLP +1.00%) were top. Finance (XLF -0.73%) and Energy (XLE -1.02%) were bottom.
Expectation: Sideways or Lower
-=x=-=x=-=x=-=x=-=x=-=x=-=x=-
Market Overview
There was expectation coming into the week that it would be choppy, but we didn't expect that chop to all happen within 30 minutes. But that's how it goes sometimes. Investors were already playing defense in the opening minutes of the day, despite the index setting a new all-time high. But the bulls caught the downward action mid-morning and brought the Nasdaq back to gains in the afternoon.
The Nasdaq closed with a +0.69% gain on higher volume. The closing range of 74% is typically good, but the 13% red body that is entirely above last week's bullish range is a possible reversal pattern. There were less advancing stocks than declining stocks as many stocks did not move back to positive territory after the morning sell-off.
The S&P 500 (SPX +0.36%), Dow Jones Industrial (DJI -0.12%) and Russell 2000 (RUT -0.25%) all have their own candle patterns to represent the day. Each has a long lower wick, but only the RUT set a new all-time high, creating a long upper wick. The Dow Jones Industrial average is in a third day of a downward move.
As investors came into the day defensive, Utilities (XLU +2.01%) and Real Estate (XLRE +0.90%) moved to the top of the sector list even before everything turned downward around 10:30. At the end of the day, Utilities and Consumer Staples (XLP +1.00%) were at the top, with Real Estate at the bottom. Finance (XLF -0.73%) and Energy (XLE -1.02%) were at the bottom.
-=x=-=x=-=x=-=x=-=x=-=x=-=x=-
Economic Indicators
The US Dollar (DXY) gained +0.12% for the day. US 30y, 20y and 2y treasury bond yields all dropped for the day. Those moves were also happening as the market opened, well before the 10:30a dip. Corporate Bonds (HYG) prices increased slightly for the day, but did dip while the equity markets dipped in the morning.
Silver (SILVER) and Gold (GOLD) declined for the day. Crude Oil (CRUDEOIL1!) futures advanced slightly. Timber (WOOD) declined for the day. Copper (COPPER1!) and Aluminum (ALI1!) both advanced.
-=x=-=x=-=x=-=x=-=x=-=x=-=x=-
Investor Sentiment
The put/call ratio rose slightly to 0.534. The put/call ratio (PCCE) is a contrarian indicator that shows overly bullish or overly bearish investor behavior. The 0.7 level is considered normal. As it approaches 0.60 (overly bullish) and below, watch for a possible pullback in the market.
-=x=-=x=-=x=-=x=-=x=-=x=-=x=-
Market Leaders
The big four mega-caps all ended the day with gains, although have the same long lower shadows as the index. Apple (AAPL) and Microsoft (MSFT) faired the best with a +2.77% and +1.58% gain, respectively. Amazon (AMZN) and Alphabet (GOOGL) both had gains less than 0.1%.
Tesla (TSLA) was the top mega-cap of the day with a +4.03% gain. Most mega-caps did ok. Intel (INTC) added to losses with a -2.15% decline. Paypal (PYPL), JPMorgan Chase (JPM) and Banc of America (BAC) led the Financial mega-cap losses with more than 1% declines.
Some mega-caps did very well despite the big swings of the day. Beyond Meat (BYND) has no lower wick and a very high closing range with a 12.81% gain. Moderna (MRNS) gained +12.20% after announcing their vaccines will work with new strains of the COVID virus. Palantir (PLTR) had a huge intraday swing but ended the day with a 11.20% gain.
GameStop (GME) continued the squeeze, or whatever we are calling it now. At one point it was up over 100%, but ended the day with an 18.12% gain. The stock has gained over 300% since the beginning of the year. Blackberry (BB) issued a public statement that there is no material difference in their business results that would drive a +28.42% gain in their stock price.
I believe eventually the stock manipulation, whether by a few individuals or a mass community of investors, will cause reaction from market makers, regulators, and lawmakers and have a negative impact on retail investors. It's something to keep monitoring.
-=x=-=x=-=x=-=x=-=x=-=x=-=x=-
Looking ahead
Consumer Confidence numbers for January will be released in the morning after market open. API Weekly Crude Oil Stock numbers, which negatively surprised investors last week, will be updated in the afternoon.
Tomorrow will kick-off the huge wave of earnings reports from big tech and other meg-caps. American Express (AXP) will announce earnings before market open. Consumer Staples company Johnson & Johnson (JNJ) and home builder DR Horton (DHI) will also announce before market open. Microsoft (MSFT), AMD (AMD), Texas Instruments (TXN) will kick-off big tech after hours. There are a bunch more I won't list here, but do check your portfolio and plan accordingly for this week's earnings releases.
-=x=-=x=-=x=-=x=-=x=-=x=-=x=-
Trends, Support and Resistance
The five-day trend line points to a +1.14%.
The one-day trend line and the long trend line from the 10/30 bottom points to a -1.05% loss.
If there is a further downside move, its notable that the index held support today above last Wednesday's gap up. The low was 13,329.77, and would hopefully continue to hold support above that gap. If the index would fill the gap, the other side is around 13,220. That's around a 3.0% decline.
The 21d EMA is at 13,099.32 which could offer an area of support at 3.9% below today's close. 13,000 support seems to be holding up well. The index also held the 12,550 area recently. If it passes that area, the next support area is 12,250.
-=x=-=x=-=x=-=x=-=x=-=x=-=x=-
Wrap-up
It was a crazy day for many investors. I've heard numerous stories of portfolio's starting the day with record gains, but those gains were wiped out in 20-30 minutes. Still, the indexes and many stocks recovered from the sudden sell-off and ended the day with gains. On the weekly chart, we have a higher high and lower low.
We can likely expect more choppiness this week as the indexes pause, move sideways or even pullback a bit and let moving averages catch up while heated gains cool off a bit.
Stay healthy and take care!

Market Week In Review - 1/19/2021 - 1/22/2021The Market Week in Review is my weekend homework where I look over what happened in the previous week and what might come in the next week. It helps me evaluate my observations, recognize new data points, and create a plan for possible scenarios in the future.
I do occasionally have some errors or typos and will correct them in my blog or in the comments on TradingView. I do not have an editor and do this in my free time.
If you find this helpful, please let me know in the comments. I am also more than happy to add new perspectives and data points if you have ideas.
The structure is the following:
A recap of the daily updates that I do here on TradingView.
The Meaning of Life, a view on the past week
What's coming in the next week
The Bullish View, The Bearish View
Key index levels to watch out for
Wrap-up
If you have been following my daily updates, you can skip down to the “The Meaning of Life”. If not, then this first part is a great play-by-play recap for the week. Click the original charts for more detail each day.
-=x=-=x=-=x=-=x=-=x=-=x=-=x=-
Tuesday, January 19, 2021
Facts: +1.53%, Volume lower, Closing range: 92%, Body: 50%
Good: Solid gains in afternoon after morning low, high closing range
Bad: Nothing
Highs/Lows: Higher high, higher low
Candle: Longer lower wick from morning dip, thick green body from afternoon
Advance/Decline: 2.04, two advancing stocks for every declining stock.
Indexes: SPX (+0.81%), DJI (+0.38%), RUT (+1.32%), VIX (-4.52%)
Sectors: Energy (XLE +2.01%), Communications (XLC +1.81%), and Technology (XLK +1.30%) were top. Real Estate (XLRE -0.66%), Consumer Staples (XLP -0.44%), Utilities (XLU -0.38%) were bottom.
Expectation: Higher
The market started the trading week on a note of optimism after a long weekend. The end of the last week was marked with defensive moves into lower risk sectors and safe haven assets. Today, the opposite moves were made to begin a week that brings a transition for the US, the inauguration of President Biden.
The Nasdaq closed with a +1.53% gain on lower volume. The closing range of 92% and a thick 50% green body are representative of the confident buying in the afternoon that produced the bullish session. The lows in the morning were just above Friday's open. After testing that low three times in the morning, the index finally turned to the upside for the rest of the session. There were two advancing stocks for every declining stock.
-=x=-=x=-=x=-=x=-=x=-=x=-=x=-
Wednesday, January 20, 2021
Facts: +1.97%, Volume higher, Closing range: 90%, Body: 73%
Good: Gains the whole day and closing near the top of the range
Bad: Gap up
Highs/Lows: Higher high, higher low
Candle: Mostly green body with a tiny lower wick and more visible upper wick from some selling at close
Advance/Decline: 1.29, more advancing stocks than declining stock.
Indexes: SPX (+1.39%), DJI (+0.83%), RUT (+0.44%), VIX (-7.14%)
Sectors: Communications (XLC +3.14%) and Real Estate (XLRE +2.08%) were top. Financials (XLF -0.42%) was the only losing sector.
Expectation: Sideways or Higher
If the equity market could talk, I think it would say Happy Inauguration Day. Investors breathed a sigh of relief that maybe some of the turmoil is behind us. That sentiment translated into a gap up at open with steady gains throughout the day.
The Nasdaq closed with a big +1.97% gain on higher volume. The candle has a closing ranging of 82%, but including the gap the actual closing range is even better at 90%. The 73% green body and tiny lower wick shows the nearly constant gains that happened throughout the trading session. There were more advancing stocks than declining stocks, but note that the breadth was not as wide as the previous day.
-=x=-=x=-=x=-=x=-=x=-=x=-=x=-
Thursday, January 21, 2021
Facts: +0.55%, Volume higher, Closing range: 72%, Body: 9%
Good: New all-time high, support at yesterday's close for higher low
Bad: Thin body, indecisive candle
Highs/Lows: Higher high, higher low
Candle: Thin green body with visible upper and lower wicks could be a spinning top
Advance/Decline: 0.79, more declining stocks than advancing stocks.
Indexes: SPX (+0.03%), DJI (-0.04%), RUT (-0.89%), VIX (-1.20%)
Sectors: Technology (XLK +1.29%), Consumer Discretionary (XLY +0.47%), and Communications (XLC +0.35%) were the only advancing sectors. Energy (XLE -3.38%) was the worst performing sector.
Expectation: Sideways
It was a choppy session with some indecision from open to close on which direction the indexes wanted to move. In the end, investors ignored bleak unemployment data and ended the day with gains, albeit very concentrated in specific sectors.
The Nasdaq ended with a +0.55% gain on higher volume. However the 9% body shows the indecision from open to close. The index dipped to create a long lower wick, then made new all-time highs before closing just above the open. The closing range of 72% and the higher high and higher low, makes for a slightly bullish candle. More stocks declined than advanced.
-=x=-=x=-=x=-=x=-=x=-=x=-=x=-
Friday, January 22, 2021
Facts: +0.09%, Volume lower, Closing range: 77%, Body: 66%
Good: Higher high and higher low, tested but stayed above low
Bad: Pullback in last hour created upper wick
Highs/Lows: Higher high, higher low
Candle: Thick green body under a longer upper wick than lower wick
Advance/Decline: 1.54, about three advancing for every one declining stock
Indexes: SPX (-0.30%), DJI (-0.57%), RUT (+1.28%), VIX (+2.77%)
Sectors: Real Estate (XLRE +0.25%), Utilities (XLU +0.14%) and Communications (XLC +0.04%) were the only gaining sectors. Financials (XLF -0.72%) was the bottom sector.
Expectation: Sideways or Higher
Welcome back to the game RUT! It was a mixed session for most of the major indexes. But the Russell 2000 proved there is more room for small-caps to grow. The Nasdaq was also able to end with a small gain for the day after fighting off morning bears and making a new all-time high before dropping back slightly at close.
The Nasdaq ended with a +0.09% gain on lower volume. The closing range was 77% with a thick 66% green body in the candle. The visible upper wick was created near the end of the day as investors took profits and shifted to defensive positions headed into the weekend. About three stocks advanced for every declining stock.
-=x=-=x=-=x=-=x=-=x=-=x=-=x=-
The Meaning of Life (View on the Week)
As the previous week was full of caution and indecision, this week the market as full of optimism. The gap-up on Wednesday, Inauguration Day, was the biggest statement of the week. Investment poured back into mega-caps with several of the biggest companies rising to new all-time highs after months of sideways consolidation. But small-caps and growth stocks were not left behind. It was a positive week across all the indexes.
The Nasdaq gained +4.19% for the week, leading the major indexes. The S&P 500 (SPX) gained +1.94% and the Dow Jones Industrial (DJI) gained +0.59%. The small-cap Russell 2000 (RUT) gained +2.15%. All of the indexes hit new all-time highs during the week.
The week kicked off with investors moving out of the defensive positions of the previous week and back into riskier sectors. Defensive sectors like Utilities and Real Estate were sold while long-term US Treasury bond yields rose. Riskier corporate bonds were bought up on confidence in the economic recovery.
Wednesday was the pivotal day that would define the rest of the week. Mega-caps came alive with breakouts for Apple, Microsoft and Alphabet. The latter two would reach new all-time highs. Another mega-cap, Netflix would soar after surprising investors with subscription growth and announcing they were on pace for sustainable cash flow positive and would consider stock buy backs.
Thursday and Friday slowed a bit, but still turned in positive gains for the Nasdaq. Friday the Russell 2000 proved that small-caps have more room to grow as well, leading the major indexes for the day. There were some moves back into defensive plays late on Friday as has become typical to close recent weeks.
The index has set a new high for 9 weeks in a row, even on the weeks that ended in a loss. Average closing range continues to be very high with the most recent week closing with a 95% closing range. The volume was the lowest of the last three weeks, but still higher than average volume for the past six months.
Communications ( XLC ) led the week with a big +5.44% gain, but only after a big pullback the week prior. The sector was led by Alphabet ( GOOGL ) and Facebook ( FB ) with +9.55% and +9.21% gains respectively. Those two companies make up 44% of the ETF . Netflix ( NFLX ) also had a huge gain of +13.49% but only represents 5% of the ETF .
Technology ( XLK ) finished the week in second place, also with the mega-caps, Apple ( AAPL ) and Microsoft ( MSFT ) contributing the most to the gains.
Financials ( XLF ) continued to underperform as more financial institutions reported earnings and disappointed investors.
Energy ( XLE ) was the worst performing sector of the week. There is probably some influence from the new administration policies. However, the more immediate impact was from surprise surplus in oil supplies, signaling much lower demand for oil than anticipated.
The only significant pivots during the week were on Wednesday, January 20th which was inauguration day. That day saw a spike in Communications, Technology and Real Estate ( XLRE ).
The pivot for Communications and Technology were likely reinvestment into mega-caps that didn't seem to be in the crosshairs of any new policies, alleviating some fears of policies that would hurt big tech.
The Real Estate pivot was driven by the additional assistance for renters proposed in the new stimulus package. The stimulus approved in December only covered the estimated amount of back rent owed, but the new stimulus package would extend rental assistance into the future.
US 10y and 20y Treasury Bond yields rose for the week and continue an uptrend from a July 2020 dip. The US 2y Treasury Bond yield dropped, widening the yield spread between long term and short term bonds.
High Yield Corporate Bonds (HYG) prices advanced for the week while Investment Grade Bond (LQD) prices dropped. That indicates a move from safer investments to riskier investments, although the moves are not very large.
The US Dollar (DXY) declined -0.54% for the week.
The put/call ratio (PCCE) ended the week at 0.517, an low value that shows overly bullish optimism among traders. A contrarian indicator, when the put/call ratio is below 0.7, it signals overly bullish sentiment which typically proceeds a pullback in the market. The indicator was at 0.458 just before the September correction and it was at 0.489 just before the short October correction.
The CNN Fear & Greed index is also increasing toward the Greed side, but not within the Extreme Greed range yet.
Probably the most alarming of the contrarian sentiment indicators is the NAAIM Exposure Index which is at 112.93. This is the highest leveraged exposure among money managers since December 2017. The exposure tends to be cyclical in that when it reaches above 100, it often marks the beginning of a dip in market prices and likewise in the NAAIM Exposure index. However, November and December provided a unique moment in the index history as the exposure remained above 100 for five weeks in a row.
Silver (SILVER) was up -2.98% and Gold (GOLD) was up +1.49% for the week.
Crude Oil futures were up +0.26%.
Timber (WOOD) was up +3.091%. Copper (COPPER!1) was even at -0.01% while Aluminum (ALI1!) gained +1.03%.
One of the questions coming into this week was when would the biggest four mega-caps join the market rally. They answered big on Wednesday with breakouts among Apple, Microsoft and Alphabet. Amazon still has a bit to go before confirming the breakout, but also had a big move. All are now trading above key moving average lines. Still, a little more volume will help confirm these moves.
Earnings releases will start in the next week and could provide that additional boost. Or they could send investors running. MSFT on 1/26, AAPL on 1/27, AMZN on 1/30 and GOOGL on 2/2.
-=x=-=x=-=x=-=x=-=x=-=x=-=x=-
The Week Ahead
Consumer Confidence numbers for January will be updated on Tuesday. Core Durable Good Orders for December will be released on Wednesday. The data provides insight into manufacturing activity which has been at its highest level in 14 years.
Probably the most important economic news for the week will come on Wednesday afternoon when the Federal Open Market Committee makes a statement and the Fed announces any decisions on Interest Rate changes.
GDP data for Q4 of 2020 will be released on Thursday before market open. Initial Jobless Claims will also be updated.
Friday will bring more employment data, and several inflation related metrics including PCE consumer price indexes and near and long term inflation expectations.
This week will put us at the height of the earnings season with several significant companies making earnings announcements. Microsoft (MSFT), Johnson & Johnson (JNJ), Starbucks (SBUX), AMD (AMD), American Express (AXP), Dr Horton (DHI) are several of the big releases on Tuesday. Wednesday will bring reports from Apple (AAPL), Tesla (TSLA), Boeing (BA), Facebook (FB). Thursday won't provide any rest as Visa (V), Mastercard 9MA), McDonald's (MCD), Atlassian (TEAM), Western Digital (WDC), American Airlines (AAL). Friday will end the week with reports from Eli Lilly (LLY), Chevron (CVX) and Honeywell (HON).
No doubt I've missed some of your favorites as I can't list them all here. Make sure you know when the earnings dates are for the companies in your portfolio. Then act according to your plan whether you hold thru earnings or reduce positions.
-=x=-=x=-=x=-=x=-=x=-=x=-=x=-
The Bullish Side
The market made a big statement on Wednesday as the US transitioned to a new administration and a government dominated by the Democrats. The gains signaled investor confidence in the economic recovery and optimism for more stability in markets less impacted by turmoil in politics.
The largest mega-caps, which have not participated fully in the rally since early November, finally broke out of consolidation patterns. The mega-caps influence not only the major indexes, sector indexes, but also have influence over investor sentiment.
The $1.9 trillion dollar stimulus proposed by the Biden administration brings more strength to the recovering economy. The plan will reduce further negative impacts on employment and relieve worries from the unemployed that they might lose their homes. The stimulus checks have added to a record amount of household savings since the pandemic began. Those savings have yet to be unleashed by nervous consumers back into the economy.
While still requiring an extraordinary amount of coordination across the public and private sector, we finally have a plan for mass vaccination in the US that puts the end of the pandemic insight. Pandemic news is one of the remaining sources of big market reactions over the past few months.
-=x=-=x=-=x=-=x=-=x=-=x=-=x=-
The Bearish Side
Investor sentiment is at a very bullish level which should bring caution to the smart investor. The NAAIM exposure index shows a high level of leverage among money managers. At that high level, it only has one direction to go which is down. Money manager can reduce leverage if more money flows into the market, but more likely it will be lowered by reducing position sizes.
The surprise surge in Oil inventories this past week show that the pandemic is still having a big impact on many sectors from leisure to travel and transportation. Yet the surge in oil inventories has not meant a reduction in prices for consumers or industries depending on shipping and transportation of goods.
That brings us to inflation. The fed has been very specific about its goals for higher inflation and there are signs now that their fiscal programs are starting to get the desired result. The US Dollar value remains low while commodity prices rise. As consumers begin to unleash the record savings into new purchases, demand will outpace supply quickly and raise prices.
Some inflation could be bullish if it also impacts employment and wages, but there is more likely a cycle in which employment and wages stay lower while inflation moves prices higher. Additionally, at some point the Fed will have to decide inflation is high enough and take actions to control it. Those actions will likely be met with a negative response from investors, even if temporary.
None of this would play out within the next week, but are things to keep an eye on as we keep the bearish side in mind.
-=x=-=x=-=x=-=x=-=x=-=x=-=x=-
Key Nasdaq Levels to Watch
There are several key levels in the Nasdaq to keep an eye out for and respond accordingly. First on the positive side:
The high of Friday at 13,567.14. Can the index continue to make newer highs each week?
Thursday and Friday both fell short of breaking thru 13,600. That would be the next level to watch.
On the downside, there are several key levels to raise caution flags:
The low of last week is 13,078.70. Stay above that line to set a higher low next week.
13,045.66 is the 21d EMA. That is 3.65% below Friday's close. It would be nice for that line to catch up a bit before its tested. If the index dips below, it would be a concern.
13,000 is an area of support.
12,558.09 is the 50d moving average. The 50d moving average is key support line that has not been tested since 11/4.
The 200d MA moved above the lows of October and is now about 20% below the index at 10,913.59.
-=x=-=x=-=x=-=x=-=x=-=x=-=x=-
Wrap-up
After a week of optimistic gains in the market, it wouldn't be bad for some pause and sideways movement or even a small pullback next week. That would give the key moving average lines, which provide areas of support, some time to move up closer to the indexes. It would also allow a tapering off of the overly bullish sentiment in less dramatic way than a small or large correction.
Overall, the market continues its bullish rally with a higher high and a lower low this week. The indicators are just indicators and don't drive the market. While some caution is necessary, there are many reasons to be confident in the market in the short term.
Good luck, stay healthy and trade safe!

Daily Market Update for 1/22Trend lines drawn from the 10/30 bottom (57d), 1/15 (5d) and today 1/22 (1d).
Ideas always welcome in the comments. Errors will be amended as comments on TradingView or and corrected inline in my blog.
I'm working to condense this daily update over the next few weeks. I need to reduce it for both brevity and preparation time.
-=x=-=x=-=x=-=x=-=x=-=x=-=x=-
Friday, January 22, 2021
Facts: +0.09%, Volume lower, Closing range: 77%, Body: 66%
Good: Higher high and higher low, tested but stayed above low
Bad: Pullback in last hour created upper wick
Highs/Lows: Higher high, higher low
Candle: Thick green body under a longer upper wick than lower wick
Advance/Decline: 1.54, about three advancing for every one declining stock
Indexes: SPX (-0.30%), DJI (-0.57%), RUT (+1.28%), VIX (+2.77%)
Sectors: Real Estate (XLRE +0.25%), Utilities (XLU +0.14%) and Communications (XLC +0.04%) were the only gaining sectors. Financials (XLF -0.72%) was the bottom sector.
Expectation: Sideways or Higher
-=x=-=x=-=x=-=x=-=x=-=x=-=x=-
Market Overview
Welcome back to the game RUT! It was a mixed session for most of the major indexes. But the Russell 2000 proved there is more room for small-caps to grow. The Nasdaq was also able to end with a small gain for the day after fighting off morning bears and making a new all-time high before dropping back slightly at close.
The Nasdaq ended with a +0.09% gain on lower volume. The closing range was 77% with a thick 66% green body in the candle. The visible upper wick was created near the end of the day as investors took profits and shifted to defensive positions headed into the weekend. About three stocks advanced for every declining stock.
The Russell 2000 (RUT) had a crazy open, dropping a full one percent in its opening five minutes. That wouldn't last long and the small-cap index climbed the rest of the day, ending the session with a new all-time high and 100% closing range. The RUT gained +1.28% for the day. The S&P 500 (SPX) and Dow Jones Industrial (DJI) had very different days, dropping -0.30% and -0.57% respectively.
Real Estate (XLRE +0.25%), Utilities (XLU +0.14%) and Communications (XLC +0.04%) were the only gaining sectors. Financials (XLF -0.72%) was the bottom sector. It was clear from the beginning of the session that investors were making defensive plays on the last day of the short week.
-=x=-=x=-=x=-=x=-=x=-=x=-=x=-
Economic Indicators
The US Dollar (DXY) gained +0.12% for the day. US 30y and US 20y treasury bond yields dropped slightly while 2y yields remained flat. Corporate Bonds (HYG) prices decreased for a second day.
Silver (SILVER) advanced while Gold (GOLD) declined for the day. Crude Oil (CRUDEOIL1!) futures declined. Timber (WOOD) advanced to a new multi-year high. Copper (COPPER1!) declined while Aluminum (ALI1!) advanced. The +3.67% increase in Aluminum futures comes after several weeks of declines. The commodity prices have pivoted today from recent trends. This will be something to watch for a continuation and new trend.
-=x=-=x=-=x=-=x=-=x=-=x=-=x=-
Investor Sentiment
The put/call ratio 0.517. The put/call ratio (PCCE) is a contrarian indicator that shows overly bullish or overly bearish investor behavior. The 0.7 level is considered normal. As it approaches 0.60 (overly bullish) and below, watch for a possible pullback in the market.
-=x=-=x=-=x=-=x=-=x=-=x=-=x=-
Market Leaders
Apple (AAPL) led the largest mega-caps with a +1.61% gain. Microsoft (MSFT) and Alphabet (GOOGL) both gained about +0.45%. Amazon (AMZN) dropped back from recent gains to lose -0.45% for the day. All are healthy moves.
Home Depot (HD) led the mega-caps with a 1.77% gain, likely driven by surprisingly good real estate data this week, including Housing Starts and Existing Home Sales. Intel (INTC) sold off sharply for a -9.29% loss after a big gain yesterday. The late day gains yesterday were caused by an early release of earnings after some of the details leaked.
Several growth stocks had big advances for the day. Sumo Logic (SUMO) advanced 12.10%. Digital Turbine (APPS) gained +25.40%. But the big winner of the day was Palantir (PLTR) with a 25.40% gain.
Gamestop (GME) continued its short squeeze with a +51.08% gain. I may have to add GME as another contrarian indicator of investor sentiment. :)
-=x=-=x=-=x=-=x=-=x=-=x=-=x=-
Looking ahead
There is not much economic news schedule for Monday.
There are also no "Daily Market Update" notable earnings releases for Monday. That's the quiet before the storm as many of the big mega-caps will report earnings starting Tuesday.
-=x=-=x=-=x=-=x=-=x=-=x=-=x=-
Trends, Support and Resistance
The five-day trend line points to a +1.95% gain. The one-day trend line points to a +0.49%.
The recent gains for the index still put it above the long-term trend line from the 10/30 bottom, but it is closing in on the middle of that channel. The line is pointing to a -0.67% loss for Monday.
If there is a further downside move, 13,000 support seems to be holding up well for the index and that's just below the 21d EMA now. The 21d EMA is around 3.6% below the index. The index also held the 12,550 area recently. If it passes that area, the next support area is 12,250.
-=x=-=x=-=x=-=x=-=x=-=x=-=x=-
Wrap-up
It wasn't a bad way to end a solid week of gains. After climbing over 4% it's good to have the Nasdaq pause and let the moving averages catch up. A higher high and higher low for the week, continues a 12 week rally since early November. Keeping the gains at a steady pace can help the rally continue its move upward.
Stay healthy and take care!

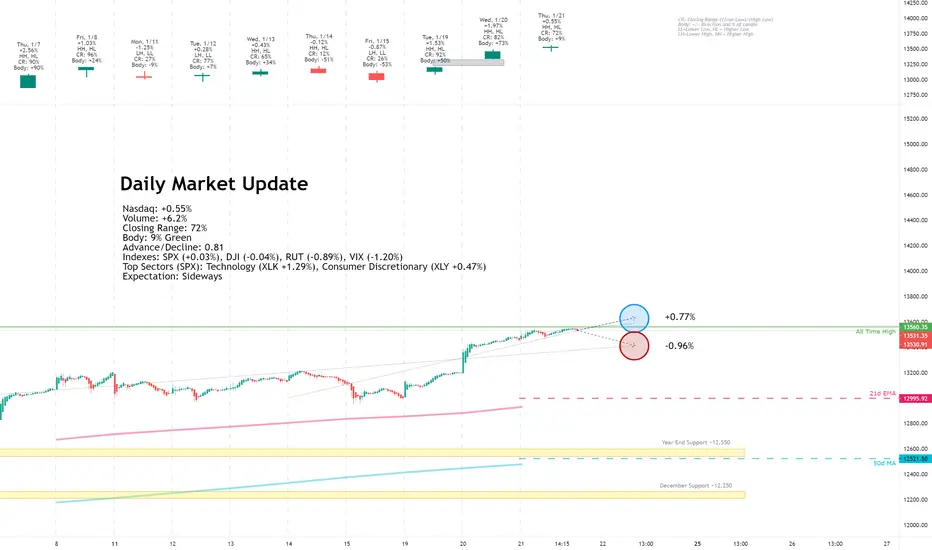
Daily Market Update for 1/21Trend lines drawn from the 10/30 bottom (56d), 1/14 (5d) and today 1/21 (1d).
Ideas always welcome in the comments. Errors will be amended as comments on TradingView or and corrected inline in my blog.
I'm working to condense this daily update over the next few weeks. I need to reduce it for both brevity and preparation time.
-=x=-=x=-=x=-=x=-=x=-=x=-=x=-
Thursday, January 21, 2021
Facts: +0.55%, Volume higher, Closing range: 72%, Body: 9%
Good: New all-time high, support at yesterday's close for higher low
Bad: Thin body, indecisive candle
Highs/Lows: Higher high, higher low
Candle: Thin green body with visible upper and lower wicks could be a spinning top
Advance/Decline: 0.79, more declining stocks than advancing stocks.
Indexes: SPX (+0.03%), DJI (-0.04%), RUT (-0.89%), VIX (-1.20%)
Sectors: Technology (XLK +1.29%), Consumer Discretionary (XLY +0.47%), and Communications (XLC +0.35%) were the only advancing sectors. Energy (XLE -3.38%) was the worst performing sector.
Expectation: Sideways
-=x=-=x=-=x=-=x=-=x=-=x=-=x=-
Market Overview
It was a choppy session with some indecision from open to close on which direction the indexes wanted to move. In the end, investors ignored bleak unemployment data and ended the day with gains, albeit very concentrated in specific sectors.
The Nasdaq ended with a +0.55% gain on higher volume. However the 9% body shows the indecision from open to close. The index dipped to create a long lower wick, then made new all-time highs before closing just above the open. The closing range of 72% and the higher high and higher low, makes for a slightly bullish candle. More stocks declined than advanced.
The Russell 2000 (RUT) declined -0.89% for the day, continuing to trail the other major indexes this week. The S&P 500 (SPX) and Dow Jones Industrial (DJI) stayed about even for the day. The VIX declined -1.20%.
Technology (XLK +1.29%), Consumer Discretionary (XLY +0.47%), and Communications (XLC +0.35%) were the only advancing sectors. These three sectors all have large exposure to the biggest mega-caps which helped drive gains for the day. Energy (XLE -3.38%) was the worst performing sector. Energy dipped as crude oil prices took a hit from a surprise increase in US supply, and slower recovery in demand than expected.
-=x=-=x=-=x=-=x=-=x=-=x=-=x=-
Economic Indicators
The US Dollar (DXY) declined -0.44% for the day. US 30y and US 20y treasury bond yields climbed back to recent highs while shorter term yields remained flat. Corporate Bonds (HYG) prices decreased slightly for the day, but remain near recent highs.
Silver (SILVER) advanced while Gold (GOLD) declined for the day. Crude Oil (CRUDEOIL1!) futures declined. Timber (WOOD) advanced to a new multi-year high. Copper (COPPER1!) declined while Aluminum (ALI1!) advanced. The +3.67% increase in Aluminum futures comes after several weeks of declines. The commodity prices have pivoted today from recent trends. This will be something to watch for a continuation and new trend.
-=x=-=x=-=x=-=x=-=x=-=x=-=x=-
Investor Sentiment
The put/call ratio rose to 0.609. The put/call ratio (PCCE) is a contrarian indicator that shows overly bullish or overly bearish investor behavior. The 0.7 level is considered normal. As it approaches 0.60 (overly bullish) and below, watch for a possible pullback in the market.
The CNN Fear & Greed index continues to rise. The NAAIM exposure is at its highest value since 2017. Money Managers are well into leverage with a mix of bullish and bearish sentiment.
-=x=-=x=-=x=-=x=-=x=-=x=-=x=-
Market Leaders
The four biggest mega-caps, Apple (AAPL, Microsoft (MSFT), Amazon (AMZN) and Alphabet (GOOGL) all continued advances from yesterday. Apple and Alphabet set new all-time highs before retreating a bit. All four are well above the key moving average lines now.
Intel (INTC) was the leading mega-cap, gaining +6.46% as investors anticipated the earnings announcement after hours. However earnings slipped despite record revenue and the stock fell back 4.74% in aftermarket trading
Overall mega-caps were mixed. Energy and Financial stocks were at the bottom of the list.
Growth stocks were also mixed, but there were some big winners for the day. FUTU gained another 9.95%, but was outshined by the similar stock UP Fintech (TIGR) which gained 23.72%. Chinese FinTech companies have had quite a run the past few weeks.
AirBnB (ABNB) gained 11.48%. Fastly (FSLY), Solar Edge (SEDG) and Moderna (MRNA) all gained over 6%. Digital Turbine (APPS -3.67%) fell back from yesterday's gains.
-=x=-=x=-=x=-=x=-=x=-=x=-=x=-
Looking ahead
Manufacturing and Services purchasing data will be released just after market open. These numbers show economic activity in the two sectors. Additional real estate data will be released a few minutes later.
Crude Oil Inventories will be provided at 11:00 and could add to yesterday's negative news for the energy sector.
Big oil company, Schlumberger (SLB) will release earnings before market open.
-=x=-=x=-=x=-=x=-=x=-=x=-=x=-
Trends, Support and Resistance
The one-day and five-day trend lines point to a gain of +0.40% to +0.77%.
After a few days of gains, the index is well above the long-term trend line from the 10/30 bottom. That line points to a loss of -0.96%.
If there is a downside move, 13,000 support seems to be holding up well for the index and that's just above the 21d EMA now. The 21d EMA is around 3.8% below the index which should also offer support at the 13,000 level. The index also held the 12,550 area recently. If it passes that area, the next support area is 12,250.
-=x=-=x=-=x=-=x=-=x=-=x=-=x=-
Wrap-up
Yesterday was an explosive day of gains. It's no surprise that the index would take a breather today. The choppiness during the day is a reason for some caution. The gains were focused on larger caps that are breaking out from recent bases.
The higher high and higher low is a great sign and we will hopefully continue the trend to finish the short week.
Stay healthy and take care!

Daily Market Update for 1/20Trend lines drawn from the 10/30 bottom (55d), 1/13 (5d) and today 1/20 (1d).
Ideas always welcome in the comments. Errors will be amended as comments on TradingView or and corrected inline in my blog.
I'm working to condense this daily update over the next few weeks. I need to reduce it for both brevity and preparation time.
-=x=-=x=-=x=-=x=-=x=-=x=-=x=-
Wednesday, January 20, 2021
Facts: +1.97%, Volume higher, Closing range: 90%, Body: 73%
Good: Gains the whole day and closing near the top of the range
Bad: Gap up
Highs/Lows: Higher high, higher low
Candle: Mostly green body with a tiny lower wick and more visible upper wick from some selling at close
Advance/Decline: 1.29, more advancing stocks than declining stock.
Indexes: SPX (+1.39%), DJI (+0.83%), RUT (+0.44%), VIX (-7.14%)
Sectors: Communications (XLC +3.14%) and Real Estate (XLRE +2.08%) were top. Financials (XLF -0.42%) was the only losing sector.
Expectation: Sideways or Higher
-=x=-=x=-=x=-=x=-=x=-=x=-=x=-
Market Overview
If the equity market could talk, I think it would say Happy Inauguration Day. Investors breathed a sigh of relief that maybe some of the turmoil is behind us. That sentiment translated into a gap up at open with steady gains throughout the day.
The Nasdaq closed with a big +1.97% gain on higher volume. The candle has a closing ranging of 82%, but including the gap the actual closing range is even better at 90%. The 73% green body and tiny lower wick shows the nearly constant gains that happened throughout the trading session. There were more advancing stocks than declining stocks, but note that the breadth was not as wide as the previous day.
The Russell 2000 (RUT) gained 0.43%, one of the few times in recent months where it has trailed the other indexes in performance. So there was a shift back towards the larger caps, but not enough to call it a rotation. The S&P 500 (SPX) ended with a +1.39% gain while the Dow Jones Industrial (DJI) gained +0.83%.
Communications (XLC +3.14%) was the leading sector by a large margin. Technology (XLK +1.98%) looked like it would keep up with Communications in the morning, but faded behind Real Estate (XLRE +1.98%) by afternoon. Consumer Discretionary (XLY +1.89%) was the other stand-out sector. These four sectors drove the S&P 500 gains. All other sectors under-performed the major index. Only Financials (XLF -0.42%) declined for the day.
-=x=-=x=-=x=-=x=-=x=-=x=-=x=-
Economic Indicators
The US Dollar (DXY) declined slightly to -0.03%. US 30y treasury bond yields stayed about even while US 10y and US 2y yields dropped. Corporate Bonds (HYG) prices increased for the day and set a recent high.
Silver (SILVER) and Gold (GOLD) both advanced for the day. Crude Oil (CRUDEOIL1!) futures also rose. Timber (WOOD) and Copper (COPPER1!) advanced while Aluminum (ALI1!) declined. These commodity trends have been consistent the past 4-5 days.
-=x=-=x=-=x=-=x=-=x=-=x=-=x=-
Investor Sentiment
The put/call ratio rose slightly to 0.560. The put/call ratio (PCCE) is a contrarian indicator that shows overly bullish or overly bearish investor behavior. The 0.7 level is considered normal. As it approaches 0.60 (overly bullish) and below, watch for a possible pullback in the market.
-=x=-=x=-=x=-=x=-=x=-=x=-=x=-
Market Leaders
The four biggest mega-caps, Apple (AAPL, Microsoft (MSFT), Amazon (AMZN) and Alphabet (GOOGL) decided they finally wanted to join the market rally. All four turned in huge gains for the day. Alphabet was the biggest gain, advancing +5.36%. All four closed well above the key 21d EMA and 50d MA.
Netflix was the top performing mega-cap after surprising investors with a record number of subscribers and the first time over 200m. The fact they did not meet earnings expectations, did not matter. The subscribers plus the announcement of a potential stock buyback program sent the price soaring.
Most mega-caps had gains for the day. The large banks such as Bank of America (BAC) and JP Morgan Chase (JPM) were the worst performers.
There were a lot of exciting moves among growth stocks as well. FUTU (FUTU) had another big advance with a +10.97% gain. Digital Turbine (APPS) also broke into new all-time highs with a +10.85% gain.
-=x=-=x=-=x=-=x=-=x=-=x=-=x=-
Looking ahead
Tomorrow will kick-off with real estate data before market open. That will include Building Permits and Housing Starts. Also before market open, there will be an update on Initial Jobless Claims and Manufacturing data for January.
Fifth Third (FITB) and KeyCorp (KEY) are among financial companies reporting earnings before market open. Intel (INTC) will IBM (IBM) announce earnings after market close.
-=x=-=x=-=x=-=x=-=x=-=x=-=x=-
Trends, Support and Resistance
If today's trend line continues tomorrow, it points to a +1.08% gain tomorrow.
The five-day trend line and long-term trend line from the 10/30 bottom point to a small pullback of -0.44%.
If there is a downside move, 13,000 support seems to be holding up well for the index and that's just above the 21d EMA now. The 21d EMA is around 3.8% below the index which should also offer support at the 13,000 level. The index also held the 12,550 area recently. If it passes that area, the next support area is 12,250.
-=x=-=x=-=x=-=x=-=x=-=x=-=x=-
Wrap-up
It was a bold statement made by the markets today as the US transitions to a new administration. Lots of great things happened including the big mega-caps joining the current market rally that started in November.
The Financial sector declining on such a big day was one negative point. The sector is declining as more banks are releasing earnings that beat expectations on earnings but are disappointing on revenue. But keep in mind that the higher treasury bond yields, that are expected to drive more revenue in this sector, only came in the first week of January.
Watch out for the gap created today. The index doesn't have to fill the gap, but it often has in the past.
Stay healthy and take care!
