8892 on Nasdaq is imminent. It’s again quite simple. 8892 is only 10% lower from here. That’s just still not enough PE compression. We are still up 525% since January 2010. That’s ridiculous. Purely liquidity melt-up not based on any fundamentals. Earnings were also a garage.. If you know this now you’ll take the red pill and understand how Marcus will work going forward and how they always should have worked. Not 0% rates and unlimited quantitive, easing or QE . QT will be massive and constant for years. With rate hikes for foreseeable future. Period. At best. $200 a share for the S&P. Morgan Stanley had it at $190 a share. $200 a share X 14X equals 2800. Now that’s at best. On Nasdaq. Ultimately. After this failed 15 year fed experiment. And PPI sand CPI much higher than anything reported tomorrow or anytime, this will be an extremely deep recession. And 15-20% chance of a depression.
Fed funds rate must be above the CPI rate. This is economics 101. Terminal rate will be north of 7%. Not 4%. The Fed will not stop. No matter what, so follow these “God Fibonacci levels” to the tee. Because the market probably has 20% more to fall at a minimum. And then you can talk about at least being somewhat close to properly priced. Everything is overvalued, especially the NASDAQ, which is the worst and S&P. be smart. Energy. Some healthcare, And qqq puts and spy puts. Nov/December time frame. Very important to have a good amount of QQQ and SPY puts. This is what the revenues are made. To hedge your portfolio and gain from times once in every hundred years a lottery ticket. Watch implied Vol. so you don’t over pay. And for godsakes, SELL EVERY SINGLE RALLY WITHOUT HESITATION. EVERY RALLY. Good luck
IXIC trade ideas
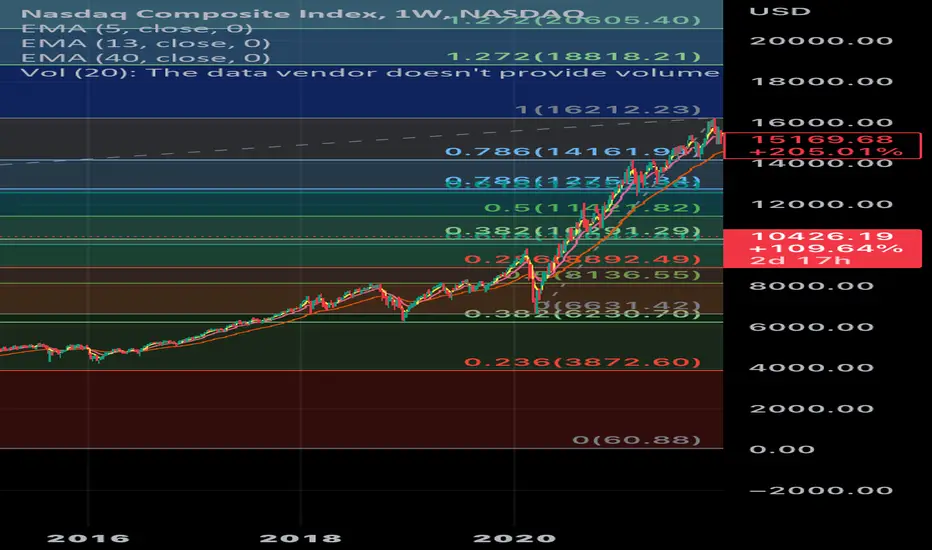
This is where we are 100% heading It’s not difficult right now to understand that all the indexes are over value. S&P 500. Morgan Stanley today though I don’t need them brought S&P earnings to $190 a share. So 190×14 X equals 2660 on the S&P 500. NASDAQ 9000 is where I have been for many many years. It’s again not very hard to understand. 15 year failed federal reserve experiment with 9 trillion on the books and about 1000 head wins to zero tail winds.

IXIC , NDQ , NAZDAQ ANALYSIS , 1 WEEKI analyzed the Nasdaq index in the weekly time frame for you
If until the closing of the weekly candle, the power and body of the candle is as strong as possible
there is a high probability that the price will increase until Fibonacci 50%, and
then the price will drop sharply.
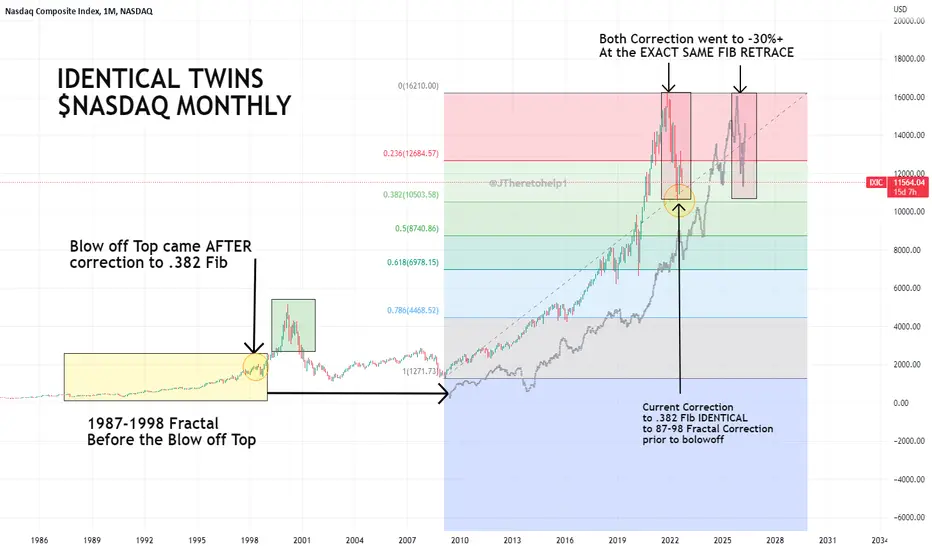
NDQ/NDX/IXIC | Exactly the same (except the blow-off top)Please read to the end, for a probable explanation that falsifies this one.
We are living the precise events that led up to the 2000 .com bubble burst and the subsequent 2001 recession. Now however, there was no blow-off-top event to make the two events identical.
Back in 1998, there was a "black swan" event, which was more apparent in DJI/SPX. This was caused by a crisis in Russia's economy. In 2019, a world-wide crisis caused the well-known crash. The progress after it is completely identical.
This can be further validated if you compare fundamentals. And also analyze DJI/SPX/NYA.
Much of the damage may have already occurred. But much more pain remains, perhaps immense. Germany is about to collapse (or already collapsed). Also war, food/water crisis, inflation, a destroyed production chain, are not ingredients for growth.
I am also adding this chart, which shows that probably the worst is coming, since it looks like we are barely falling.
PS. And now follows a conspiracy story:
Let there be a very rich man, who wants to be even richer. Since he is so wealthy, he could cause an earthquake. He would shake the box of economy, up and down at the time he pleases. And he confused the people, because the box of economy has taken a shape we all have seen before. In the era of information, who can't possibly see what is in front of him? Who on earth could not have possibly remembered the shape in front of them?
And as a different story said, everyone but a child could see the kings clothes (the king was nude).
And everyone feared, and sold everything they had to save themselves. And the rich man shook the box again and again, until it looked like we landed. And everyone thought that they were safe because it looked like it, and they bought again. And everything went up again. And the king was happy, because everyone saw his clothes, everyone followed him, and everyone bought when he wished...
And at the right time, he cracked the box and took your money. What an anticlimatic end to a story!
Tread lightly, for this is hallowed ground.
-Father Grigori

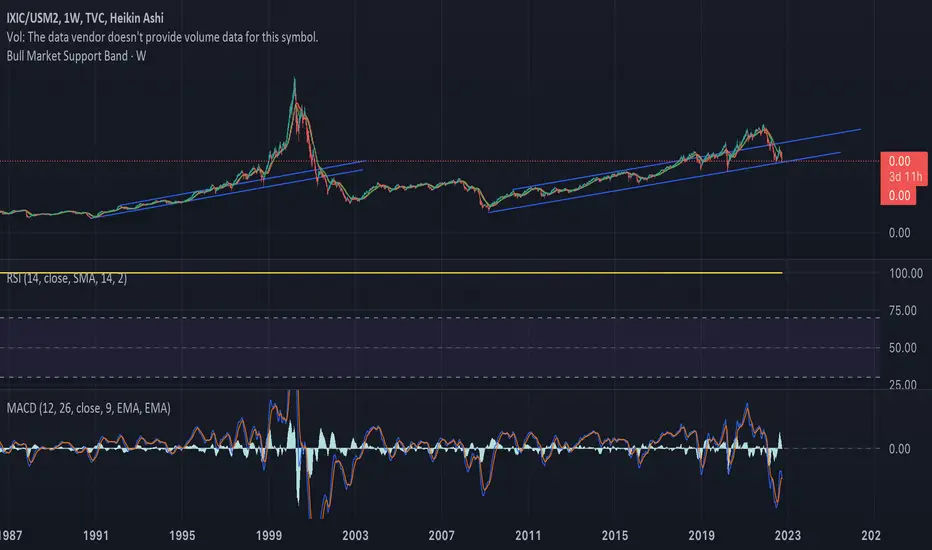
Nasdaq composite vs. USM2it really feels like a coin flip...the SPX/USM2 looks very similar to 2000 bubble times...if history repeats we are a blowoff top away before the big cahuna...macro is what it is, not much can be done about that, but i'm sure they were saying the same things during every scary bear time previously. For those who think we went too high, well vs the money supply we didn't come close to the dot come bubble. For me, i believe in one massive blowoff top, not because of market strength or economic strength...but IMO all these old politicians and private oligarchs will push for one more massive golden parachute before riding off into the sunset. Retail, at least in my are, are afraid, most people around me are in the, "i'm not even watching the markets" phase. Just my two pennies worth, all the best.


NASDAQ if breaks support 8100 next long term supportNASDAQ is oversold on some indicators but looking as if it can break this bottom support, if so, we'll be looking at 8100 next support

IXIC, You may find this analysis helpful in future !Is this another bear market rally? or just we are at the early stages of new massive bull run?
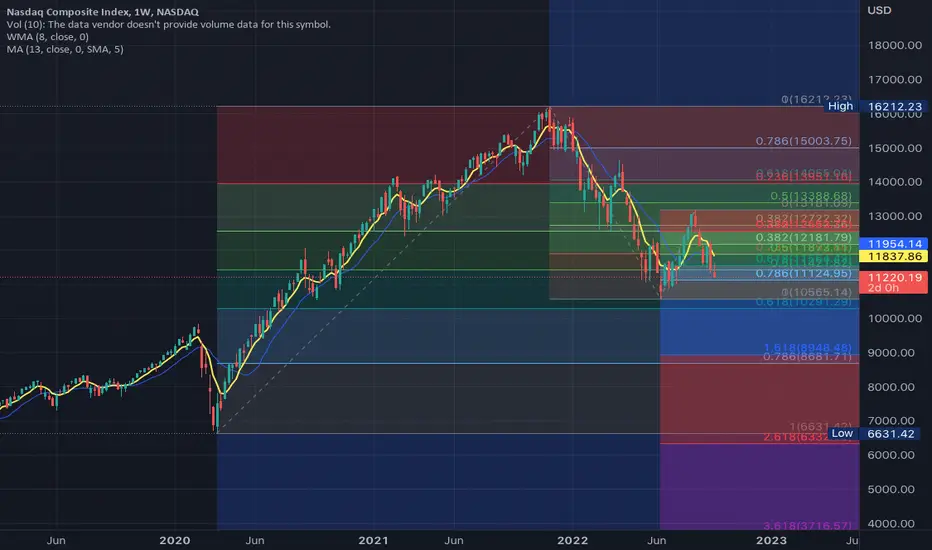
Since hitting 10565.14 low ( which was in 0.5 _ 0.618 Retracement zone of previous major rally from pandemic low to ATH ) , IXIC has started a promising rally for bulls. Is this low market's bottom? It might be, but lets review a contradictory yet valid scenario :
First of all I should emphasize this proposed scenario is not a fact and is just a possibility . I have to repeat again : " when we are in world of Elliott waves we are dealing with possibilities not certainties ".
As shown on the chart, Previous major decline from 16212.23 to 10565.14 can be labeled as impulsive 5 legs down going wave. Normally, we have a counter trend correction after an impulsive wave therefore, recent rally may be just a big counter trend correction bear market rally. Why I used normally ? Since there are some alternatives for this scenario which are beyond scope of this publication . Please remember : " Possibility vs Certainty "
Mentioned five legs down going impulsive wave can be labeled as wave 1 or A which implies for a counter trend correction as wave 2 or B . Strong resistance zone formed by 0.5 and 0.618 Retracement levels has been shown on the chart. This zone is also a valid supply/demand zone. In addition, my private Gann Box analysis confirms this zone as a strong resistance ( I excluded Gann Box from the chart to keep it as clean as possible).
200, 100 and 50 weeks moving averages have been also shown on the chart. As we see, 200 weeks moving average which supported the market at pandemic low was market savior one more time at last major low. 100 and 50 weeks MA s are waiting for the index at our proposed resistance zone. This makes our resistance zone even stronger.
If true, Worst has yet to come as wave 3 or C. If we are going to see wave 3 then may god bless the market.
Please note this is not to frighten anyone especially bulls or giving hope to bears. This is just an analysis which shows a valid possible scenario and I can strongly recommend you to keep this scenario in mind.
I Hope this analysis to be helpful and wish you all the best.

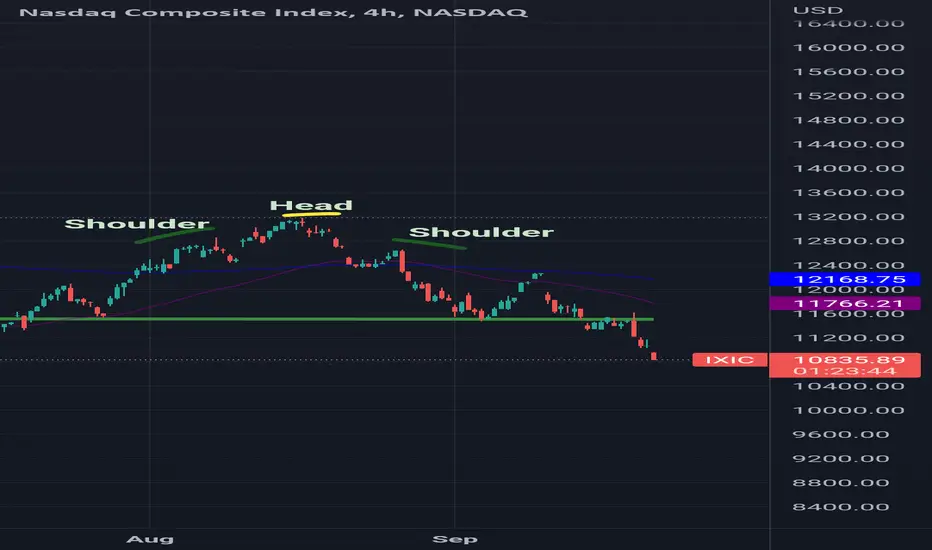
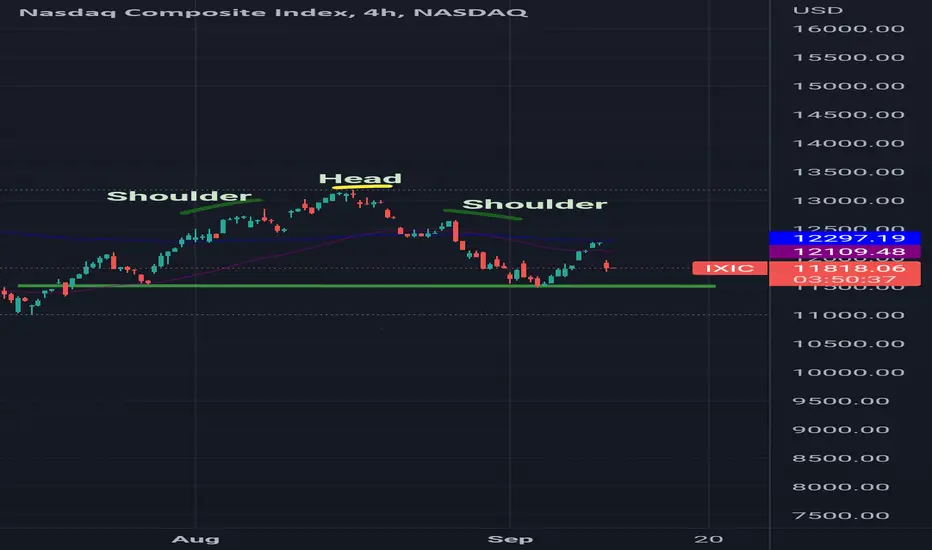
Price action keeps you ahead of major eventsHad mentioned earlier about the head and shoulders pattern getting formed in the nasdaq composite chart.
We say the fed hike event triggered the downfall but dear the price action already showed it coming.
see you at 10,000 on nasdaq minimumself explanatory....period....40 years of stock gains in there last 10 years.....time to pay the PIPER!!!!!!!

long way to go15 plus years in the making.....everyone knew withQE and 0%rates this day would come....well time to pay the piper biggggg time
Expecting Nasdaq to settle around 8600-9000 levels by Mar'23Nasdaq now looks in 5th wave of correction.
Expecting Nasdaq to settle around 8600-9000 levels by Mar'23
Nasdaq composite is heading towards 200 SMA support i.e. 11100NOTE: Posting purely for EDUCATIONAL PURPOSE only.
Nasdaq composite is heading towards 200 SMA support i.e. 11100
Prediction is It should revert to up side after touching to 11100 support.
Views are welcome.!!!

Will the Nasdaq $IXIC bounce on Wednesday (Fed Rate Hike)?On the day of the increase most likely the market will go up which is counter-intuitive because when you think about increasing interest rates money becomes more expensive to borrow. So shouldn't stock go down? Usually, that tends to be true, but when there are High rates of inflation investors want to pay less money for a company. P/E values get compressed because the time value of money means that investors need to use a higher discount rate when valuing a company. (Money today is worth more than it does in the future) But when you have high rates of inflation you have to take that into consideration so that when inflation comes down stocks will eventually go up because there will be this uncompression so that's what happens to the stock market.
For the real estate market, this is much easier to understand. When interest rates go higher, homes become more unaffordable in the short term but in the long term the values go down.
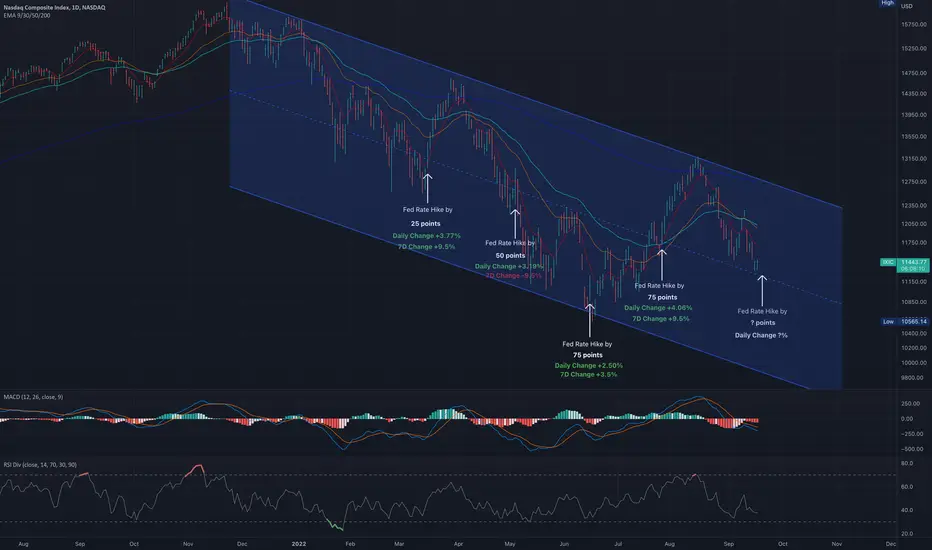
Now, if you take a look at the chart, on the last 4 hikes, we saw 4 big green candles on the day of the hike. Also, the RSI indicator shows that the market is currently oversold. So probability-wise, I think we will have a green day on Wednesday but who knows in the mid/long-term... The mid-term and long-term trends are still bearish.
Federal Funds Rate Hike / Nasdaq on that day:
March 16, 2022: 25 points / +3.77%
May 02, 2022: 50 points / +3.19%
June 15, 2022: 75 points / +2.50%
July 27, 2022: 75 points / + 4.06%
Nasdaq-Risk Off SituationThe Nasdaq remains a clear risk off situation.
1. New lows continue to expand
2. AD-line remains under the longer-term moving average
3. Price is looking to break below the lower channel support again.

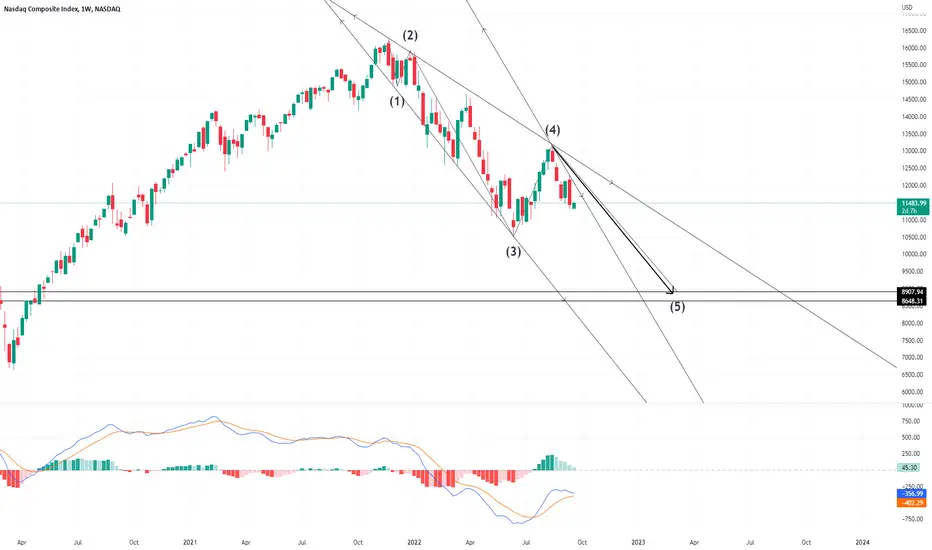
1987-1999 NASDAQ Structure vs Current Friends I hope your all having a lovely day. Just wanted to point out the eerily similar structure in the NASDAQ from the 1987 crash to the run up to 1999. The thing I want to primarily highlight is the correction PRIOR to the final leg up in 1999-2000. So this fractal copied IMMEDIATELY before the FINAL BLOW OFF TOP. The structures are IDENTICAL. BUT, not only that, the correction prior to the Final blow off actually had a 30%+ correction, AND retraced to the .382 Fib. Guess what??? Our current correction has fallen the EXACT SAME AMOUNT AND HIT THE EXACT SAME FIB!!! Coincidence??? Maybe. But with Bears everywhere you turn, my gut and the charts are screaming that we have one last melt up before the end of it all and the Crash to best all crashes.
Possible Support and Resistance LevelsPrice appears to have hit point C and came to a halt for now.
This formed an ABC pattern and the target is D. The pattern would then reverse back to the downside.
It does look like there may be some upside before another leg down but the market will most likely be a bit bouncy.
If one wanted to risk it, they may want to enter a trade long at 11845 and possibly exit at 12465.50, re-evaluate and maybe hit 13088ish.
The overall trend is down, but a market does not go straight up or straight down.
No recommendation/Just an observation.
The trend is your friend until it ends.

Head n Shoulders in the US MarketCareful, the Nasdaq composite has formed a typical head and shoulder pattern and any move below the thick green line could escalate further downward movement
NASDAQ Island Reversal on HourlyPicture perfect island reversal following higher than projected CPI figures. I'm thinking the bear market relief rally is complete.
Bought a little SQQQ on Friday 9/9 which was a day too early.
I think we'll have a strong downtrend in the near term at least until the Sept FOMC meeting.

IXIC bear trap, will skyrocket soon
This bear trap is too obvious. Now that most investors know the recession story of June 2022 was fake and irrational, there's really no basis for the major stock indexes to go much lower. However, there's probably more consolidation between 11600 and 12600 in September, as October is perceived as the traditional bearish month and investors keep panicking about the FOMC meeting. Only the most irrational and reckless traders would short near 11800, which would be guaranteed financial ruin in the long term.
Just buy as much index fund as you can, sit back and enjoy the end-of-year rally. The crazy newbie investors of 2020 and 2021 are mostly scared and liquidated out of the market right now, but sooner or later they will jump into the market with more cash, pushing IXIC to another crazy bull in 2023 and 2024. IXIC goes up, newbies got jealous, newbies jump into the market which pushes IXIC further up, making more newbies jealous... Feedback loop as they never learn.

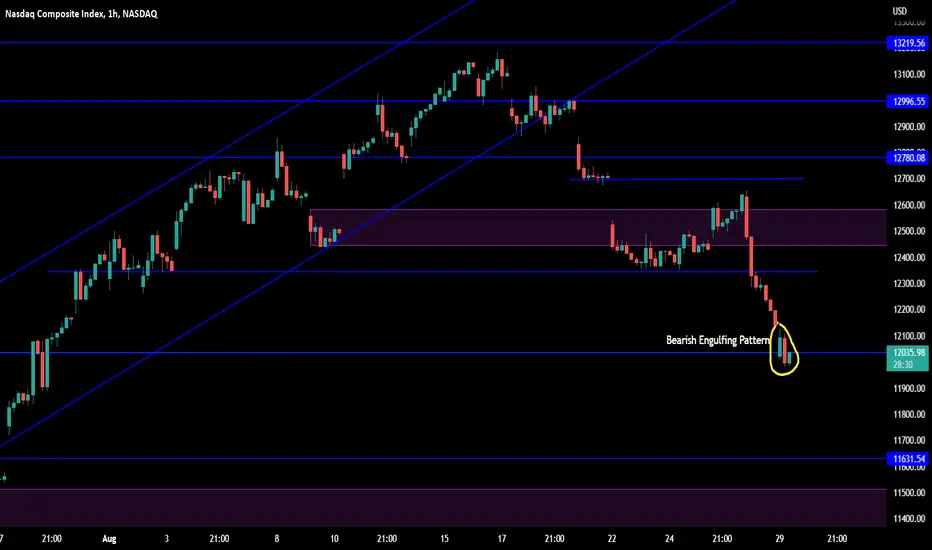
Nasdaq 1 Hour Time Frame Chart AnalysisThe Nasdaq chart has formed a bearish engulfing pattern in a 1-hour time frame.
Dont be greedy on IXICAs I posted IXIC price movement speculation a year ago or so, now I want to warn you this is only one of the possibilities. As we kno the price movement can choose only between two dirrefent directions. Either up or down. But now it looks too good to be true to me. But this time is different. With all the world situation and economic war between US and most of the worlds countries, media propaganda about big bear in front of our economy, europe automobile industry "cold". This is all the signt, that tells us be cautious. Be prepared to go at least "half-in" if the price starts to form higher lows on weekly chart. I Will give you updates about my movements and taught, what I think about this crap. See you down here eventually,
Wish you luck,
DonLobster
