USNAS100 | Breakout or Breakdown?USNAS100 | OVERVIEW
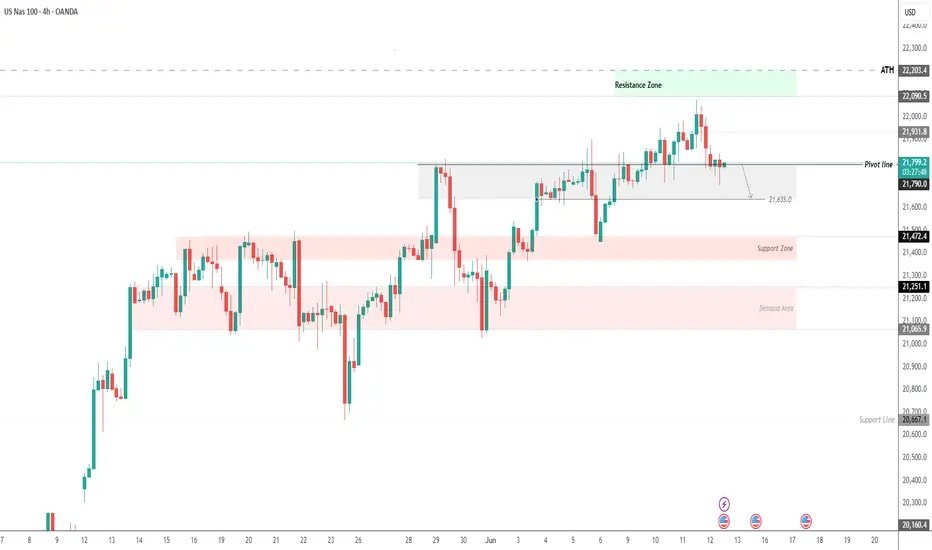
The price is currently stabilizing below the pivot level at 21790, suggesting continued bearish momentum.
📉 As long as the index remains below 21790, we expect a decline toward 21635. A confirmed 1H candle close below this level could extend the bearish trend toward 21470.
📈 A shift to bullish momentum will require a 1H candle close above 21820, which could open the way to 22090 and potentially a new all-time high at 22200.
Support Lines: 21635, 21470
Resistance Lines: 21930, 22090, 22200
NDQ trade ideas
Hanzo / Nas100 30 Min ( Accurate Tactical Break Out Zones )🔥 Nas100 – 30 Min Scalping Analysis (Bearish Setup)
⚡️ Objective: Precision Breakout Execution
Time Frame: 30-Minute Warfare
Entry Mode: Only after verified breakout — no emotion, no gamble.
👌Bullish After Break : 21840
Price must break liquidity with high volume to confirm the move.
👌Bullish After Break : 21930
Price must break liquidity with high volume to confirm the move.
👌Bearish After Break : 21755
Price must break liquidity with high volume to confirm the move.
☄️ Hanzo Protocol: Dual-Direction Entry Intel
➕ Zone Activated: Strategic liquidity layer detected — mapped through refined supply/demand mechanics. Volatility now rising. This isn’t noise — this is bait for the untrained. We're not them.
🩸 Momentum Signature Detected:
Displacement candle confirms directional intent — AI pattern scan active.
— If upward: Bullish momentum burst.
— If downward: Aggressive bearish rejection.
🦸♂️ Tactical Note:
The kill shot only comes after the trap is exposed and volume betrays their position.
Hanzo / Nas100 30 Min ( Accurate Tactical Break Out Zones )

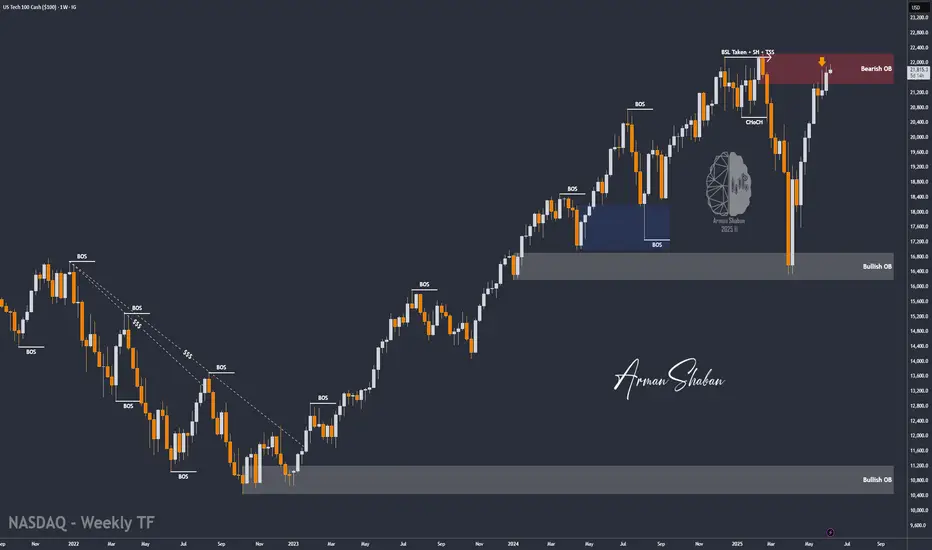
Nasdaq at Supply Zone – Rejection or Breakout? (READ THE CAPTIONBy examining the #Nasdaq chart on the weekly timeframe, we can see that the price is still trading within the supply zone around 21,850. We are still waiting for a strong rejection from this level, which could lead to a short-term price correction in this index.
The potential downside targets are:
21,000, 20,700, 20,200, and 19,150.
The key supply range lies between 21,400 and 22,200.
Additionally, there is a possibility of a liquidity grab or stop-hunt above 22,200 before any real drop begins.
This analysis will be considered invalid if price closes above 22,400 in the next three weeks.
On the fundamental side, there are several macro factors to watch:
Interest Rate Expectations:
Although inflation in the U.S. has cooled compared to last year, the Fed remains cautious. If upcoming CPI or PPI prints show unexpected resilience, the likelihood of rate cuts this year could diminish, pressuring tech-heavy indices like Nasdaq.
Tech Sector Valuations:
Valuations in major tech names — such as NVIDIA, Apple, and Microsoft — have reached historically high multiples. This makes Nasdaq particularly vulnerable to correction, especially if earnings disappoint or growth expectations soften.
Geopolitical Risks:
Ongoing tensions between the U.S. and China over trade and technology, as well as potential instability in the Middle East, could contribute to a risk-off sentiment — further supporting the case for a short-term pullback.
Earnings Season Ahead:
Q2 earnings season is around the corner. Any signs of slowing revenue growth or reduced forward guidance from major tech firms could act as a catalyst for the expected correction.
Please support me with your likes and comments to motivate me to share more analysis with you and share your opinion about the possible trend of this chart with me !
Best Regards , Arman Shaban
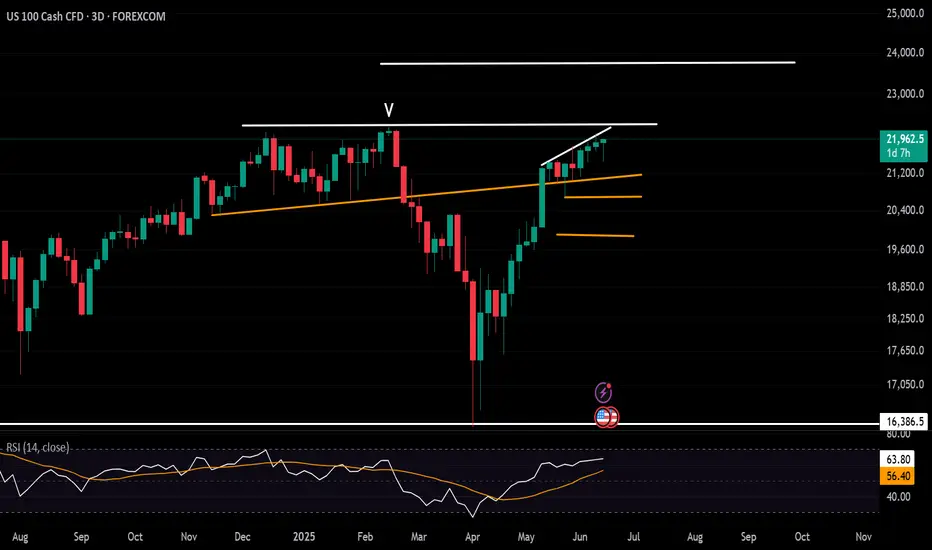
Nasdaq - This starts the next +50% rally!Nasdaq - TVC:NDQ - might break out soon:
(click chart above to see the in depth analysis👆🏻)
Despite the quite harsh correction of about -25% which we saw in the beginning of 2025, the Nasdaq is clearly heading for new all time highs. It sounds almost incredible but if the Nasdaq breaks above the current confluence of resistance, a breakout rally of +50% will follow thereafter.
Levels to watch: $21.500, $33.000
Keep your long term vision!
Philip (BasicTrading)

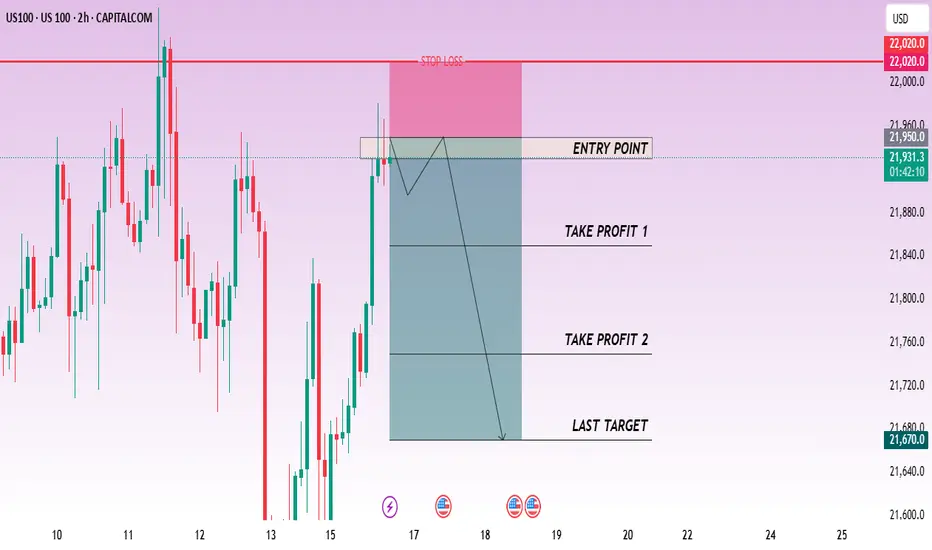
CHECK US100 SIGNAL READ CAPTAINus 100 sell now ✅
entry point (21950) (21930)
TAKE PROFIT 1: (21850)
TAKE PROFIT 2: (21750)
LAST TARGET (21650)
STOP LOSS (22020)
My trade idea on NASDAQ 100 For the coming week I'm seeing NAS100 dropping lower to pull/draw on liquidity below there heading to where we have what looks like a strong POI...
Drop your comment below if you're seeing something totally different from what I'm seeing here and lets have a discussion about our views.
NASDAQ Consolidation: Why Sitting Out Is Sometimes the Best PlayI'm currently monitoring the NASDAQ (US100) closely, and on the 4-hour chart, we can clearly see that the market is in a phase of consolidation 🔍
Yesterday, I was anticipating a bullish breakout, which could have signaled the start of a structure with higher highs and higher lows — something that would have presented a clean long opportunity 📈. However, during the U.S. session, the NAS100 momentum shifted and we instead saw a bearish breakdown, invalidating the previous setup 🚫
As things stand now, there's no clear directional bias on the 4H — just a sideways range with neither bulls nor bears in full control 🤝. This type of environment calls for patience and discipline.
It's worth noting that knowing when not to trade is just as important as knowing when to pull the trigger. Sitting on the sidelines and allowing the market to make the next move — whether that’s a break above or below this consolidation range — is a valid and often wise decision 🧘♂️📊
At the moment, my preference is to remain neutral and let price show its hand before committing to a position.
⚠️ Disclaimer:
This analysis is for educational purposes only and does not constitute financial advice. Always do your own research and apply proper risk management when trading.

Nasdaq Challenges Record HighsNasdaq continues to trade just below a one-month resistance line, which connects consecutive higher highs formed between May and June 2025. This line has capped the index just shy of the 22,000 mark, as price action navigates the push and pull between summer momentum, geopolitical tensions, and economic uncertainty.
To the upside, a decisive break and hold above 22,200 would be a bullish trigger, potentially opening the path toward the 23,700 resistance zone. This level notably aligns with the 0.618 Fibonacci extension, projected from the 2023 low, 2025 high, and 2025 retracement low.
On the downside, risks remain for a deeper correction if the index retraces toward the 21,000–20,600 region. This zone represents the neckline of the December–January double top, and stands as a critical threshold separating a bullish continuation scenario from the possibility of a deeper bearish pullback.
- Razan Hilal, CMT
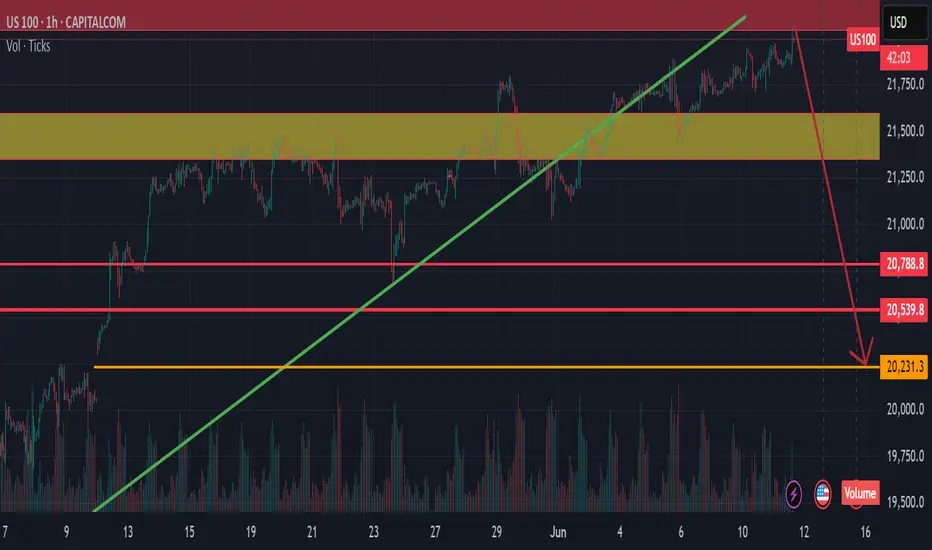
Sell NAS100 market resetSelloff has started at the 22000 zone
Should the GAP at 20231 zone fail to hold we will see more sellers coming in.
Hoping bears win this one.

USTECUSTEC price is now near the resistance zone 21916-22226. If the price cannot break through the 22226 level, it is expected that the price will drop. Consider selling the red zone.
🔥Trading futures, forex, CFDs and stocks carries a risk of loss.
Please consider carefully whether such trading is suitable for you.
>>GooD Luck 😊
❤️ Like and subscribe to never miss a new idea!
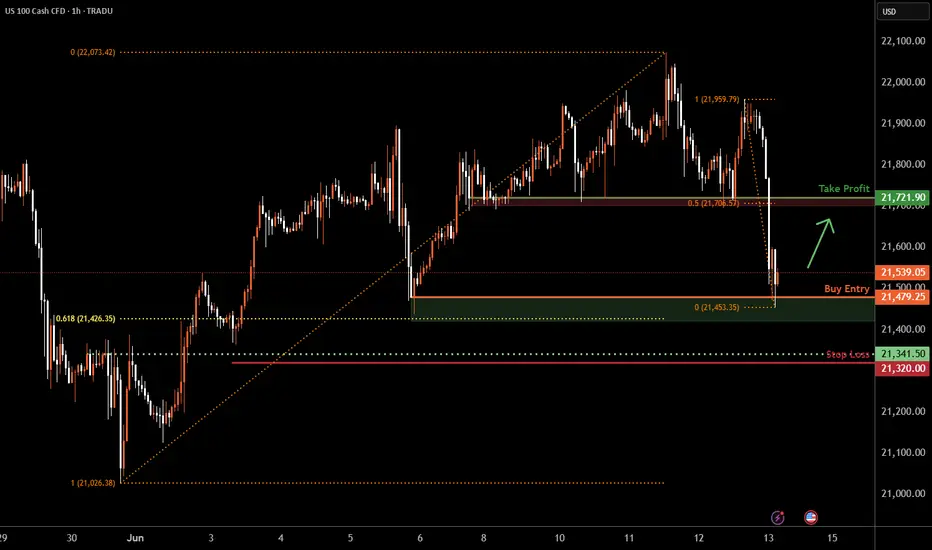
Nasdaq-100 H1 | Swing-low support at 61.8% Fibonacci retracementThe Nasdaq-100 (NAS100) is falling towards a swing-low support and could potentially bounce off this level to climb higher.
Buy entry is at 21,479.25 which is a swing-low support that aligns closely with the 61.8% Fibonacci retracement.
Stop loss is at 21,320.00 which is a level that lies underneath a pullback support.
Take profit is at 21,721.90 which is a pullback resistance that aligns with the 50% Fibonacci retracement.
High Risk Investment Warning
Trading Forex/CFDs on margin carries a high level of risk and may not be suitable for all investors. Leverage can work against you.
Stratos Markets Limited (tradu.com ):
CFDs are complex instruments and come with a high risk of losing money rapidly due to leverage. 63% of retail investor accounts lose money when trading CFDs with this provider. You should consider whether you understand how CFDs work and whether you can afford to take the high risk of losing your money.
Stratos Europe Ltd (tradu.com ):
CFDs are complex instruments and come with a high risk of losing money rapidly due to leverage. 63% of retail investor accounts lose money when trading CFDs with this provider. You should consider whether you understand how CFDs work and whether you can afford to take the high risk of losing your money.
Stratos Global LLC (tradu.com ):
Losses can exceed deposits.
Please be advised that the information presented on TradingView is provided to Tradu (‘Company’, ‘we’) by a third-party provider (‘TFA Global Pte Ltd’). Please be reminded that you are solely responsible for the trading decisions on your account. There is a very high degree of risk involved in trading. Any information and/or content is intended entirely for research, educational and informational purposes only and does not constitute investment or consultation advice or investment strategy. The information is not tailored to the investment needs of any specific person and therefore does not involve a consideration of any of the investment objectives, financial situation or needs of any viewer that may receive it. Kindly also note that past performance is not a reliable indicator of future results. Actual results may differ materially from those anticipated in forward-looking or past performance statements. We assume no liability as to the accuracy or completeness of any of the information and/or content provided herein and the Company cannot be held responsible for any omission, mistake nor for any loss or damage including without limitation to any loss of profit which may arise from reliance on any information supplied by TFA Global Pte Ltd.
The speaker(s) is neither an employee, agent nor representative of Tradu and is therefore acting independently. The opinions given are their own, constitute general market commentary, and do not constitute the opinion or advice of Tradu or any form of personal or investment advice. Tradu neither endorses nor guarantees offerings of third-party speakers, nor is Tradu responsible for the content, veracity or opinions of third-party speakers, presenters or participants.
Nasdaq 100 Trade idea for the day and bias.This is what I'm expecting Nas100 to do today looking at the higher timeframe structure.

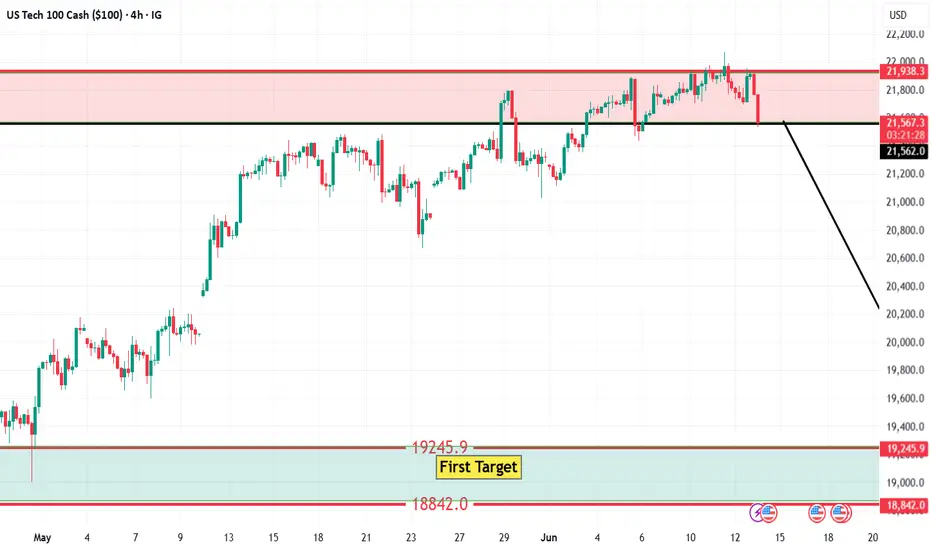
#NASDAQ (4H)"NASDAQ futures (4H) will dropped from 21,938.3 to 21,562.0 — one of the key indicators from the specified zone."
First Target Zone 19,245 To 18,842
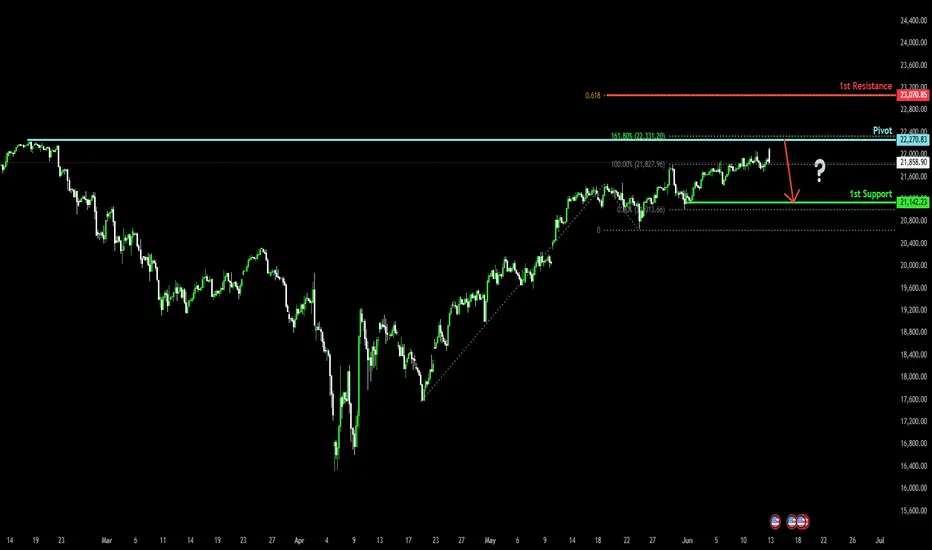
Bearish reversal off pullback resistance?USTEC is rising toward the pivot, which serves as a pullback resistance. A reversal from this level could indicate a double top pattern, potentially leading to a price drop to the 1st support.
Pivot: 22,270.83
1st Support: 21,142.23
1st Resistance: 23,070.85
Risk Warning:
Trading Forex and CFDs carries a high level of risk to your capital and you should only trade with money you can afford to lose. Trading Forex and CFDs may not be suitable for all investors, so please ensure that you fully understand the risks involved and seek independent advice if necessary.
Disclaimer:
The above opinions given constitute general market commentary, and do not constitute the opinion or advice of IC Markets or any form of personal or investment advice.
Any opinions, news, research, analyses, prices, other information, or links to third-party sites contained on this website are provided on an "as-is" basis, are intended only to be informative, is not an advice nor a recommendation, nor research, or a record of our trading prices, or an offer of, or solicitation for a transaction in any financial instrument and thus should not be treated as such. The information provided does not involve any specific investment objectives, financial situation and needs of any specific person who may receive it. Please be aware, that past performance is not a reliable indicator of future performance and/or results. Past Performance or Forward-looking scenarios based upon the reasonable beliefs of the third-party provider are not a guarantee of future performance. Actual results may differ materially from those anticipated in forward-looking or past performance statements. IC Markets makes no representation or warranty and assumes no liability as to the accuracy or completeness of the information provided, nor any loss arising from any investment based on a recommendation, forecast or any information supplied by any third-party.
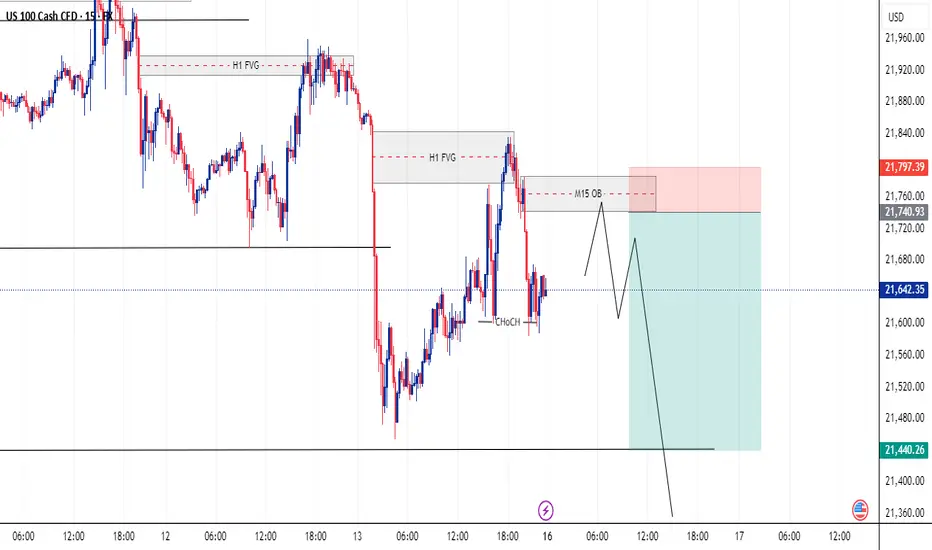
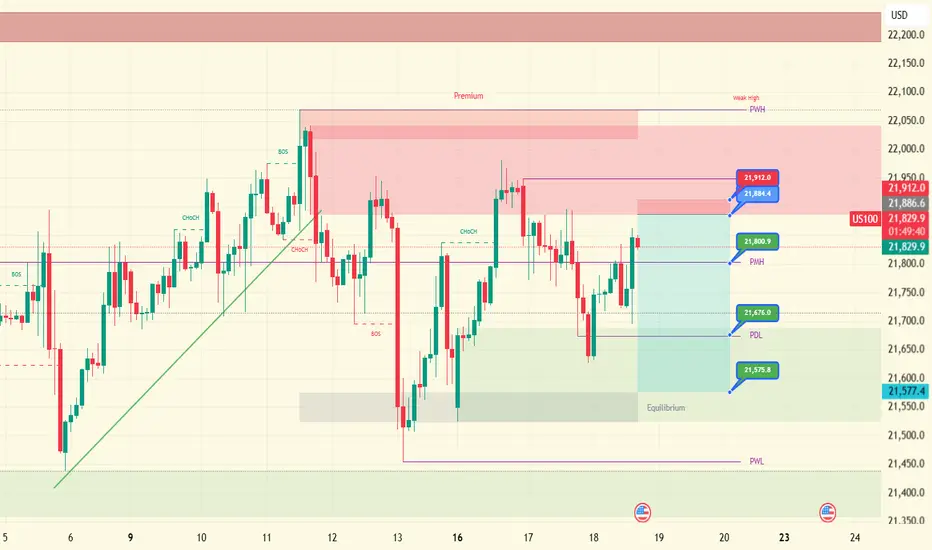
FOMC short: waiting for this short entry to get activated.1. Entry ~21,884.4
Why here? Price has rallied into that red “supply” zone (fair-value gap + bearish order block), then chopped down and back up to retest its lower edge. That level also coincides with the broken swing pivot (Change-of-Character from bull→bear). We short the retest, expecting supply to push price lower.
2. Stop-loss 21,912.0
Why there? Just above the top of the supply zone/weak high. If price climbs above 21,912, it’s cleared the zone and negated the bearish bias—so we get out.
3. Take-Profits
TP1 at 21,800.9 (the old swing-high turned support, labeled “PMH”)
First support zone—locks in quick gains and covers your risk.
TP2 at 21,675.0 (the previous day’s low, labeled “PDL”)
A deeper support area where sellers will likely pause or flip to buyers.
(Optional TP3 at 21,575.8 if you want a final scalp into the gray “equilibrium”/demand zone.)
NAS100 is about experience a big fallfrom the chart, you can find out that nas100 is about to be bearish...
Reason;
1, Double top pattern
2, Ascending triangle

US100 / NASDAQ TodayUS100 / NASDAQ Today is still bearish
My SSM Reversal Pattern is comming.
This is just my view of course

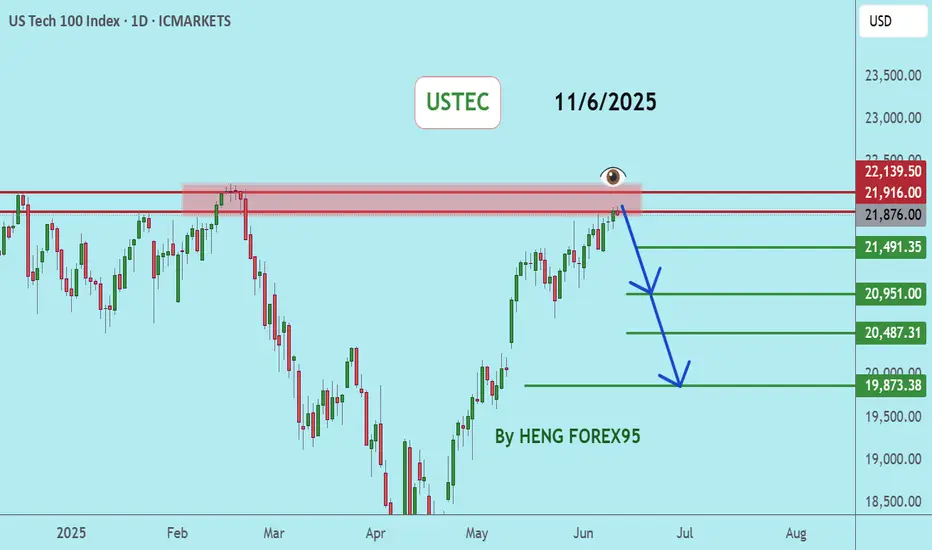
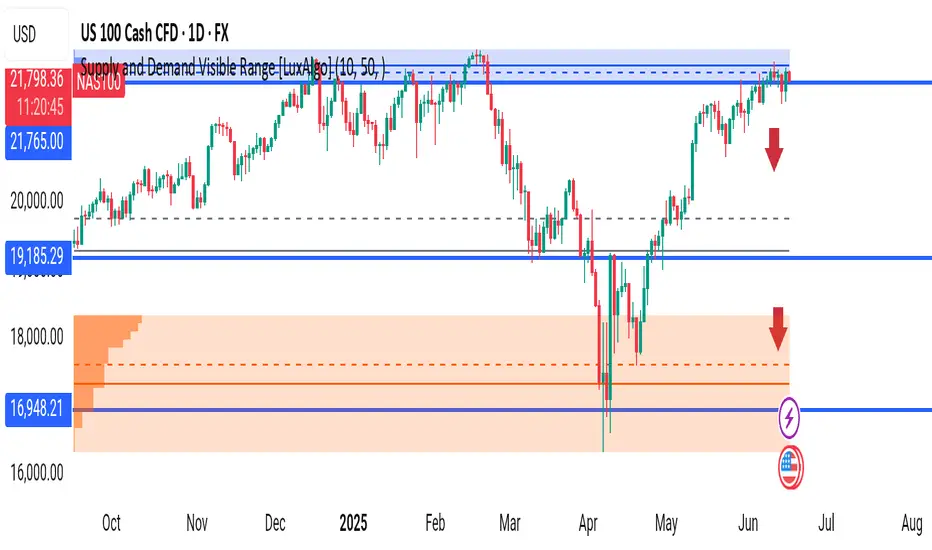
NAS100 – Major Rejection from Weekly Supply Zone!The NASDAQ 100 is showing clear signs of weakness after tagging the strong supply zone near 21,927, an area previously respected as resistance. The market printed a bearish daily close after failing to break above, forming a potential double top pattern just below key resistance.
🔵 Key Zones to Watch:
🔼 Supply Zone: 21,765 – 21,927 (Strong institutional selling pressure)
🔽 Next Target 1: 19,185 (mid-structure support)
🔽 Next Target 2: 16,948 (high-volume demand zone)
📉 Bearish Scenario: If price continues to reject the supply area, we expect momentum to shift bearish targeting the 19,185 zone and possibly 16,948 if major U.S. economic data disappoints.
⚡ Why This Setup Matters:
Market is overstretched, showing distribution signs
Risk-off sentiment growing ahead of major economic reports
Volume profile confirms resistance overhead
🎯 Trading Plan:
Monitor for confirmation (bearish engulfing, breakdown of recent lows)
Short bias below 21,765
Watch for reaction at 19,185 and strong buy interest at 16,948 zone
📊 Let’s hear your thoughts: Will NAS100 hold or is a deeper correction coming? Comment below! ⬇️
#NASDAQ #US100 #Indices #BearishReversal #SupplyDemand #SmartMoney #PriceAction #TradingSetup #TradingView #LuxAlgo
CHECK US100 SIGNAL READ CAPTAINus100 sell now ✅
entry point (21650) (21620)
TAKE PROFIT 1: (21550)
TAKE PROFIT 2: (21400)
LAST TARGET (21300)
STOP LOSS (21750)

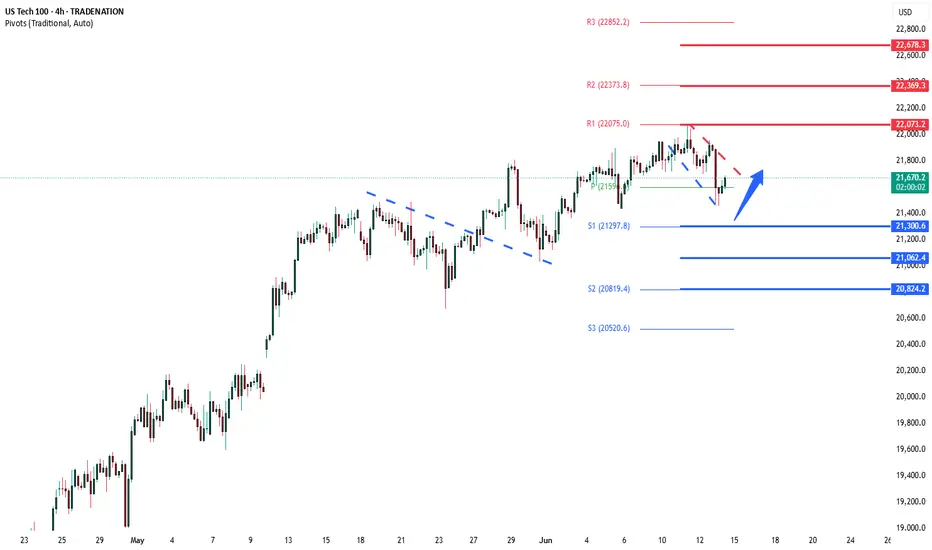
NSDQ100 uptrend consolidation supported at 21300Markets Rattled After Israel Strikes Iran
Israel launched major airstrikes on Iran, targeting nuclear and missile sites, as well as top military leaders. The move sharply escalates tensions in the Middle East and came despite warnings from former President Donald Trump, who was told of the attack only shortly beforehand. He later warned Iran that future strikes would be “even more brutal” if no deal is made.
Market Reaction:
Oil jumped up to 13% on fears of supply disruptions.
Gold climbed as investors rushed to safe-haven assets.
Stock futures and crypto fell on rising geopolitical risk.
The U.S. dollar dipped, then rebounded, as its role as a safe-haven asset came into focus.
Other Key Updates:
Trump wins court backing to keep troops in Los Angeles amid ongoing protests. A hearing is set for Tuesday.
Meta invests billions in Scale AI, bringing on its CEO to boost efforts in building artificial general intelligence. Meta is aggressively hiring top AI talent from firms like Google.
For Traders:
Watch oil and gold closely for continued volatility.
Safe-haven flows could drive further USD and gold moves.
Meta’s AI push may influence tech sector sentiment.
Key Support and Resistance Levels
Resistance Level 1: 22070
Resistance Level 2: 22370
Resistance Level 3: 22680
Support Level 1: 21300
Support Level 2: 21060
Support Level 3: 20820
This communication is for informational purposes only and should not be viewed as any form of recommendation as to a particular course of action or as investment advice. It is not intended as an offer or solicitation for the purchase or sale of any financial instrument or as an official confirmation of any transaction. Opinions, estimates and assumptions expressed herein are made as of the date of this communication and are subject to change without notice. This communication has been prepared based upon information, including market prices, data and other information, believed to be reliable; however, Trade Nation does not warrant its completeness or accuracy. All market prices and market data contained in or attached to this communication are indicative and subject to change without notice.