US100Correlation Between US100 (Nasdaq 100), 10-Year Bond Yield, and Bond Prices
1. Relationship Between 10-Year Treasury Bond Yield and Bond Prices
Inverse Relationship:
Bond prices and yields move inversely. When the 10-year Treasury yield rises, bond prices fall, and vice versa. This is because the fixed coupon payments become less attractive when yields increase, causing existing bond prices to drop to offer comparable yields to new issues.
Current Data (June 13, 2025):
10-Year Treasury yield is around 4.40%, with the bond price near 98.81 (below par), reflecting recent yield increases.
Term Premium:
The term premium on the 10-year Treasury has risen sharply since early April 2025, reaching the highest level in over a decade. This premium compensates investors for risks that short-term yields may not evolve as expected, keeping long-term yields elevated and bond prices suppressed.
2. US100 (Nasdaq 100) and 10-Year Treasury Yield Correlation
Negative Correlation Generally Observed:
The Nasdaq 100 (US100), a tech-heavy equity index, often shows a negative correlation with 10-year Treasury yields. When yields rise, borrowing costs increase, discount rates for future earnings rise, and equities—especially growth stocks—tend to decline. Conversely, falling yields often boost equities.
Recent Trends:
In 2025, rising yields have put pressure on equities, including the Nasdaq 100, as investors demand higher returns from riskier assets. However, periods of yield stabilization or decline can support equity rallies.
Risk Sentiment:
The correlation can vary with market sentiment; during risk-off episodes, both equities and bond yields may fall as investors flock to safety.
3. US100 and Bond Prices
Indirect Relationship via Yields:
Since bond prices move inversely to yields, and yields often move inversely to equities, bond prices and equities like US100 often show a positive correlation in risk-off environments (both falling) and a negative correlation in risk-on environments (equities rising, bond prices falling).
Safe-Haven Demand:
In times of market stress, investors may sell equities and buy bonds, pushing bond prices up and yields down, while equities like US100 decline.
4. Yield Curve and Market Implications
The US yield curve has steepened recently, with the 10-year yield (~4.40%) above the 2-year yield (~3.95%), reflecting expectations of higher long-term inflation and growth risks.
A steepening curve can signal improving growth prospects but also higher financing costs, which can weigh on tech stocks in the US100.
Conclusion
The 10-year Treasury yield and bond prices move inversely, with recent yield increases pushing bond prices below par.
The Nasdaq 100 (US100) typically moves inversely to 10-year yields, as higher yields raise borrowing costs and discount rates, pressuring growth stocks.
The relationship between US100 and bond prices depends on market risk sentiment: in risk-off periods, bond prices rise while equities fall; in risk-on periods, the opposite occurs.
The current steepening yield curve and elevated term premium suggest ongoing volatility and cautious investor positioning affecting both bonds and equities.
#NAS100 #DOLLAR
NDQ trade ideas
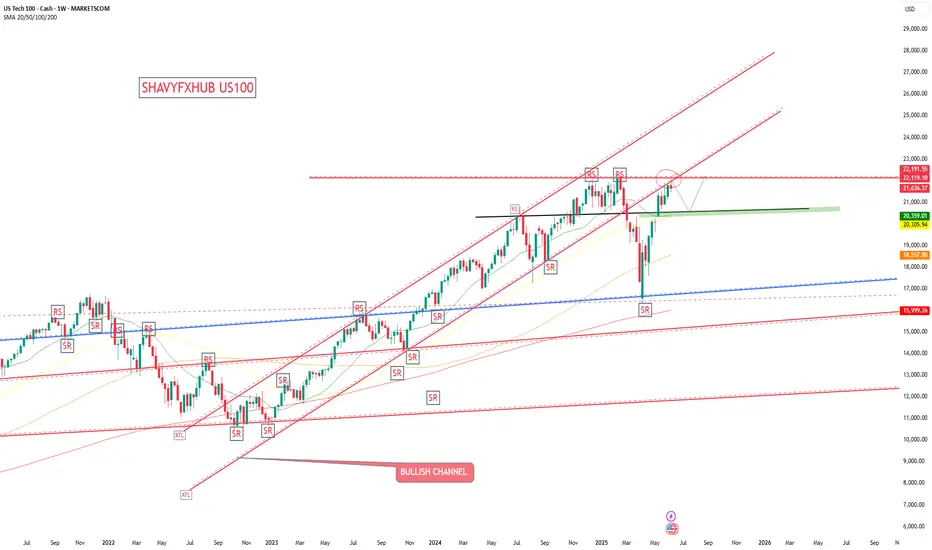
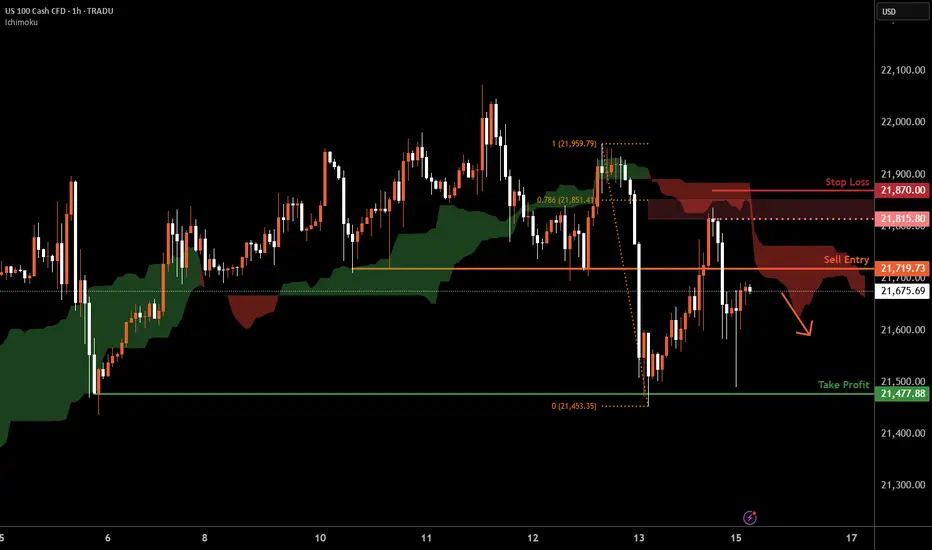
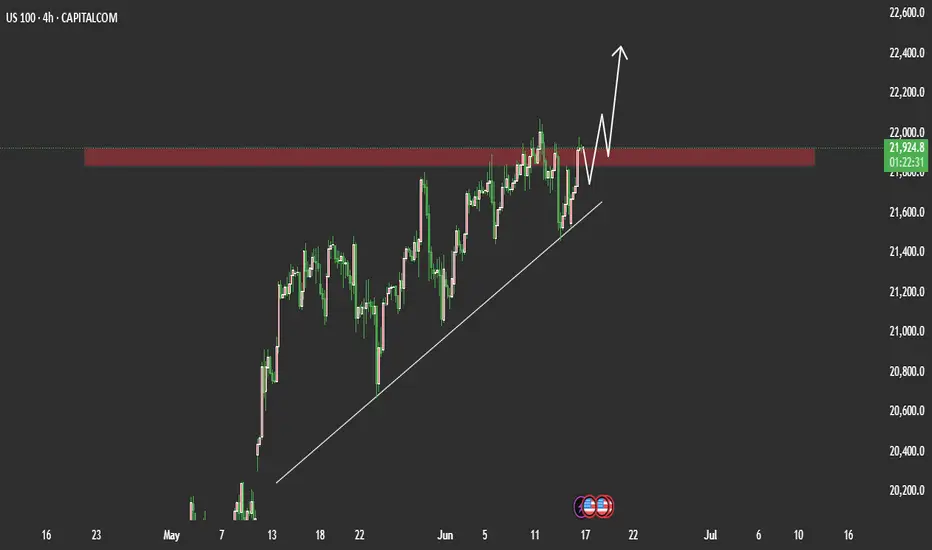
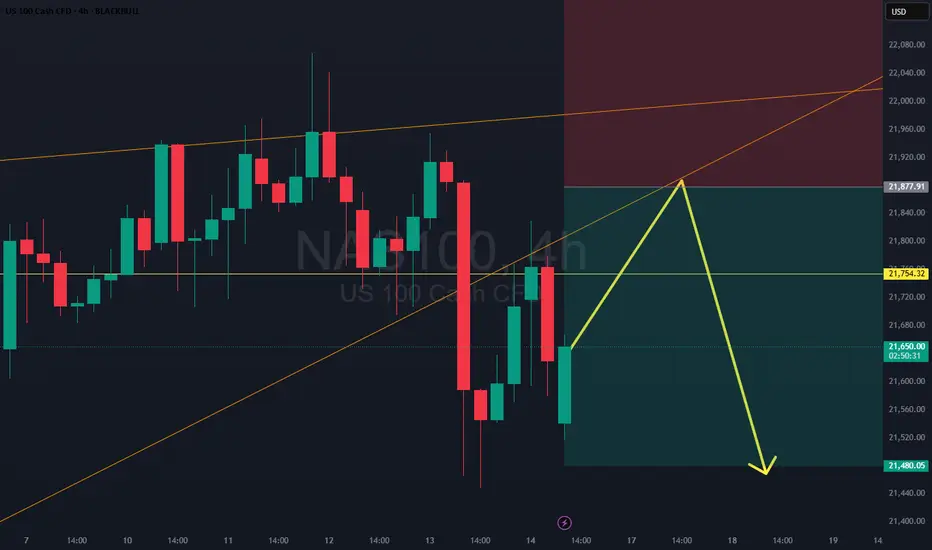
Nasdaq-100 H1 | Approaching a pullback resistanceThe Nasdaq-100 (NAS100) is rising towards a pullback resistance and could potentially reverse off this level to drop lower.
Sell entry is at 21,719.73 which is a pullback resistance.
Stop loss is at 21,870.00 which is a level that sits above the 78.6% Fibonacci retracement and a swing-high resistance.
Take profit is at 21,477.88 which is a multi-swing-low support.
High Risk Investment Warning
Trading Forex/CFDs on margin carries a high level of risk and may not be suitable for all investors. Leverage can work against you.
Stratos Markets Limited (tradu.com ):
CFDs are complex instruments and come with a high risk of losing money rapidly due to leverage. 63% of retail investor accounts lose money when trading CFDs with this provider. You should consider whether you understand how CFDs work and whether you can afford to take the high risk of losing your money.
Stratos Europe Ltd (tradu.com ):
CFDs are complex instruments and come with a high risk of losing money rapidly due to leverage. 63% of retail investor accounts lose money when trading CFDs with this provider. You should consider whether you understand how CFDs work and whether you can afford to take the high risk of losing your money.
Stratos Global LLC (tradu.com ):
Losses can exceed deposits.
Please be advised that the information presented on TradingView is provided to Tradu (‘Company’, ‘we’) by a third-party provider (‘TFA Global Pte Ltd’). Please be reminded that you are solely responsible for the trading decisions on your account. There is a very high degree of risk involved in trading. Any information and/or content is intended entirely for research, educational and informational purposes only and does not constitute investment or consultation advice or investment strategy. The information is not tailored to the investment needs of any specific person and therefore does not involve a consideration of any of the investment objectives, financial situation or needs of any viewer that may receive it. Kindly also note that past performance is not a reliable indicator of future results. Actual results may differ materially from those anticipated in forward-looking or past performance statements. We assume no liability as to the accuracy or completeness of any of the information and/or content provided herein and the Company cannot be held responsible for any omission, mistake nor for any loss or damage including without limitation to any loss of profit which may arise from reliance on any information supplied by TFA Global Pte Ltd.
The speaker(s) is neither an employee, agent nor representative of Tradu and is therefore acting independently. The opinions given are their own, constitute general market commentary, and do not constitute the opinion or advice of Tradu or any form of personal or investment advice. Tradu neither endorses nor guarantees offerings of third-party speakers, nor is Tradu responsible for the content, veracity or opinions of third-party speakers, presenters or participants.
NASDAQ 100 Long 21,900Target to the upside 21,900. We initially highlighted NASDAQ will reach 22,000 then see a bearish turn. Refer to linked Idea.
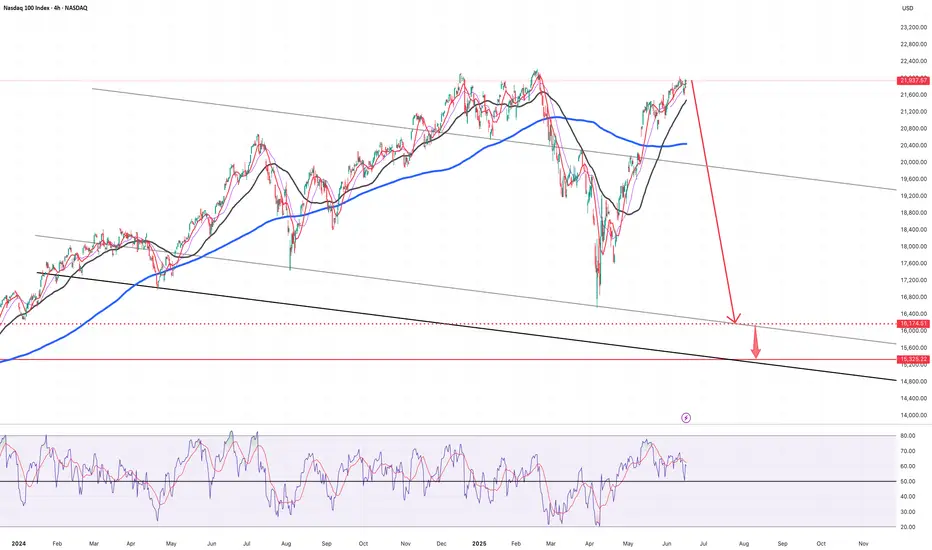
NAS100USDNAS100USD It’s still downtrend
If break support 19963 below then It’s going down till 16174, (extention is 15325)
The stock market is highly volatile. Please be very careful with your investments.
US100 is Currently trading in a clear bullish zoneUS100 Technical & Fundamental Outlook (4H Timeframe)
The US100 is currently trading in a clear bullish zone on the 4-hour chart. Despite underlying pressure due to cautious market sentiment, the index shows signs of resilience Geopolitical tensions in the Middle East persist but have yet to spark panic selling. Market uncertainty remains high ahead of this week's anticipated Federal Reserve outlook.
Technical View:
The index is showing strength, and a 4H candle close above the 22,000 level would be a significant bullish signal. A confirmed breakout above this level opens the door to the next potential target at 22,500
If you like this idea if find more better analysis from our team we need support from You Guys.
NAS100...Ever The Bullish Instrument (Part 40)Since creating the Lowest point of 2025 (monthly HL) on 4/6/2025 @7:10 pm...The low for the NAS100 has closed higher every single week for the past 10 weeks.
This week will not be any different as the market heads continues to head back to the ATH and beyond.
As you look at the charts...the blue lines are my weekly boundaries and the visual is using the H4 chart so as to show you the progression over the last 10 weeks...absolutely no LH to LL trends are seen as continuous.
Do not get fooled into thinking that this market is in a downtrend.
Any sells on the NAS100 are only temporary retracements in order the make the HL on the larger timeframe.
As always, I stand by my stance that the NAS100 will continue to make HL's to HH's guaranteed.
Have a great trading week...
#oneauberstrategy

US100Correlation Between US100 (Nasdaq 100), 10-Year Bond Yield, and Bond Prices
1. Relationship Between 10-Year Treasury Bond Yield and Bond Prices
Inverse Relationship:
Bond prices and yields move inversely. When the 10-year Treasury yield rises, bond prices fall, and vice versa. This is because the fixed coupon payments become less attractive when yields increase, causing existing bond prices to drop to offer comparable yields to new issues.
Current Data (June 13, 2025):
10-Year Treasury yield is around 4.40%, with the bond price near 98.81 (below par), reflecting recent yield increases.
Term Premium:
The term premium on the 10-year Treasury has risen sharply since early April 2025, reaching the highest level in over a decade. This premium compensates investors for risks that short-term yields may not evolve as expected, keeping long-term yields elevated and bond prices suppressed.
2. US100 (Nasdaq 100) and 10-Year Treasury Yield Correlation
Negative Correlation Generally Observed:
The Nasdaq 100 (US100), a tech-heavy equity index, often shows a negative correlation with 10-year Treasury yields. When yields rise, borrowing costs increase, discount rates for future earnings rise, and equities—especially growth stocks—tend to decline. Conversely, falling yields often boost equities.
Recent Trends:
In 2025, rising yields have put pressure on equities, including the Nasdaq 100, as investors demand higher returns from riskier assets. However, periods of yield stabilization or decline can support equity rallies.
Risk Sentiment:
The correlation can vary with market sentiment; during risk-off episodes, both equities and bond yields may fall as investors flock to safety.
3. US100 and Bond Prices
Indirect Relationship via Yields:
Since bond prices move inversely to yields, and yields often move inversely to equities, bond prices and equities like US100 often show a positive correlation in risk-off environments (both falling) and a negative correlation in risk-on environments (equities rising, bond prices falling).
Safe-Haven Demand:
In times of market stress, investors may sell equities and buy bonds, pushing bond prices up and yields down, while equities like US100 decline.
4. Yield Curve and Market Implications
The US yield curve has steepened recently, with the 10-year yield (~4.40%) above the 2-year yield (~3.95%), reflecting expectations of higher long-term inflation and growth risks.
A steepening curve can signal improving growth prospects but also higher financing costs, which can weigh on tech stocks in the US100.
Conclusion
The 10-year Treasury yield and bond prices move inversely, with recent yield increases pushing bond prices below par.
The Nasdaq 100 (US100) typically moves inversely to 10-year yields, as higher yields raise borrowing costs and discount rates, pressuring growth stocks.
The relationship between US100 and bond prices depends on market risk sentiment: in risk-off periods, bond prices rise while equities fall; in risk-on periods, the opposite occurs.
The current steepening yield curve and elevated term premium suggest ongoing volatility and cautious investor positioning affecting both bonds and equities.
#NAS100 #DOLLAR

NASDAQ ShortLooking for the short on Nasdaq been trading this long and short through out the week. Check the linked publications. Shouted out 22,000 before seeing the short.

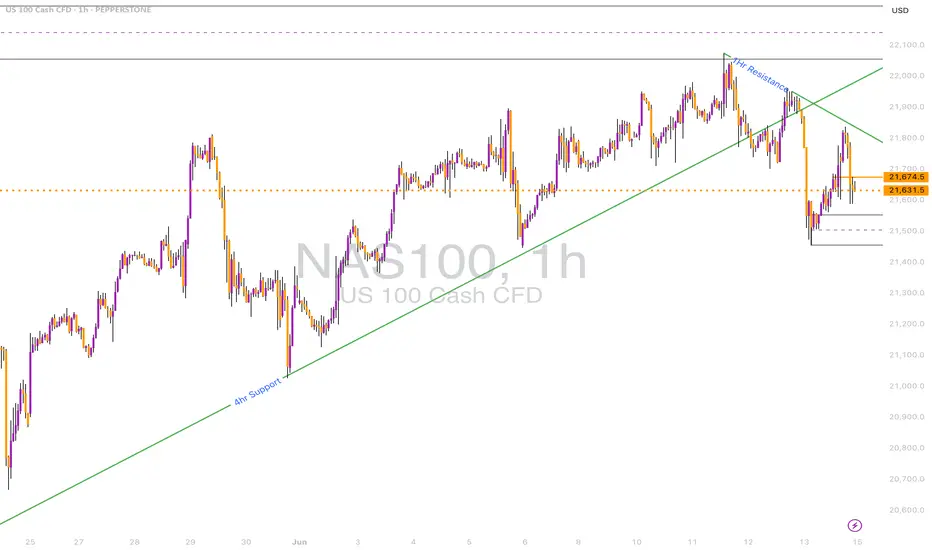
NASDAQ Pullback or Reversal? Watching 4H Support ZonePrice is reacting from the 1D resistance zone around 21,950 and now hovering near a 4H support zone at ~21,520.
• 1D Chart: Long wick rejection from resistance.
• 4H Chart: Break of rising wedge and rejection from 1H trendline.
• 1H & 23m Chart: Clear bearish order block formed. Price consolidating under broken structure.
Key Zones:
• Support: 21,500 / 21,325
• Resistance: 21,900 / 22,000
Bias: Bearish below 21,750. Retest of support expected.
NSDQ100 Geopolitics, Fed & Rates Outlook Geopolitics & Market Sentiment
Iran-Israel conflict enters its sixth day, raising fears of broader escalation.
Speculation is building that Donald Trump may authorize the use of the Massive Ordnance Penetrator (bunker-buster bomb) to target Iran’s nuclear facilities.
Trump is also meeting with Pakistan’s army chief today for talks on Iran, adding to geopolitical uncertainty.
So far, Iran’s oil infrastructure remains intact, and Hezbollah has stayed out of the conflict, limiting immediate economic fallout.
Fed & Rates Outlook
The Federal Reserve is expected to hold rates steady today as it waits for clearer economic signals amid ongoing Trump policy shifts.
Trump is pressuring the Fed, now arguing for lower rates to cut US debt costs.
Traders are building record positions betting on a dovish Fed shift after Powell's term ends in May 2026.
Market Implications for NSDQ100
Nasdaq futures are mildly positive, supported by:
Stability in tech earnings outlook
Expectations of Fed staying on hold, with a possible dovish bias emerging
However, Middle East tensions remain a risk. Any strike on oil infrastructure or major military escalation could:
Trigger a risk-off move
Push oil prices higher, raising inflation concerns
Weigh on tech stocks sensitive to rate outlooks and sentiment
Key Focus for Nasdaq Traders Today:
Fed decision and Powell’s tone (especially on inflation and growth risks)
Headlines from the Middle East
Oil price action near the five-month high (WTI around $73.50–$74)
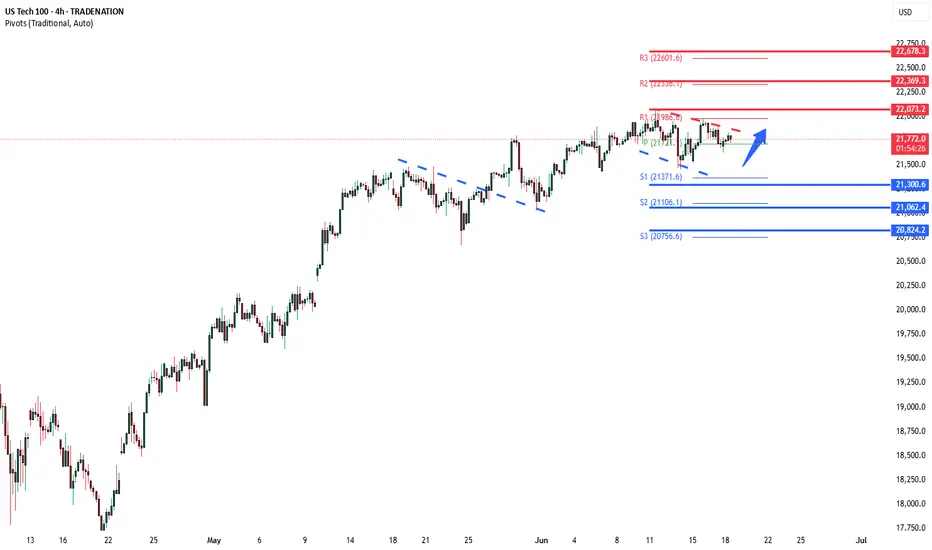
Resistance Level 1: 22070
Resistance Level 2: 22370
Resistance Level 3: 22780
Support Level 1: 21300
Support Level 2: 21060
Support Level 3: 20820
This communication is for informational purposes only and should not be viewed as any form of recommendation as to a particular course of action or as investment advice. It is not intended as an offer or solicitation for the purchase or sale of any financial instrument or as an official confirmation of any transaction. Opinions, estimates and assumptions expressed herein are made as of the date of this communication and are subject to change without notice. This communication has been prepared based upon information, including market prices, data and other information, believed to be reliable; however, Trade Nation does not warrant its completeness or accuracy. All market prices and market data contained in or attached to this communication are indicative and subject to change without notice.

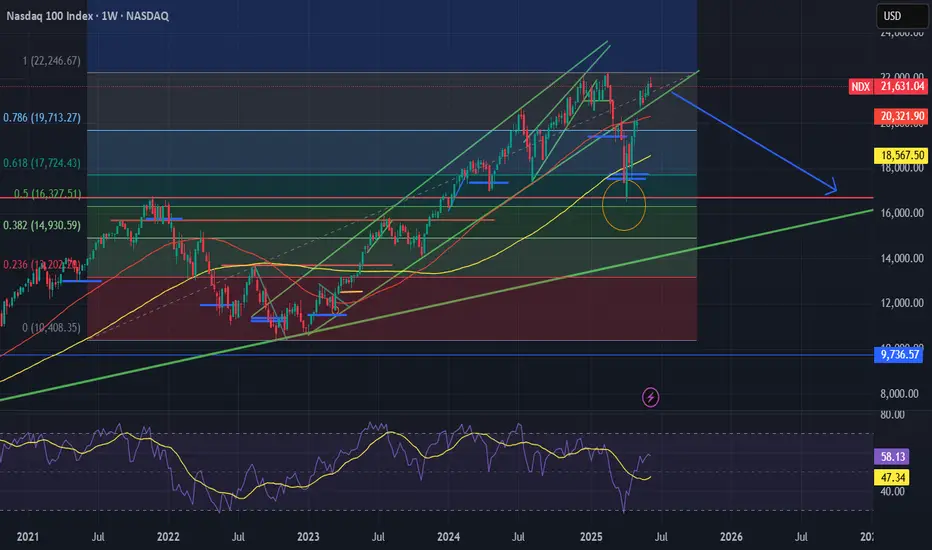
NASDAQ PRICED IN GOLD FORMING A MASSIVE TOP.NASDAQ PRICED IN GOLD FORMING A MASSIVE TOP.
If history rhymes… tech could bleed value while Gold continues to shine.
Final breakdown nearing, where you would expect the Nasdaq to fall as this gets confirmed.

long trade in NQ100 Simple analytics and quant analyticsDaily time frame we have area of accumulation .
4h TF realty market structure bullish .
30 TF we have multi area of resistance to support, Its mean
a signal of market next time go up .
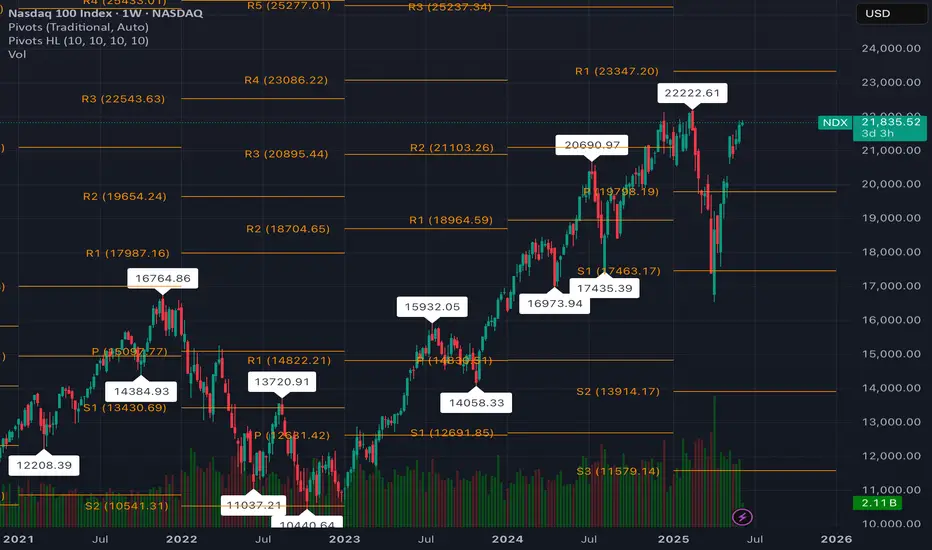
Nasdaq will reach 25'000 still no body see it?Current level: 21,876
Previous ATH: 22,222.61
Next stop? Well… if you ask the pivot levels they're whispering "23347.20, baby."
What we’re looking at is not just a strong recovery it’s a market that refuses to take a breather. With weekly candles forming higher lows and pivot zones behaving like polite suggestions rather than resistance, it’s hard not to think the index is gearing up for a proper breakout.
Sure, skeptics will say we’re overextended. Bears will point to the volume spikes and say “exhaustion.” But momentum? She's dancing in stilettos on top of R3 like it's a catwalk.
Now, here's the fun part:
If this rhythm keeps up and if inflation, rates, and the Fed behave like decent background characters then 25,000 by the end of the year isn’t just possible. It's that slightly overconfident friend at the party who's already halfway into a celebratory toast.
So… who dares to trust the trend?
Because let’s be honest: being early is painful, being late is expensive but being in the trend? That’s just good business.
📈 Trade safe, manage risk, and don’t fight the trend. Unless you're into that kind of thrill.
#tradehills #Pscarfo
Wait for the NAS100 to break the parallel lines before shortingPEPPERSTONE:NAS100 - Need the price on the 1H TF to break down the parallel lines before taking any short position. After than we could see the index going to 21,450. But till then hold your shorts.
NASDAQ The bearish bias is supported by the COT data showing the majority of non-commercial traders are increasing their short positions. Sell/Short: Consider entering a short position at current levels, with a stop above the resistance zone (preferably just above the recent swing high).
Triple Top Trouble? NAS100 May Be Losing SteamThe NAS100 has formed a potential triple top, and key trendlines are starting to break to the downside. This could signal a short-term correction before bulls attempt another push for new highs. A temporary drop might offer a better long setup if momentum resets.
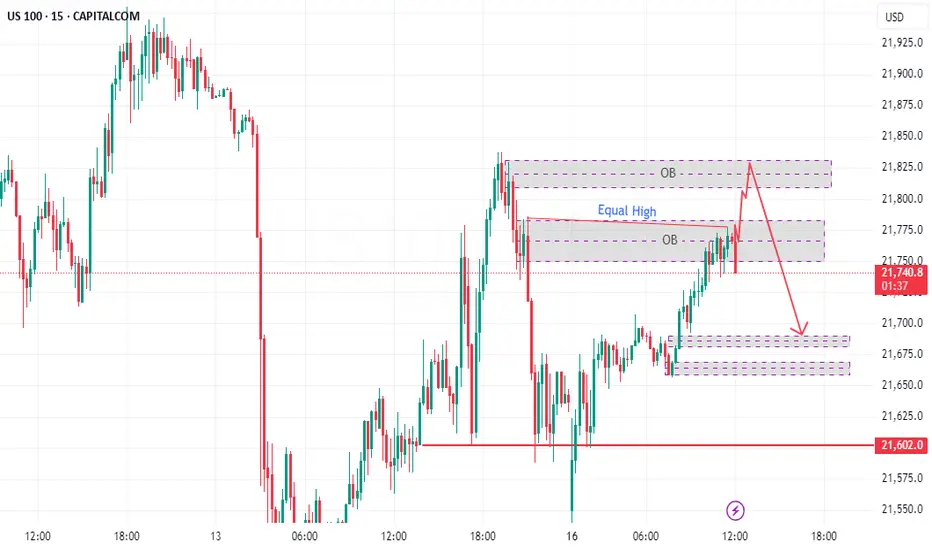
Sell US100 Now US 100 made the equal highs and wait till reach the OB and rejection confirmed then can sell the SL is above the OB and the TP is 21690 and second TP is 21660
Macro enviornment effects on equities - Flat to Bearish The current macro-geopolitical environment presents several quantifiable bearish pressures on the Nasdaq. Housing markets are showing real signs of deterioration, with home listings in Florida and other regions down 15–20% from peak prices, and many individual properties seeing $100K+ price cuts—foreshadowing a broader 24–30% drawdown in real estate that could significantly erode consumer wealth and confidence. Labor market weakness is emerging beneath the surface, with rising layoffs in tech and new graduates facing difficulty securing jobs, even as the Fed is projected to cut rates twice by year-end. While disinflation supports policy easing, it is being outweighed by the drag from labor and housing stress. Geopolitically, the escalation risk in the Iran–Israel conflict introduces volatility and commodity price spikes, while the Ukraine war, though stagnating, remains unresolved. U.S. foreign policy appears increasingly erratic, adding further uncertainty premium. These elements combine to create a risk environment where upside in the Nasdaq is capped, and downside exposure remains
Flat to Bearish for the next 12 months, drawdown up to 25% to December 2021 high on NDX and support line during recent tariff crashes. long sustained drawdown would sustain for a while if we get into situations like housing collapse, or entering into a war, even indirectly like we did for Ukraine.
significant. NASDAQ:NDX NASDAQ:NDX NASDAQ:QQQ AMEX:SPY
NDX its a short for like month?this is only an Idea !
due to many fvg's and gaps this is more likely to happen
you can see the long 30d / 40d target on chart


NAS - TIME TO MAKE ACTIVE TRADER ROOM GREATER AGAIN!Team, last week we got a good entry on both DOW/US30 AND NAS100/TEC100
Yes, i do know about the situation with ISRAEL AND IRAN.
This will drag on for at least 3-6 months for the solutions
however, I expect the cease fire should be stop within next week as President Trump's is negotiation with Iran
There are two strategy to trade for the NAS- NASTY market
Rule: make sure you calculate how much position and volume you are taking risk on the trade. Every time you enter, ensure you are understood each trade risk.
As I always do.
The last 90 days we have not losing a single trade - check my new video release soon.
OK, lets get back to the trade set up again
entry small volume at market now.
If market falling down during US session, buy more at the second setting
However, I expect the 1st setting likely to recover soon.
Jump on board now.
See you to the moon

NQ Buy setupi personally like this demand zone with hanging swing lows just above it. Looking to buy off this zone and target 3R taking partials on the way. Can also wait for lower timeframe confirmation.
