NYSENew York Stock Exchange .. 8000 securities listed here . In some ways , this is as important to keep track of as the S&P500 or spy.
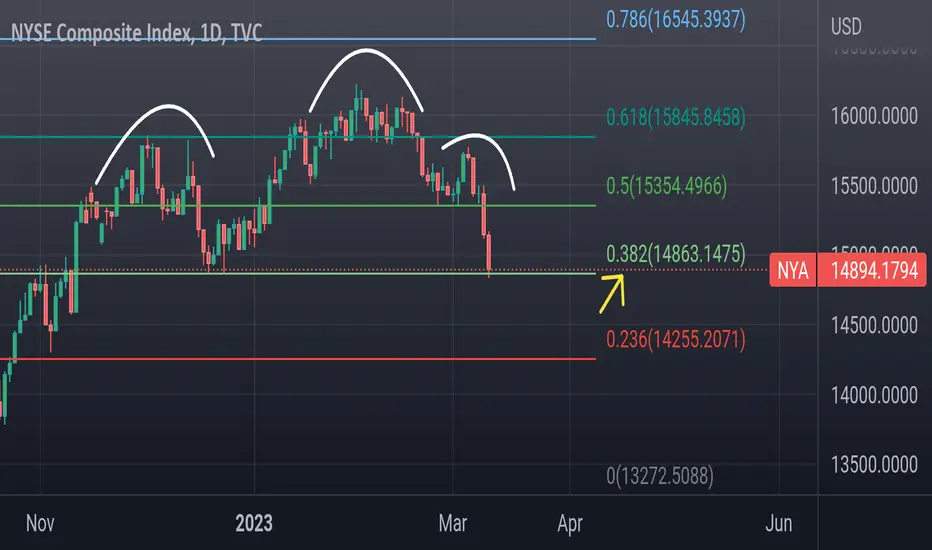
If you look at the link in my previous you'll see we've fell outside a huge rising similar to that of XLF. Now a H&S is showing right at .382 fib.
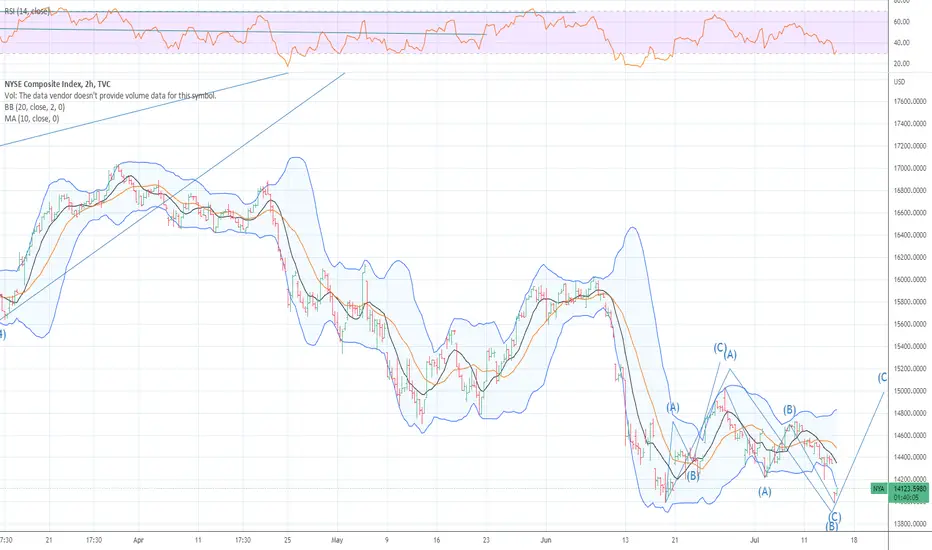
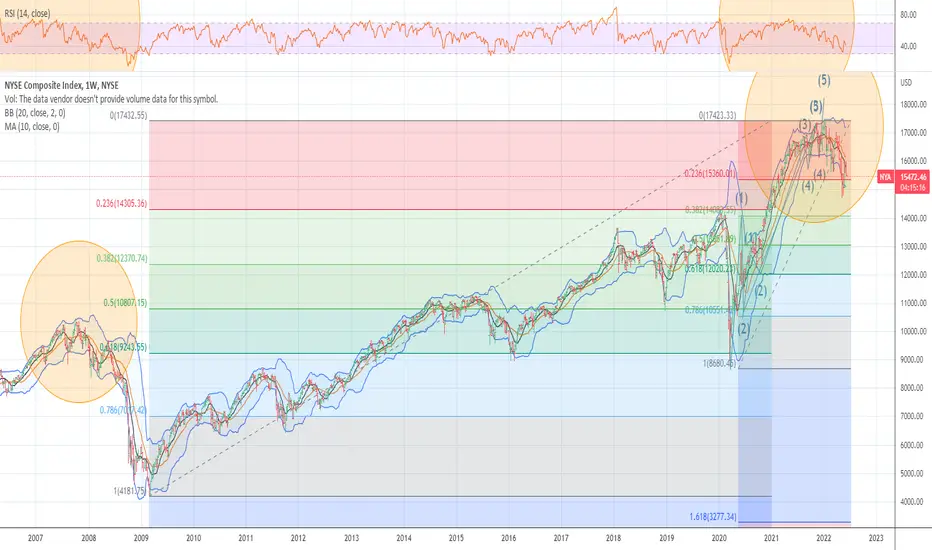
We closed Friday outside our Daily Bollinger band and we are at our bottom levels for the RSI here. What I mean by "Bottom levels" is , The NYSE closed Friday with a 28 RSI handle; even at OCT and DEC lows we rarely cracked the low 20's.
If we break below 14,800 there's no support until weekly 200
With that being said I think we may bounce here at .382 fib with a possible upside of 15,200.
I
NYA trade ideas
NYSE UPDATED SEE THE FRACTAL NOW The chart posted has never been altered . We are now in the LAST WAVE UP . in this BEAR MARKET COUNTER TREND RALLY. I will maintain that the cycle low due week of OCT 4th to the 20 focus the 10th target 3511/3490 WAS and IS the FIRST LEG DOWN. We are now coming to the end I am 75 % net long and the min target to peak is above 4222 I have ideal target 4308/4311 But feel 4255 plus or minus 6 could be the End The only alt is the outside target 4344 . I give this a 15% odds . I do feel that this is the HIGH of the year . I will be moving to a rare 80 % to 100 % short from 75 % net long. For most of you the only safe way to trigger this trade is to see the rally to above 4222 unfold over the next 72 hours. and place a SELL SHORT ON A STOP at todays low to trigger the short. The event that is nearing !! best of trades WAVETIMER ! May good only be watching over us !!!

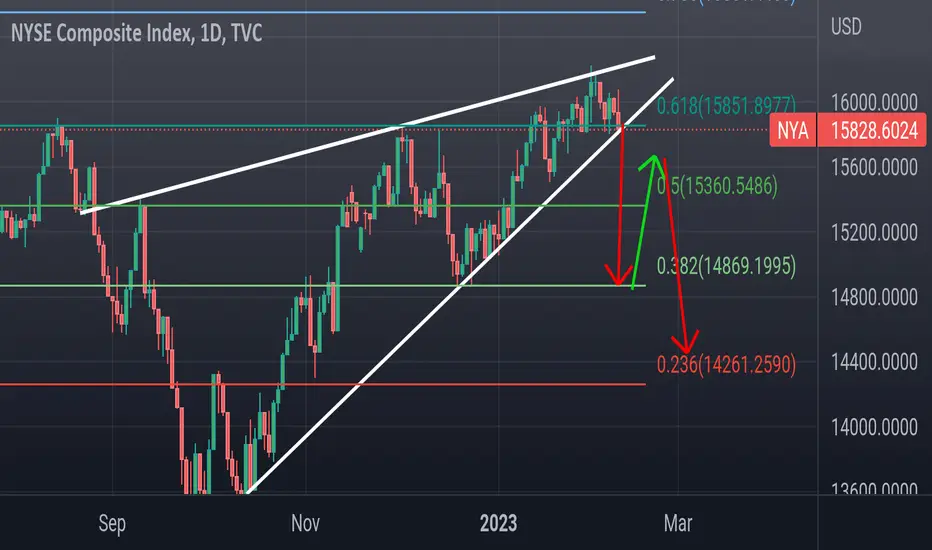
NYSE , Major correction coming for the marketRising wedge Here, we closed on support today .
Once we break and close below support, A market correction will be in progress
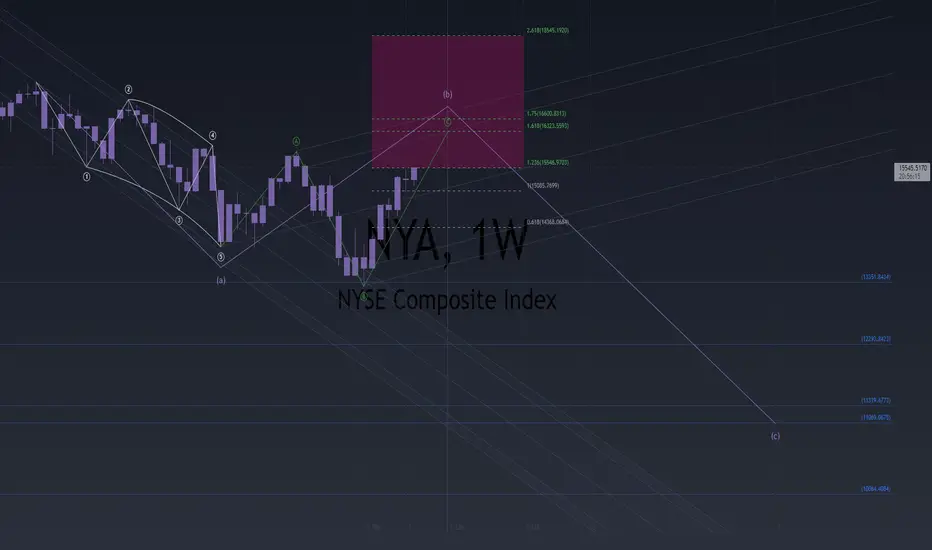
NYA - Major bull trap getting ready to springFor the NYA (NYSE Composite Index) I see an expanding flat (circled ABC) finishing up with an ending diagonal for the C wave.
If so, get ready for a major plunge, most likely to the golden zone.

All Declines Are Not EqualIt is pertinent to remember that there are always stocks to sell into rising markets and stocks to buy into falling markets. Even in a general market correction it is important to distinguish that all declines are not equal under the surface. By that we mean that while prices may all head in a southern direction, what is important is the point from which that decline began in the more structural price pattern of each individual stock.
In other words, we seek to identify what the individual price patterns technically signify in the supply and demand factors underlying the decline. In the past, we have characterized declines in three distinct patterns (Fig 1).
Figure 1:
Chart Pattern A (Figure 2) for educational examples): Declines that may occur within the framework of a structural uptrend in a stock. This pattern would imply that the stock had emerged from a base, or from a secondary consolidation within an uptrend and has declined, or may decline, back toward (or into) that congestion area that now represents support (or an area of demand) for the stock; or pull back within an extended uptrend to create a new area of congestion representing support.
We would not expect stocks representative of this pattern technically to fall to new lows (although in any volatile environment, support levels can be temporarily breached). On balance, we would perceive these Chart A patterns to be among the market leaders, which could be bought into weakness with the longer-term trend in mind.
Notice price uptrends, breakouts through multi-year resistance levels; perhaps a secondary resistance level and the Monthly MACDs on Buy signals (rising).
Figure 2: Examples of Chart A: As an Educational Exercise FLEX, JBL, GFF, Monthly:
Chart Pattern B (see Figure 3 for educational examples): Initial declines, which break below an established support level following an extended uptrend, frequently defining a “topping“ pattern (see arcs) and initiating a structural downtrend for the stock. The Monthly MACD has moved into a declining Sell signal (see red arrows) often with a negative divergence. Patterns of this type can be expected to fall to new lows, often following a kickback rally toward the broken support, now defined as resistance (offering an opportunity to sell into strength), and to underperform the market during weakness (go down more).
This is the pattern to watch for with stocks and / or groups, to guard against a reversal of trend from positive to negative (from a trend of demand to one of supply). Some names that had continued to lift in uptrends during the initial markets’ decline through 2022 are now appearing vulnerable (see Figure 3 below).
Figure 3. Examples of Chart B; As an Educational Exercise UNH, LHX, Monthly
Chart Pattern C (see Figure 4 for educational examples): Secondary declines, generally occur in stocks that have experienced initial structural declines (Pattern B) in the recent past, and thereafter may have bounced into resistance (formerly support) where they encountered supply (selling) and have thereafter fallen back, sometimes establishing a trading range that is eventually penetrated once again to the downside, accompanied by a declining MACD, on a Sell signal; thus extending the structural decline already in place. New lows in price are generally established for the stock.
Such stocks experience their own private corrections and bear markets, sometimes even under the surface of a rallying equity market, as well as into an overall declining market. By virtue of observing the differing characteristics of individual stock declines, one can utilize rallies to sell weaker names, but also utilize dips to accumulate stronger names, as evidenced by which of the three chart patterns a stock portrays. However, in a general market decline, whatever the pattern, one might still consider overall protective measures.
Figure 4. Examples of Chart C: As an Educational Exercise AMZN, PYPL, Monthly.
Louise Yamada CMT
LYAdvisors LLC
Shared content and posted charts are intended to be used for informational and educational purposes only. The CMT Association does not offer, and this information shall not be understood or construed as, financial advice or investment recommendations. The information provided is not a substitute for advice from an investment professional. The CMT Association does not accept liability for any financial loss or damage our audience may incur.

NYSE Composite Index WeeklyA breadth measure, the weekly has broken the down channel and survived a retest and is above the cloud. Similar pattern for SOX, XLF, and XLI. Keep a watch on the trend, it is a good tell for market direction.
The NYSE Composite Index is a stock market index that includes all common stocks listed on the New York Stock Exchange (NYSE). It is calculated using a market capitalization weighted methodology, meaning that the weight of each stock in the index is based on its market capitalization, or total value of all outstanding shares. The NYSE Composite Index is considered a broad market benchmark, and is used to track the performance of the overall stock market. It is different from other stock market indices such as the Dow Jones Industrial Average or the S&P 500, which only include a subset of the stocks listed on the NYSE.

Bullish on the daily McClellan Oscillator Since Jan 4, crossed to the bullish side.
The McClellan Oscillator on the NYA, crossed bullish on the daily and weekly.
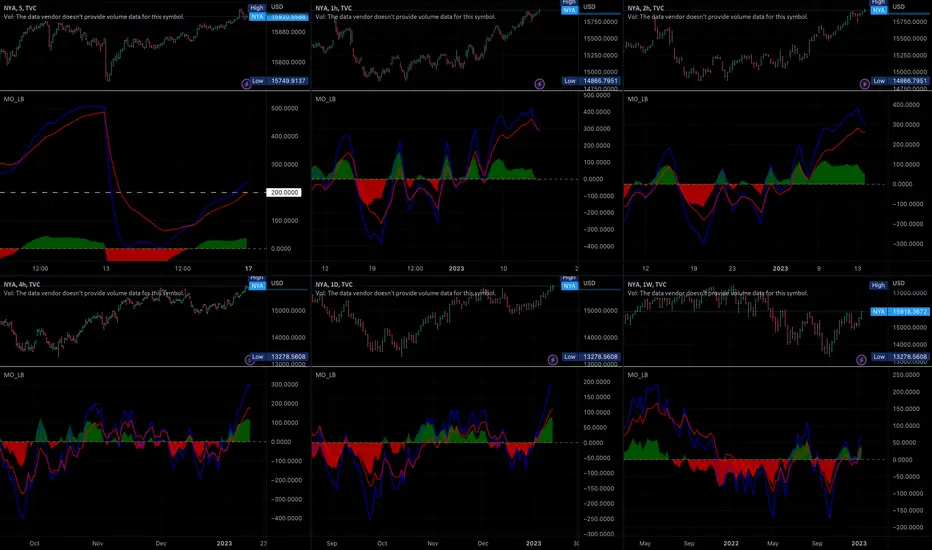
Bullish since DecemberMcClellan Oscillator using the NYA. Multiple confirmations on multiple timeframes.

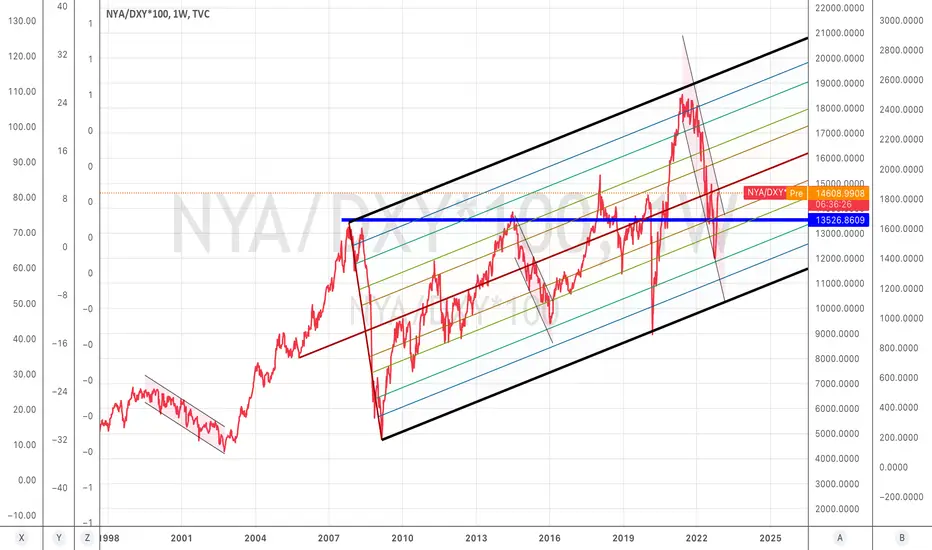
All Stocks with the Example of NYAIf the Strength of King$ matter for current Market Condition's, wouldn't it be reasonable to scale Indices to DXY and normalise ...? What Target of current Correction would we need to expect ?
NYSE Index Bear Case.Good evening,
This post is part of a series of requests i recently received.
The request was: "What is your bearish projection on the US stonk market".
---
Some may ask,
what is the NYSE Index?
👇
The NYSE Composite is a stock market index covering all common stock listed on the New York Stock Exchange,
including American depositary receipts, real estate investment trusts, tracking stocks, and foreign listings.
---
My estimated top for the New York Stock Exchange Index sits at $15,546 ~ $18,545
High probability target = $16,600
---
My estimated bottom on this one is roughly between $12,293 ~ $10,064
High probability target = $11,319
---
🔺
Sometimes I need to remind you Who called the bottom in march 2020 and the top in 2021 . Time to be in cash and please just stay there .turn off the screen stop stop stop . there are cycles that are working I did write alot about 3511 /3490 and oct 4th to th20 focus on the 10 Th this is only part of the motion within the fractals and spirals it is also the tides .And the tides are clear now wouldnt you say . But everytime I try give a road map you think something else . 13 yr bull does not correct this small ever !!!
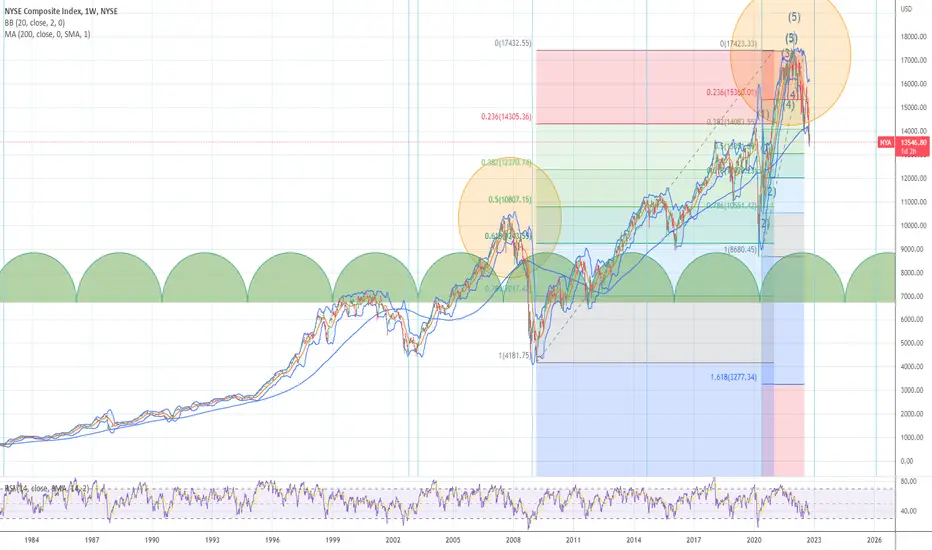
DEPRESSION / CYCLE LOW JUNE 2024 The Cycles and the Rhythm the early stage and why you should respect it if you were to take the fractal of 2000 peak to the low oct 2002 you would see a what and how it will match the cycles posted and have been in my own personal charts I have not shown the public
NYSE UPDATED SEE THE FRACTAL NOW filled the GAP We now have filled the gap the TRAP DOOR is now set for the CRASH now they the WALL as I call it are saying look it was a 50% pullback and it is oct they always bottom . I stand my what I say the first leg of the CRASH is in place NOW the CRASH is set up . I am back to 100% CASH


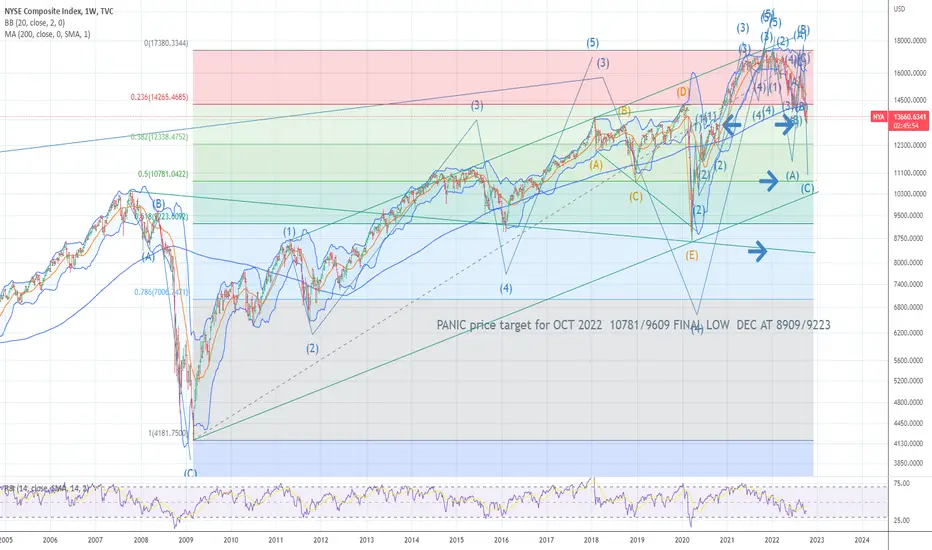
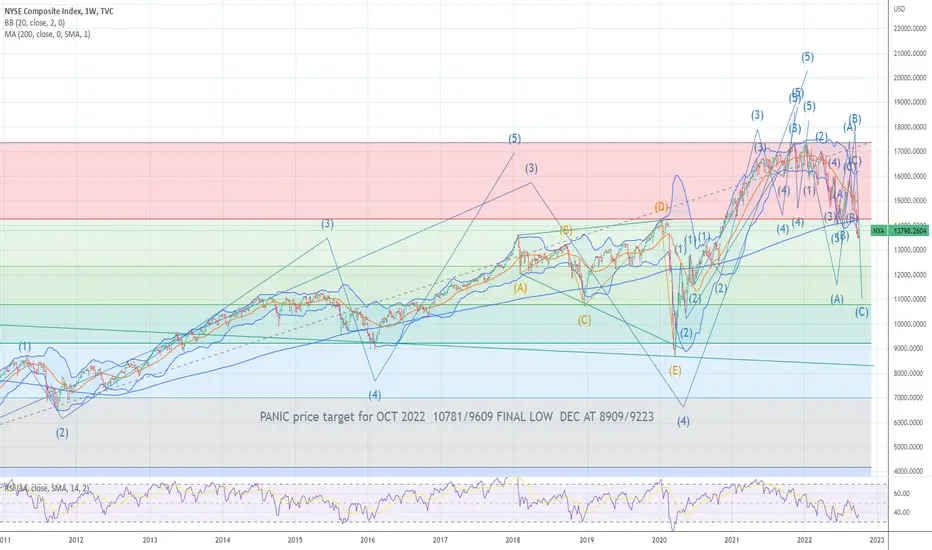
updated nyse chart target for panic lows oct 2022Final low is in DEC at 8909/9223 I am working on the spirals still from past I will have that within this week . The chart posted is that of the NYSE I use this over all to give me a much clearer view as it is ALL the data . in 1987 panic the market dropped to a near perfect .382 from peak to low oct 1932 . and then again in 2009 the drop from 2000 to 2002 times 1.618 gave us the low .Then again in march 23/2020 from the peak in 2020 to the 1974 low a perfect .382 drop to the low . . I am of the view we will return to the level of the 4TH wave which is the march 23 low 2020 soon . Best of trades WAVETIMER ! I am 75 % net short see posts and aug 16/25 turn . or you should be in 100 % cash and should remain until US $ reaches 128 area . Most of you just want to H>O>P>E> that we will be off to the races after this low. I can tell you based on the debt cycle and after a 40 year bull market in expansion of debt that just started a long term BEAR MARKET . I have stated for the record we will see a P/E of lower that 14 and unemployment to see well above 6.3 % I stated by year end if I am off it will be by march 2023
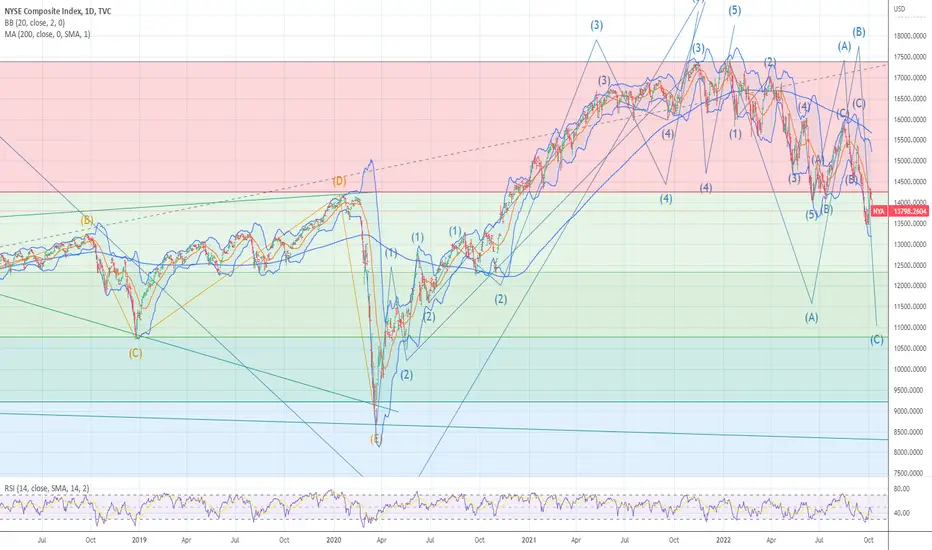
updated NYSE PANIC AND TARGET OCT 4TH/20TH 10781/9609 Final low is in DEC at 8909/9223 I am working on the spirals still from past I will have that within this week . The chart posted is that of the NYSE I use this over all to give me a much clearer view as it is ALL the data . in 1987 panic the market dropped to a near perfect .382 from peak to low oct 1932 . and then again in 2009 the drop from 2000 to 2002 times 1.618 gave us the low .Then again in march 23/2020 from the peak in 2020 to the 1974 low a perfect .382 drop to the low . . I am of the view we will return to the level of the 4TH wave which is the march 23 low 2020 soon . Best of trades WAVETIMER ! I am 75 % net short see posts and aug 16/25 turn . or you should be in 100 % cash and should remain until US $ reaches 128 area . Most of you just want to H>O>P>E> that we will be off to the races after this low. I can tell you based on the debt cycle and after a 40 year bull market in expansion of debt that just started a long term BEAR MARKET . I have stated for the record we will see a P/E of lower that 14 and unemployment to see well above 6.3 % I stated by year end if I am off it will be by march 2023
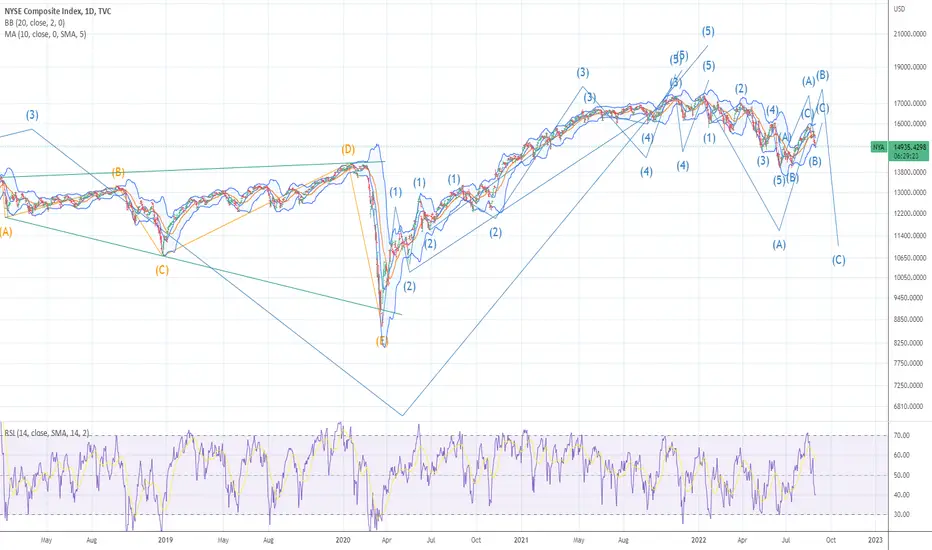
TOP WAVE STRUCTURE THE CHART POSTED is now been labeled for students .For the RECORD I have NOT at anytime changed the way or any waves labeled . this is the forecast that has been in place sine dec 28th 2021
ALT wave B low is in place look for a sharp rally TOP WAVE STRUCTURE WAVE B LOW IS IN PLACE .Look for a sharp counter trend rally into next week
NYSE UPDATED SEE THE FRACTAL NOW The chart posted is to help guide all and understand NO MATTER who the fractals will repeat over and over till the end of time . I studied and wrote many times Mandelbrot as well as A.J Frost I thank both for teaching me as a young man
NYSE Composite Crash & Recovery ProjectionTaking the last 4 major corrections since 2000 averages for both % decline and length to recover to previous level gives a benchmark to consider relative to the current situation.
- % decline 39.38%
- length of time to recover 1,172 days
So $NYA on average well bottom around 10.8k and recover mid-March 2025
Aligning relatively close to the current 200 EMA while taking about 2 yrs for full recovery.

NYA - Bullish following MACD Daily Histogram below 0 for 30 daysNotwithstanding the small sample size, since 2000, NYSE Composite Index ( NYA ) has displayed a consistent 14-day return following a 12, 26, 9 MACD Daily Histogram below 0 for 30 consecutive days.
14-day average gain of 2.31%, win rate of 7 from 7, standard deviation 2.17%, maximum 6.66%, median 1.65%, minimum 0.07%.
Disclaimer: This data is not financial advice. Past performance is not a guide to future performance and may not be repeated. Past performance does not diminish the risk expectancy of any strategy. By its very nature ‘risk’ means you could and most likely will experience losses. No representation or warranty is given as to the accuracy or completeness of any information provided. Data is for educational and informational purposes only.

NYSE index nice ABC wave 4 correctionThe NYSE index, as well as all other USA indexes, has completed wave 4 correction in a text book ABC pattern. It's time for it to develop wave 5.

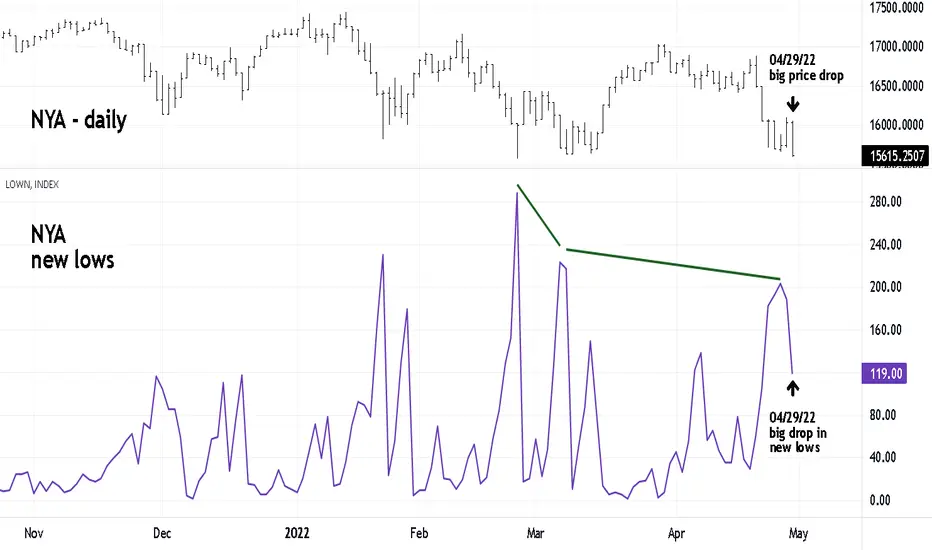
Decreasing NYA - New LowsOn 04/29/22 the NYA made its lowest close since its decline began in early January 2022.
Yet the number of NYA stocks making new lows has decreased.
Additiionally the big price drop on 04/29/22 was accompanied by a big drop in new lows.
This decrease in new lows is coming at a time when bearish sentiment based on the CBOE ratio is at a two year high. Please see my prior
post about the CBOE - Put/Call ratio.
The combination of decreasing lows and extreme bearish sentiment could be the ingrediants for a significant stock market bottom.
Mark