UK100 - TIME TO DESTRUCTION UK TO HELLTeam, UK100 market is tank,
the economy is SH*T, not in a great shape
unemployment rising, crime increasing, jobless
inflation is out of control, but the market has not recognised the effect.
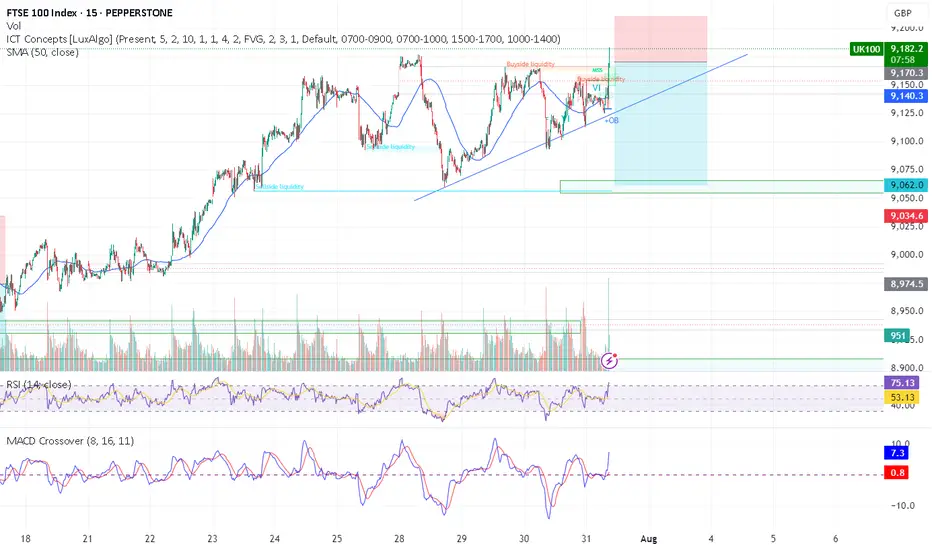
TIME TO PUT AN END TO THIS ERA - short range at 9175-9186
STOP LOSS AT 9225
EASY target 1 at 9152-42 - tak
About UK 100 Index
The UK Financial Times Stock Exchange 100 is an index of share prices of the largest 100 companies listed on the London Stock Exchange (LSE) by market capitalisation. The index was launched on January 3, 1984 at a base value of 1000, and the index level is calculated in real-time.
Related indices
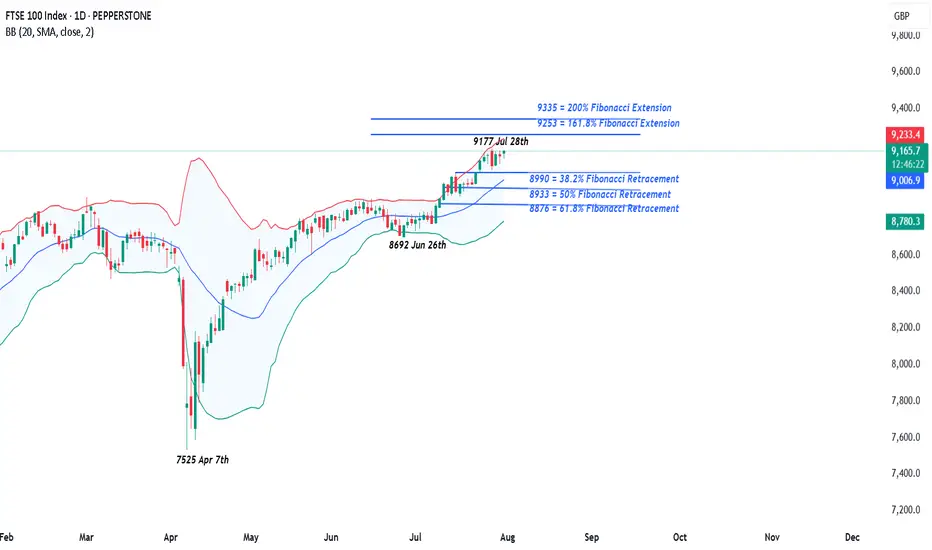
UK 100 – Moving Back Into the Spotlight It’s been a while since we covered the UK 100, but it feels like recent moves and the fact there is a Bank of England (BoE) rate decision next Thursday (August 7th) means it warrants some extra attention.
For much of 2025 the UK 100 has been the under achiever when compared to other European indic
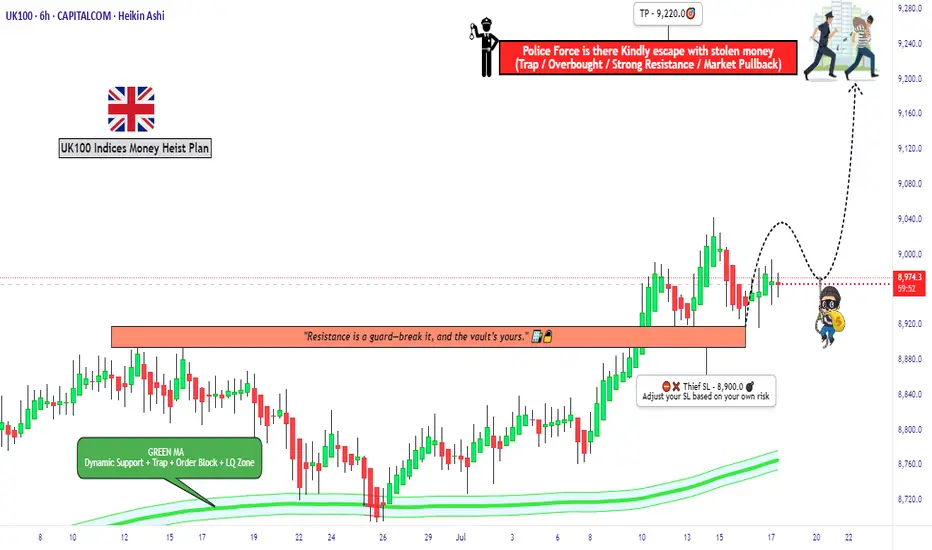
"UK100 Bulls Vault Open! Grab the Loot & Escape Early"🏴☠️💰"UK100 / FTSE100 Market Heist Blueprint" – A Thief Trading Operation for High-Profit Target Extraction 💼📈
🌍 Hola! Hi! Bonjour! Ola! Hallo! Marhaba!
To all the Market Robbers, Smart Thieves, and Strategic Money Makers — welcome to another Thief Trading Heist Plan™.
Ready your gear and charts —
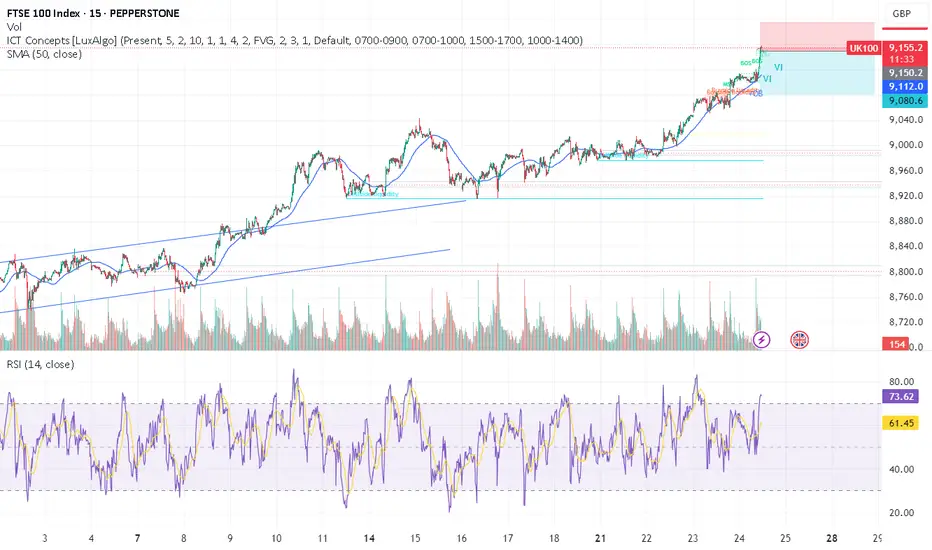
uk100 crazy pump - time to SHORTTeam, those who SHORT UK100, make sure stop loss at 9175
Target 1 at 9135-32
Target 2 at 9109-16
Last few months, UK100 has been aggressively cutting rate due to expose in recession. But now they are out of the wood.
The market has been over pricing and over value.
We expect the market to come
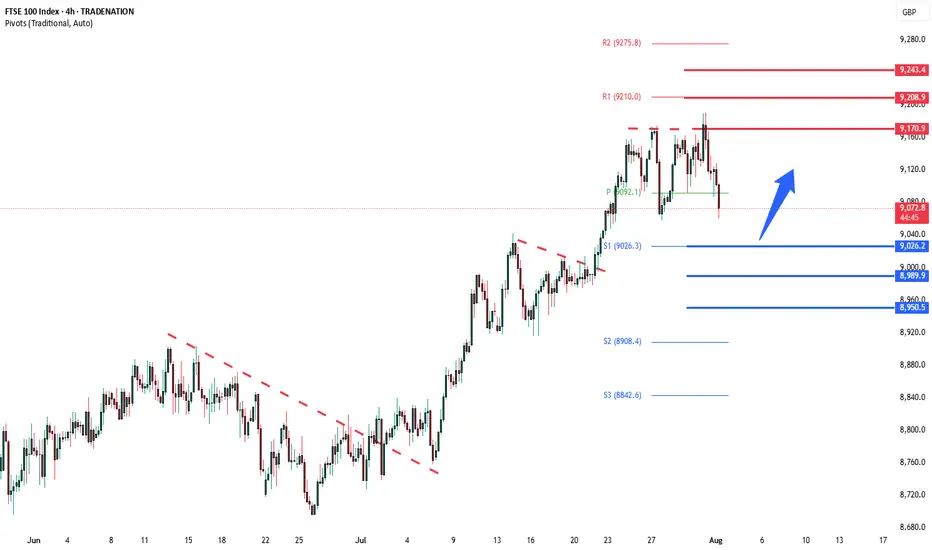
FTSE deeper corrective pullback supported at 9026The FTSE remains in a bullish trend, with recent price action showing signs of a corrective pullback within the broader uptrend.
Support Zone: 9026 – a key level from previous consolidation. Price is currently testing or approaching this level.
A bullish rebound from 9026 would confirm ongoing ups
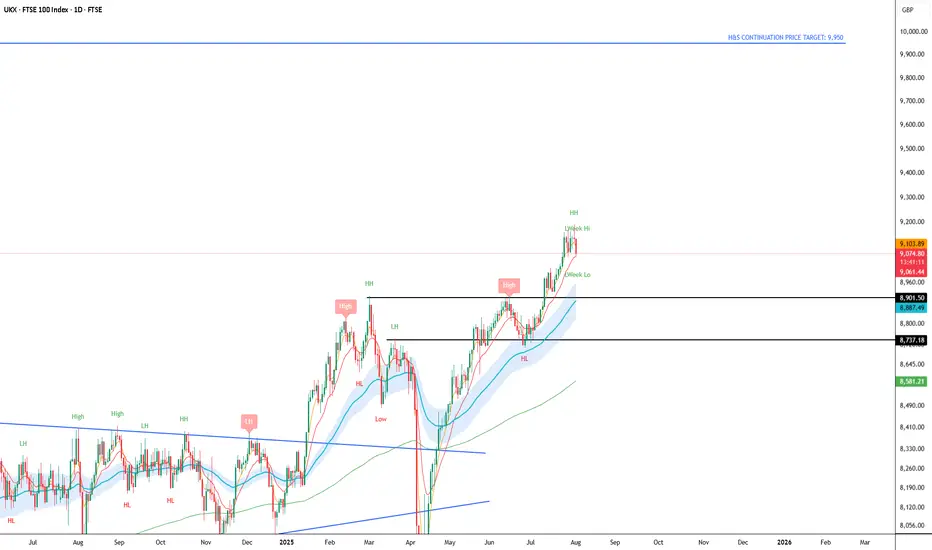
UKX Trending UpUKX bullish continuation.
It could pull back to 8900 and continue with the Head and Sholder pattern on the weekly time scale with a price target of 9975.
Pattern and breakout confirmed.
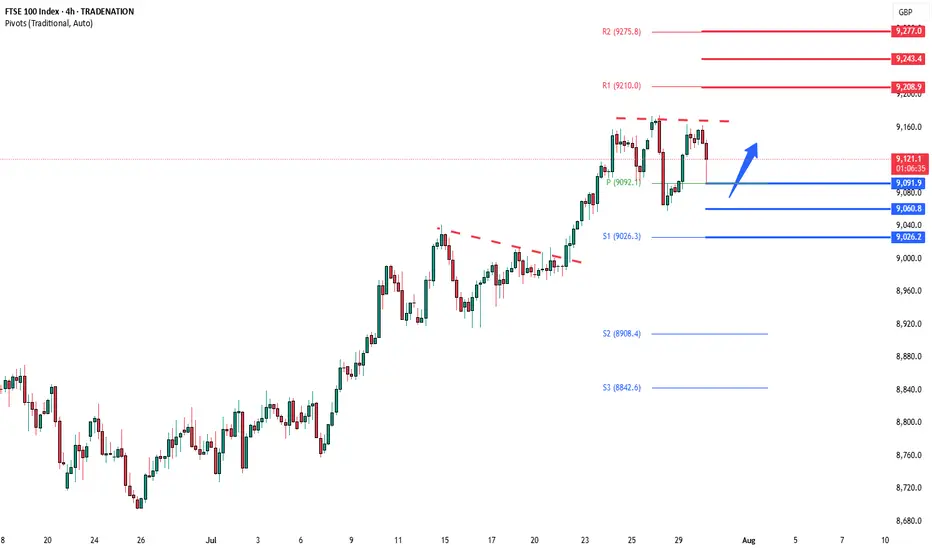
FTSE oversold bounce supported at 9092The FTSE remains in a bullish trend, with recent price action showing signs of a corrective pullback within the broader uptrend.
Support Zone: 9092 – a key level from previous consolidation. Price is currently testing or approaching this level.
A bullish rebound from 9092 would confirm ongoing ups
UK100 | Price Pulls Back After Testing 9,179.72 ResistanceThe FTSE 100 recently tagged 9,179.72, a fresh high, before pulling back slightly. Price remains above the 21-period SMA (blue), indicating the uptrend is still intact, though short-term weakness is surfacing. Immediate support sits at 9,036.17.
Support at: 9,036.17 / 8,889.95 🔽
Resistance at: 9,1

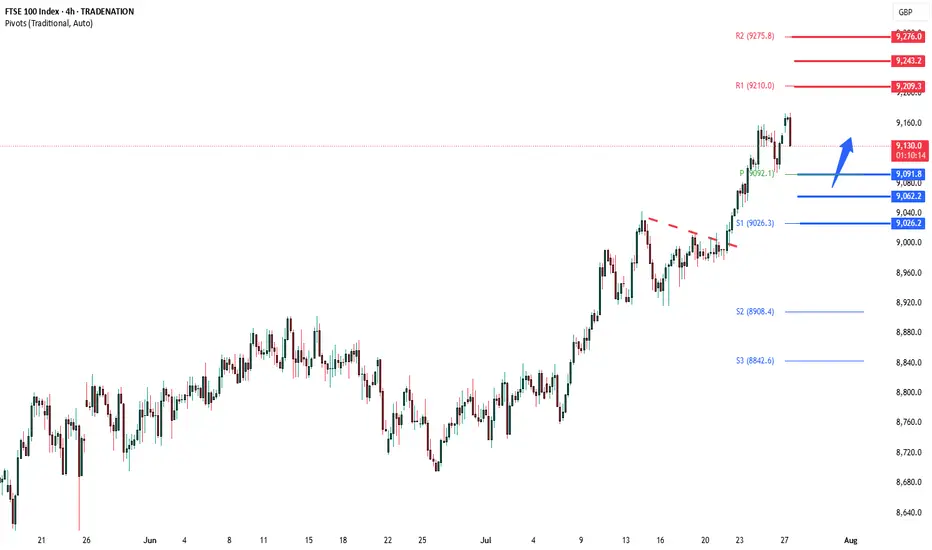
FTSE corrective pullback support at 9092The FTSE remains in a bullish trend, with recent price action showing signs of a corrective pullback within the broader uptrend.
Support Zone: 9092 – a key level from previous consolidation. Price is currently testing or approaching this level.
A bullish rebound from 9092 would confirm ongoing ups
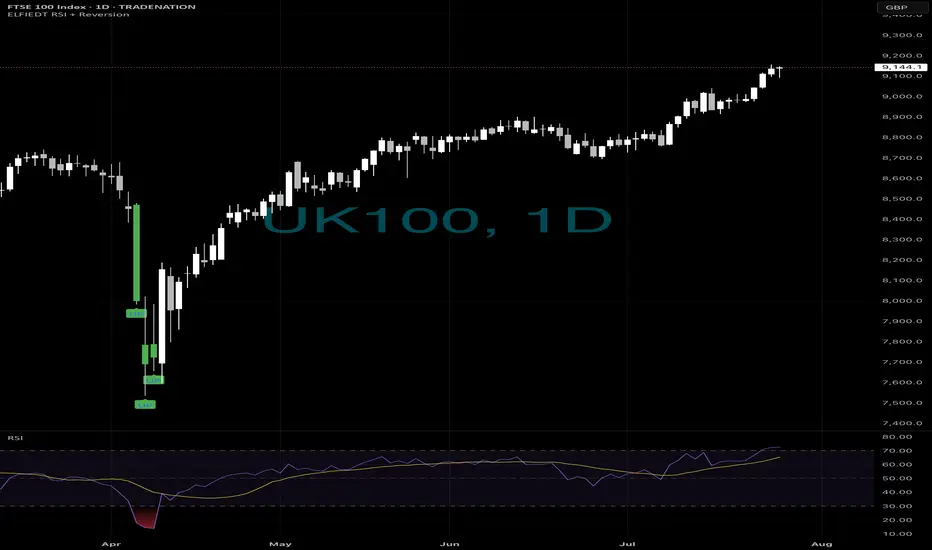
BOOM📈 What If You Built a Position Here?
FTSE100. March–April lows.
Three consecutive BUY signals from ELFIEDT RSI + Reversion.
Each one stacking confidence.
Each one building conviction.
Each one right before the entire market exploded higher.
And it wasn’t just FTSE…
🟢 US500? Triggered.
🟢 DOW? Trig
See all ideas
Summarizing what the indicators are suggesting.
Oscillators
Neutral
SellBuy
Strong sellStrong buy
Strong sellSellNeutralBuyStrong buy
Oscillators
Neutral
SellBuy
Strong sellStrong buy
Strong sellSellNeutralBuyStrong buy
Summary
Neutral
SellBuy
Strong sellStrong buy
Strong sellSellNeutralBuyStrong buy
Summary
Neutral
SellBuy
Strong sellStrong buy
Strong sellSellNeutralBuyStrong buy
Summary
Neutral
SellBuy
Strong sellStrong buy
Strong sellSellNeutralBuyStrong buy
Moving Averages
Neutral
SellBuy
Strong sellStrong buy
Strong sellSellNeutralBuyStrong buy
Moving Averages
Neutral
SellBuy
Strong sellStrong buy
Strong sellSellNeutralBuyStrong buy
Displays a symbol's price movements over previous years to identify recurring trends.
Frequently Asked Questions
The current value of UK 100 Index is 9,068.59 GBP — it has fallen by −0.70% in the past 24 hours. Track the index more closely on the UK 100 Index chart.
UK 100 Index reached its highest quote on Jul 24, 2025 — 9,158.21 GBP. See more data on the UK 100 Index chart.
The lowest ever quote of UK 100 Index is 1,717.70 GBP. It was reached on Sep 9, 1988. See more data on the UK 100 Index chart.
UK 100 Index value has decreased by −0.76% in the past week, since last month it has shown a 3.22% increase, and over the year it's increased by 8.37%. Keep track of all changes on the UK 100 Index chart.
The champion of UK 100 Index is LSE:CCEP — it's gained 10.72 K% over the year.
The weakest component of UK 100 Index is LSE:WPP — it's lost −46.08% over the year.
UK 100 Index is just a number that lets you track performance of the instruments comprising the index, so you can't invest in it directly. But you can buy UK 100 Index futures or funds or invest in its components.
The UK 100 Index is comprised of 100 instruments including LSE:AZN, LSE:HSBA, LSE:SHEL and others. See the full list of UK 100 Index components to find more opportunities.