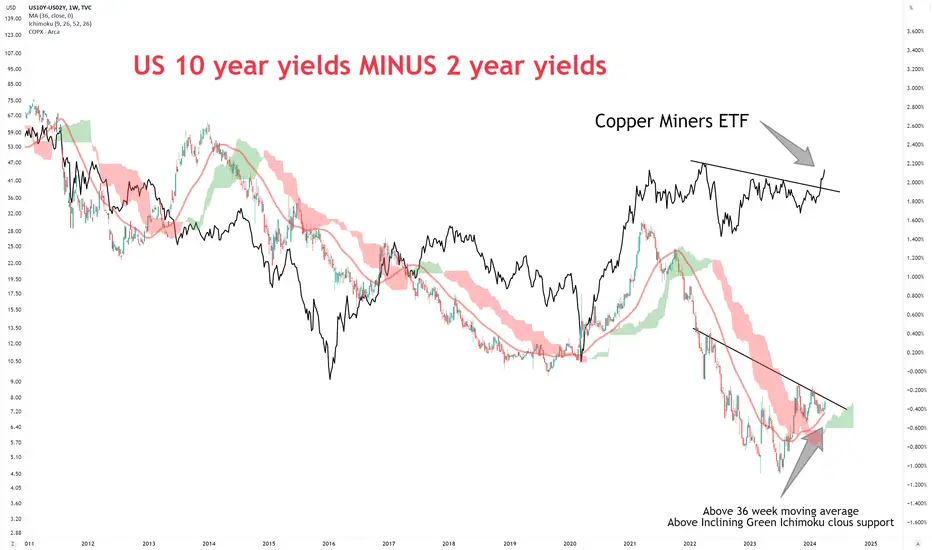
10 minus 2 + copperCopper miners smelling more yield curve un-inversion...
#copper #silver #gold #uranium #crudeoil
US10Y trade ideas
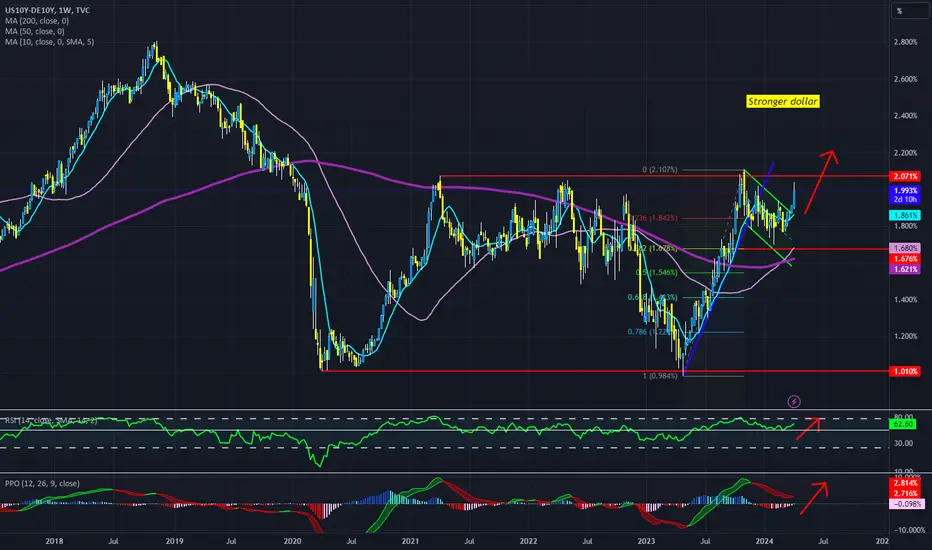
Yield spreads and Dollar higherI wam showing another (weekly t/f) version of the chart I published weeks ago on the driver for USD bs the Euro - yield spread between US10Y and German10Y.
There is NOTHING bearish about this chart.
Price (spread) breaking higher. Indicators as positive as you like.
Dollar higher.
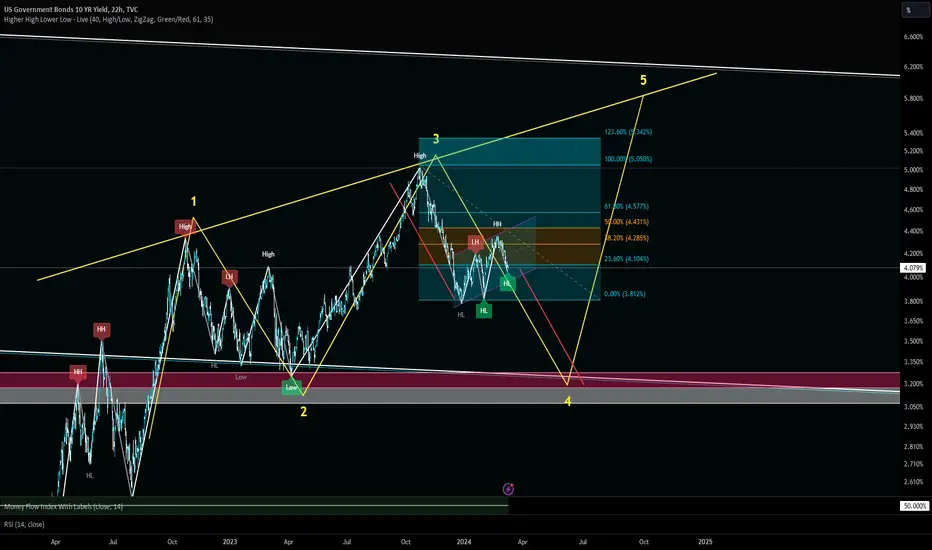
US10YR BONDSlooks like we found the turn frens.
lets geaux.
hopefully youre an OG with fib extensions :)

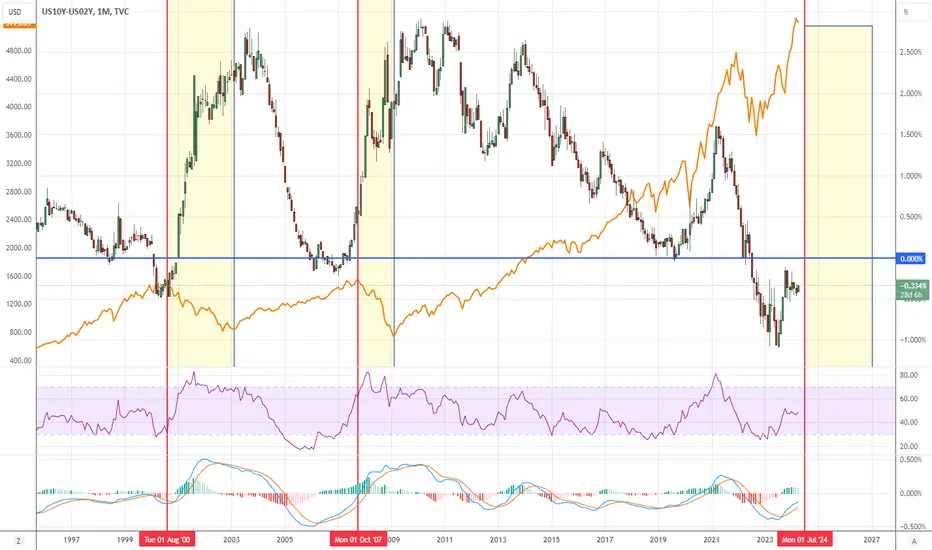
Yield Curve US10Y-US02Y telling a crash incoming?When the yield curve (US10Y-US02Y) started going back up and uninverted, that's when markets reached their TOPS and started going back down.
This happened in 2000 and 2007.
I feel like this will happen again in 2024.
The yield curve went from -1% to -0.3% in the last year. It is going back up.
Will SPX top in 2024 and go down for the next 1-3 years?
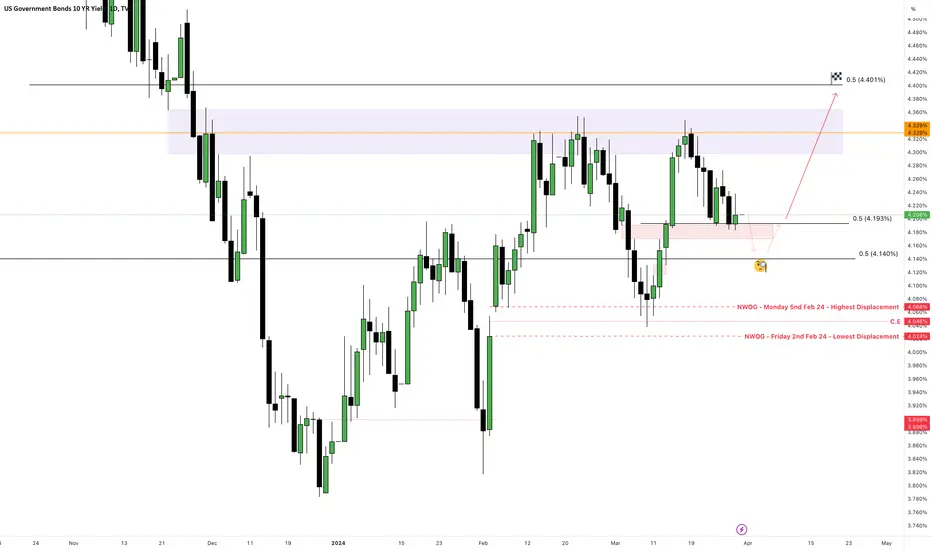
US10Y - Sellers, Be Careful!Relative equal highs around the 4.329% level is prone for smart money to liquidate those who placed their stops above recent highs.
Stagnent throughout the week but the overall sentiment for yields over the short-term is bearish as a LH was formed, piling shorts to place their stops above recent short term highs as well as yields being bearish 2 weeks in a row, forgiving the fact that this weeks trading has been choppy.
I cannot discount the possibility that we could continue to see a selloff into 4.140% before a major pullback with Wednesday and Friday being the most volatile day due to the volume of red folders coming out.
Yields bullish projection goes hand-in-hand with Euro's weekly short projection to 1.25180 with a stretch target of 1.23623.
Dollar Index will also have the freedom to reprice higher as a weaker Euro generally leads to stronger Dollar.
Looking forward to see how this weeks price action plays out as we could be in for some fireworks leading into the ending of this week...
Will we sell the short traders a dream by continuing to retrace lower, piling in more shorts (with, of course SL's placed above recent highs) before ripping their eyeballs out or...
Sweep through sellside liquidity down at the lowest displacement new week opening gap @ 4.024 enabling bonds to freely move to the upside?
My philosophy is simple...
Fortify Michael J Huddlestone's concepts that I have studied to consistently predict where the market is more likely to go.
This includes;
- Market Structure
- Buyside/Sellside Liquidity
- Order Blocks
- Liquidity Voids
- Fair Value Gaps
- Optimal Trade Entry
- Premium/Discount Array
- SIBI/BISI
- Many More!
The strategies mentioned here are some of many that I use to implement into my analysis and over time, with consistency I aim to achieve a high degree of accuracy in the markets with the foresight and understanding to assess what went wrong when my bias is negated.
Credits;
- Michael Joe HUDDLESTONE
- Shawn Lee POWELL
- Toray KORTAN
us10yNO emotions no expectations we enter the charts we set them up we execute. #daytrader #trader #stockmarket TVC:US10Y #us10y
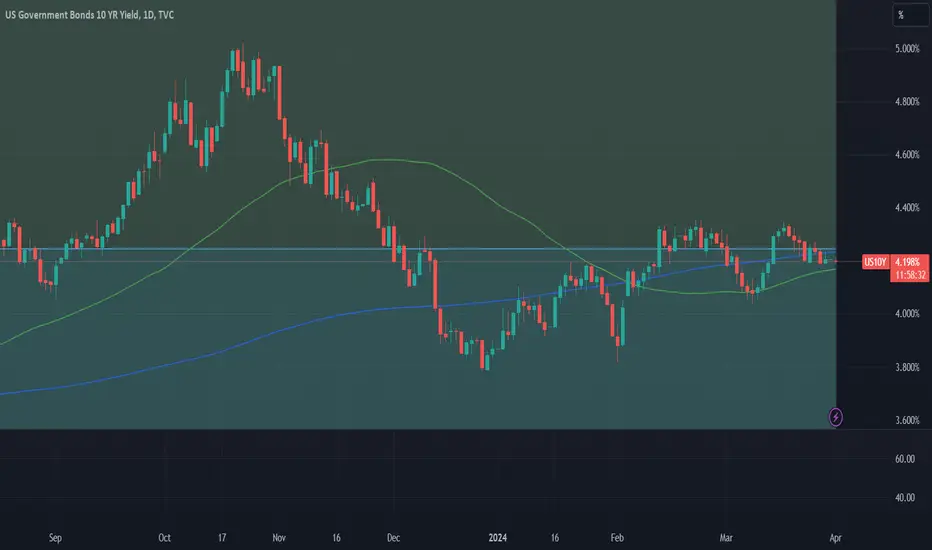
US 10Y TREASURY: testing 4.2%The 10Y US Treasuries finished the first quarter testing 4.2% level. The favorite Fed's inflation gauge, PCE indicator was published on Friday, indicating that the inflation is moving within market expectations. This additionally supported market optimism that the Fed will cut interest rates in June this year, which is currently estimated with 60% chance. Speaking at the Economic Club of New York gathering, Fed Governor Christopher Waller noted that there is no rush for cutting interest rates. He saw a rationale in keeping interest rates at current levels for longer to help inflation on its "sustainable trajectory toward 2%".
Based on current charts, it might be expected that the market will start the week ahead by testing the 4.2% level. At this moment there are no expectations that yields might move below this level. On the opposite side, there is a low probability that yields could move higher to the upside, aside from 4.25% level. Overall, some higher swings in yields should not be expected at this moment.
US10Y - You Could Say Last Weeks Targeting Was OverzealousPlaying safe this week as last weeks projection was stretched to 4.401% but top formed @ 4.348%.
Immediate Swing high and low in relation to current price means we are currently in a discount market with last weeks updated projection of 4.19% still up for grabs and macro EQ @ 4.137% also up for debate if the sell programme continues.
My philosophy is simple...
Fortify Michael J Huddlestone's concepts that I have studied to consistently predict where the market is more likely to go.
This includes;
- Market Structure
- Buyside/Sellside Liquidity
- Order Blocks
- Liquidity Voids
- Fair Value Gaps
- Optimal Trade Entry
- Premium/Discount Array
- SIBI/BISI
- Many More!
The strategies mentioned here are some of many that I use to implement into my analysis and over time, with consistency I aim to achieve a high degree of accuracy in the markets with the foresight and understanding to assess what went wrong when my bias is negated.
Credits;
- Michael Joe HUDDLESTONE
- Shawn Lee POWELL
- Toray KORTAN

A day can make a difference for RatesInteresting what one day can do for a chart!
The trend is still up but #interestrates look fairly weak today.
The 1 & 2 year are not so bad but the 10 & 30 year look weaker.
TVC:TNX
US #Dollar still looks okay though, at least for now.
TVC:DXY

Rates not acting as if a cut is coming...Let's look at rates for a bit.
Short term #yield is slowly climbing the trend line.
1 & 2 Year.
Longer term #interestrates look similar to the short term.
10 & 30 Year.
US #Dollar not as strong as bond yields but it is trading similar to them.
TVC:TNX TVC:DXY

US 10Y TREASURY: digesting Fed`s narrative Since the beginning of March, US Treasuries were waiting for a Fed`s clear signal over the course of their interest rate actions, and they finally got the necessary details in a statement after the FOMC meeting. The Fed is planning to cut interest rates three times till the end of this year. A few more cuts are coming in 2026. This information brought some relaxation in 10Y Treasury yields, so they moved from 4.34% as a highest weekly level toward the supporting 4.2%.
Current question is whether yields are preparing for a move toward levels from the beginning of March, when they were standing at 4.0%? On a long run, they will certainly make this move, however, probably not during the week ahead. The reason is that markets take time to digest all the information received, and then make a decision on a clear move. In this sense, for the week ahead the most probable scenario is that 10Y Treasury yields will take some time to test the 4.2% before they decide for a move toward the lower grounds.


Ten Year Yields: Potential OutcomesThis is the yearly perspective Ten-year Treasury. Note the break of the secular downtrend and the push above the 3.35% pivot. It's worth noting that the MACD oscillator has turned higher for the first time since 1985.
The basic definition of an uptrend is a market consistently defining higher highs and higher lows. For instance, a great example of a downtrend can be seen in the annual ten year Treasury chart, where over several decades yields consistently made lower lows and lower highs, defining a very clear and obvious bull market (yields down/prices up).
For bonds to begin defining a secular bear (bond prices down/yields up) will require yield to set back from a high pivot, define a higher low pivot, and subsequently make a substantive new high. From that point, tentative annual and monthly trendlines and channel projections can be drawn and Fibonacci and point-and-figure price projections made. Importantly, this structure would define a secular bear and place weekly and monthly momentum in harmony with annual momentum. I fully expect this transition to occur over the next 12-18 months.
The biggest question in my mind is whether last October's 4.98% high print marked the terminal point for the bearish structure that has built since the 0.40% low. I suspect that is indeed the case and that by midyear yields will be falling. But there is also a reasonable case for one final push higher, into the stronger resistance zone around 5.25%, before subsequently setting back and defining the higher low. Given this view, the evolution of the weekly chart over the next few months becomes particularly important.
Conclusion:
The next few weeks should represent a significant juncture in the daily, and potentially the weekly chart. The market has been generally consolidating over the last several months and the breakout of the pattern could be meaningful.
For shorter term traders the direction out of the consolidation will likely define the direction of travel into the fall. In other words, it is a go with.
If yields do break out higher I am likely to begin selling the breakouts of bear (prices down/yields higher) flags and will view short term declines in yields as selling opportunities. If lower, I will likely be a buyer of bull flags and setups (yields down/prices higher) as they develop.
If the market falls away from the trendline with velocity, first solid support there is found in the 3.79% zone.
I continue to see a not trivial chance of one last push higher into the 5.25-5.50% zone before beginning a major weekly and monthly perspective correction (yield down/price up) that eventually makes the higher low. And while I see an advantage to being generally bullish over the next few months (falling yields, rising prices), the analysis is tentative with only a small near-term advantage to the trade. In my own trading, I would consider it non-actionable without additional price/volume development or reasonable structure to trade against.
In deference to my macro work and business cycle work, I will be a better buyer of bullish inflections in the weekly chart over the next few months as I fully expect a significant economic slowdown to develop into the end of the year.
And finally, many of the topics and techniques discussed in this post are part of the CMT Associations Chartered Market Technician’s curriculum.
Good Trading:
Stewart Taylor, CMT
Chartered Market Technician
Shared content and posted charts are intended to be used for informational and educational purposes only. The CMT Association does not offer, and this information shall not be understood or construed as, financial advice or investment recommendations. The information provided is not a substitute for advice from an investment professional. The CMT Association does not accept liability for any financial loss or damage our audience may incur.

Analysing the US 10-Year Treasury YieldAnalysing the US 10-Year Treasury Yield: Fed Meeting Focus and Key Resistance Levels
Market attention is currently fixated on the upcoming two-day Federal Reserve meeting scheduled for Tuesday and Wednesday. The expectation is for the Fed to maintain interest rates at their current level, with investors closely monitoring any updates to economic projections and interest rate forecasts by policymakers.
Following a notable rally last week, the US 10-year Treasury yield has returned to a critical juncture, hovering around the key resistance level of 4.35/36. This level marks the highs seen in August 2023 and February 2024, representing a pivotal point on the short-term chart.
In terms of future movement, attention is drawn to potential upward movement beyond 4.36. A longer-term analysis reveals that an established trendline now acts as resistance at 4.60. Just before this level, the 61.8% retracement of the recent downward trend sits at 4.55 (October to December 2023). For further insights, referring to the video posted on February 19th could be beneficial.
Critical near-term support is identified at the March 24 low of 4.04. Additionally, the 200-day moving average provides support at 4.21, while the 55-day moving average is situated at 4.15, further underlining key support levels.
#TreasuryYield #FedMeeting #InterestRates #EconomicProjections #MarketAnalysis #TechnicalAnalysis #ResistanceLevels #SupportLevels #Investing
#technicalanalysis #lovecharts
Disclaimer:
The information posted on Trading View is for informative purposes and is not intended to constitute advice in any form, including but not limited to investment, accounting, tax, legal or regulatory advice. The information therefore has no regard to the specific investment objectives, financial situation or particular needs of any specific recipient. Opinions expressed are our current opinions as of the date appearing on Trading View only. All illustrations, forecasts or hypothetical data are for illustrative purposes only. The Society of Technical Analysts Ltd does not make representation that the information provided is appropriate for use in all jurisdictions or by all Investors or other potential Investors. Parties are therefore responsible for compliance with applicable local laws and regulations. The Society of Technical Analysts will not be held liable for any loss or damage resulting directly or indirectly from the use of any information on this site.

US10Y - Can We Get That Last Bullish Push4.329% - 4.354% is unfinished business!
A healthy retracement to 4.200% is not ruled out and would be considered as 'healthy' as price action would still be in a premium.
My philosophy is simple...
Fortify Michael J Huddlestone's concepts that I have studied to consistently predict where the market is more likely to go.
This includes;
- Market Structure
- Buyside/Sellside Liquidity
- Order Blocks
- Liquidity Voids
- Fair Value Gaps
- Optimal Trade Entry
- Premium/Discount Array
- SIBI/BISI
- Many More!
The strategies mentioned here are some of many that I use to implement into my analysis and over time, with consistency I aim to achieve a high degree of accuracy in the markets with the foresight and understanding to assess what went wrong when my bias is negated.
Credits;
- Michael Joe HUDDLESTONE
- Shawn Lee POWELL
- Toray KORTAN

US 10Y TREASURY: rethinking timeSince the beginning of this year, until last week, the markets were certain that inflation is on the down-path and that the Fed might cut interest rates somewhere in May this year. However, the February inflation data made the markets rethink their initial assumptions. The inflation seems to be more persistent than initially estimated, in which sense, the rate cutting time by the Fed might come somewhere in the second half of this year. The market reacted on officially released data, so the 10Y benchmark yields returned a bit toward the higher grounds, reaching the level of 4.3% during Friday`s trading session.
It should be considered that the week ahead might bring back some volatility. The FOMC meeting is scheduled for the week ahead, as well as FOMC economic projections. The market will gain more insights into the course of the potential future monetary actions by the Fed and will position accordingly. In this sense, some increased volatility might be expected. However, the level of 4.3% seems as a peak on charts at this moment, from where some relaxation might be expected, at least toward the 4.2% level.

US10Y - Will We See Lower Rates Going Into The FutureThis week was a waterfall.
Next week will be the week of short seller payback!
A continuation of yields trading @ CE; 4.046%, even sweeping Sellside liquidity @ 4.038% is still a possibility but for the past 4 days, the sentiment is more weighted to the downside rather than the upside, with the lowest displacement NWOG being my last line of defence @ 4.024%.
Going into next weeks trading, we can see that there are many relative equal highs and short term highs that have many buy stops placed above them.
My bet is smart money will look to target those buy stops. Just how far they are willing to reprice to will be something to analyse over the days next week.
My philosophy is simple...
Fortify Michael J Huddlestone's concepts that I have studied to consistently predict where the market is more likely to go.
This includes;
- Market Structure
- Buyside/Sellside Liquidity
- Order Blocks
- Liquidity Voids
- Fair Value Gaps
- Optimal Trade Entry
- Premium/Discount Array
- SIBI/BISI
- Many More!
The strategies mentioned here are some of many that I use to implement into my analysis and over time, with consistency I aim to achieve a high degree of accuracy in the markets with the foresight and understanding to assess what went wrong when my bias is negated.
Credits;
- Michael Joe HUDDLESTONE
- Shawn Lee POWELL
- Toray KORTAN

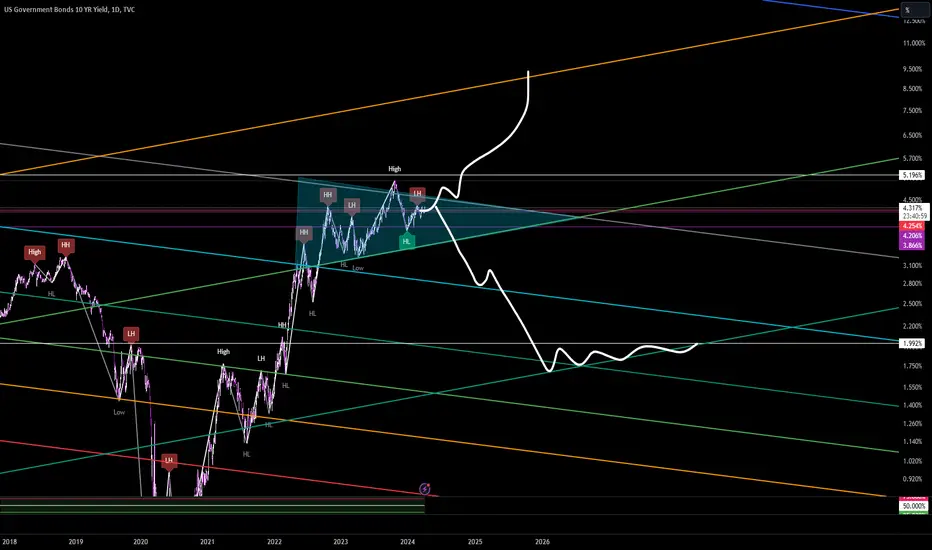
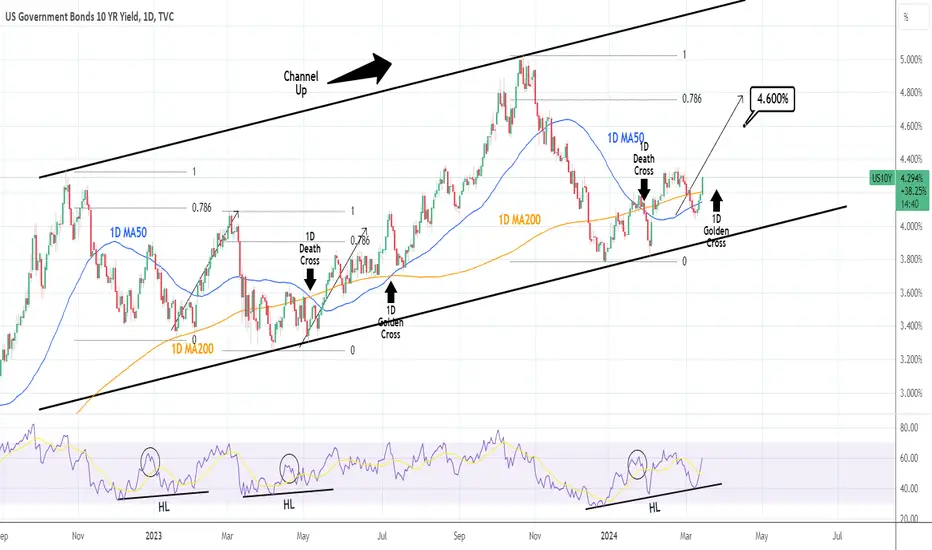
US10Y Expect to see a new High.The U.S. Government Bonds 10 YR Yield has turned bullish on its 1D technical outlook (RSI = 60.193, MACD = 0.003, ADX = 38.653) as it crossed above the 1D MA200 again, with the 1D MA50 following right under it, with the two on an emerging 1D Golden Cross. We have anticipated that rebound from the HL of the Channel Up on our previous idea and our medium-term target (TP = 4.600%) is intact.
If the 0.786 Fibonacci level breaks, we will buy after the first 1D MA50 pullback. The 1D RSI is also posting a similar early rally sequence to April-May 2023 and December 2022-January 2023.
See how our prior idea has worked out:
## If you like our free content follow our profile to get more daily ideas. ##
## Comments and likes are greatly appreciated. ##
US 10Y TREASURY: currently without doubtsDuring the previous week the market was pricing released job data in the US. Increasing unemployment rate boosted investors expectations that the Fed's rate cuts are round the corner. Also it has been confirmed through the Fed Chair Powell`s testimony to the Senate, with wording “at some point” during the course of this year. Although, initially, it was expected that the rate cut might occur in May, currently the odds are 80% that it might happen in June this year. Treasury yields were aligned accordingly. The 10Y US benchmark rate slipped from the level of 4.2% at the start of the week toward the 4.0% as of the weekend. Such a move was a clear sign that the market has no more doubts that the rate cuts are coming.
Inflation rate for February as well as retail sales in the US are set for a release in a week ahead. Any surprises on this side might impact some volatility on the markets, however, without a significant move toward either side. The 10Y Treasuries will continue to test the 4.0% with a low probability that this level might be breached. On the opposite side, some moves toward 4.1% are more probable.

Yield Inversion US10Y-US02Y vs SPXEvery time the yield curve has gone negative, a market crash follows eventually. The trick is knowing when that happens. Nobody knows.
When the yield inversion starts rising again, that's a sign it's about to pop. Better start selling out of markets into USD. DXY will start rising again eventually.
Looking at the charts, my guess is 3-6 months tops before we reach a market high in a mega melt-up.
Markets will become very volatile! Sell on the way up! Put in sell orders at specific prices you'd be happy with profits. Then wait for your sell orders to trigger and for the money to come in!
We are at the end of a multi-year bubble which is about to pop. Protect your capital! But not yet!

us10ylooking at a possible bear flag giving the stock market that one more push before a possible rotation
Yield is ready - US Dollar is ready - nothing else is!Come at me with critisism. The markets will have a hard landing. Time is on my side.
