US10Y Hello and have a good time I trade according to these analyses My analysis is based on fundamentals, intermarket analysis, news, geopolitical topics, and of course technical levels. I hope it is your light
US10Y trade ideas

you getting sick of these stock all time highs?it looks like we are about to have fun again, its going to be a slow ride there though.

ShortIt Looks like a sell in US 10Yr Bond Yields.
What's your thoughts? Bear Flag break break down on Daily chart potential move towards 2.78?
if you like the idea please leave comment and share.
USD/JPY can go down with this

US10Y has started a new trend. Commodities up only. Inflationary times ahead unfortunately. Stocks should have a modest perform. On the other hand commodities like gold could spike.

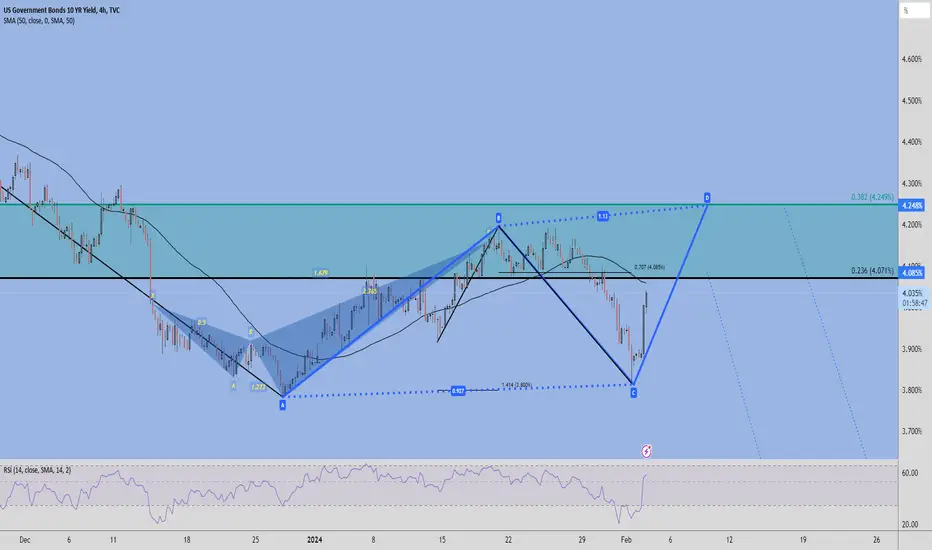
Assessing US T-Note Pre-FedWe're examining the US Treasury Note in anticipation of the Fed meeting. The market seems to have finished a corrective pattern ('a-b-c') and is currently facing resistance from the 55-day and 200-day moving averages. This puts it in a defensive position prior to the meeting.
The central bank is widely anticipated to maintain interest rates, but the spotlight will be on any indications regarding future rate cuts from policymakers.
Disclaimer:
The information posted on Trading View is for informative purposes and is not intended to constitute advice in any form, including but not limited to investment, accounting, tax, legal or regulatory advice. The information therefore has no regard to the specific investment objectives, financial situation or particular needs of any specific recipient. Opinions expressed are our current opinions as of the date appearing on Trading View only. All illustrations, forecasts or hypothetical data are for illustrative purposes only. The Society of Technical Analysts Ltd does not make representation that the information provided is appropriate for use in all jurisdictions or by all Investors or other potential Investors. Parties are therefore responsible for compliance with applicable local laws and regulations. The Society of Technical Analysts will not be held liable for any loss or damage resulting directly or indirectly from the use of any information on this site.

Doesn't matter what we do - $TLT $TNX if flatBased on the chart analysis - our two options both result in the same location. If we are bullish on rates, then rates will increase and see heavy resistance on the upper side. On the same right, if we drop lower, we will see heavy resistance there as well. My expectation is that rates are the same for the immediate future.

US 10Y TREASURY: gearing for FOMCReleased US economic data during the previous week were driving the sentiment for the US Treasuries. Released data of Q4 GDP growth rate of 3.3% was better than anticipated by the market`s 2.0%. Also released PCE data show further easing of inflation pressures, where core PCE reached 2.9%, lower from expected 3.0% by the market. This supported market sentiment on a Fed's rate cuts during the course of this year, so the yields responded to those expectations. The 10Y Treasuries started the week around 4.2%, but ended it at 4.14%.
The FOMC meeting is scheduled for the week ahead. In case that Fed`s rhetoric reveals anything new that the market did not priced, then it could be expected some volatility on markets, but also in Treasury yields. However, in case that everything runs smoothly, as expected, then the 10Y US yields should further ease, at least till the level of 4.10%, with some potential for 4.0%.

US 10 Y Rates increasing into FEB?there is a decent chance we see rates increase into February. There is definitely some suipport in this current area, and i see a move up personally. what do you think?

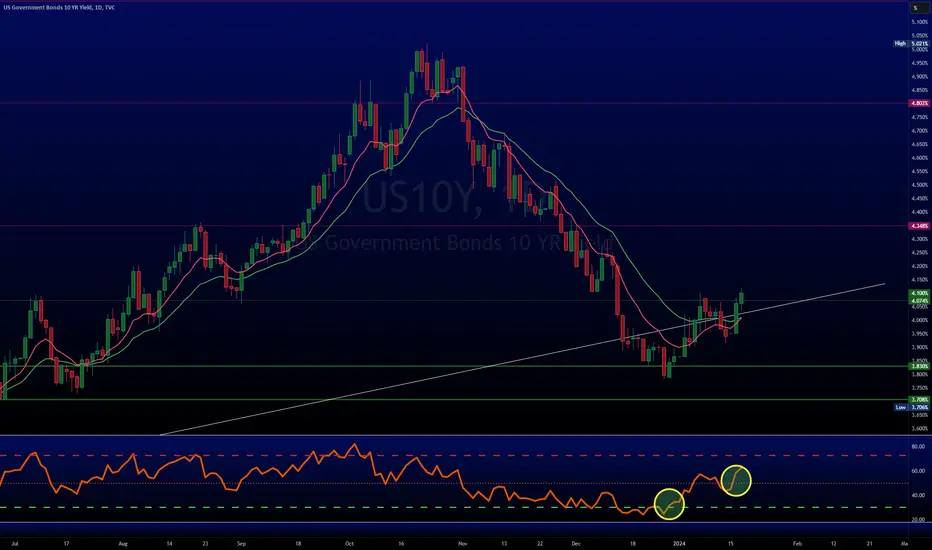
US10Y About to form a 1D Death Cross. How to trade it?The U.S. Government Bonds 10 YR Yield (US10Y) has gone a long way since our last 1D analysis 3 months ago (October 21 2023, see chart below), hitting all 3 Targets in the process:
This time however it is in a completely different situation as it may be rebounding since the Higher Low at the bottom of the long-term Channel Up on December 28, but is being rejected on the 1D MA50 (blue trend-line) since Friday. As a result by tomorrow it will complete a 1D Death Cross, which is technically a bearish pattern.
Last time it was formed however (May 04 2023), it did so exactly on a bottom and a very strong 6-month rally started. Also technically, every time it finished such a downtrend (blue ellipse), strong rallies above the 1D MA50 followed.
As a result our trading plan will be based on simple break-outs. As long as the price closes a 1D candle above the 1D MA50, and remains within the Channel Up, we will be bullish targeting the 5.000% Resistance. If however it breaks below Support 1, the loss will be minimal and we will reverse to a sell, targeting Support 2 at 3.300%.
-------------------------------------------------------------------------------
** Please LIKE 👍, FOLLOW ✅, SHARE 🙌 and COMMENT ✍ if you enjoy this idea! Also share your ideas and charts in the comments section below! This is best way to keep it relevant, support us, keep the content here free and allow the idea to reach as many people as possible. **
-------------------------------------------------------------------------------
💸💸💸💸💸💸
👇 👇 👇 👇 👇 👇

$DXY pumping as are Yields and OilPretty good calls on the following:
(see our profile for more info)
The US #Dollar maintains its upward trend.
The 10yr #yield is also looking pretty decent.
The 30 Yr bottomed before the others and has been leading #interestrates.
#OIL broke downtrend and has been looking better.

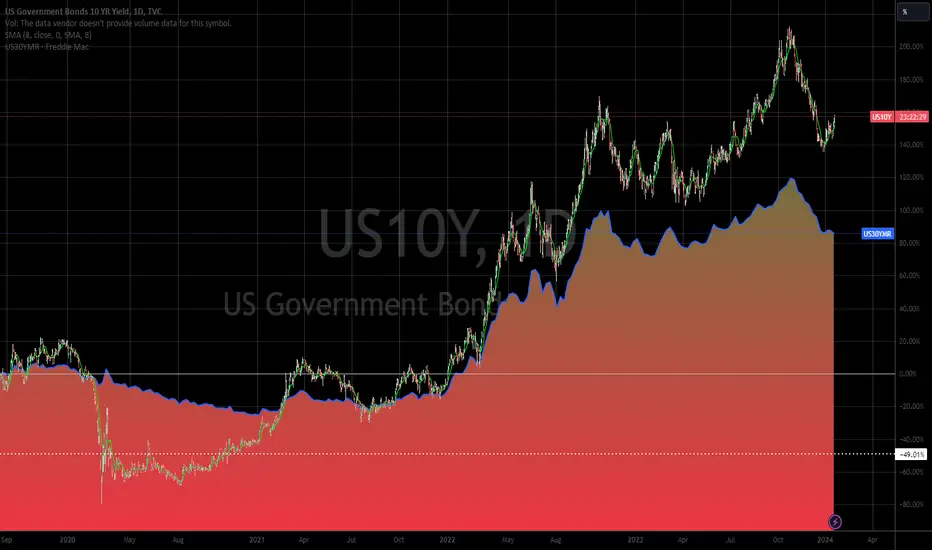
Recession soon?Today looks very similar to the .com crash and GFC periods. We are showing signs of uninversion of the 10Y and 2Y which has previously signaled a recession. After the volatility of the inversion calmed down, the cross on the 2W stoch RSI signaled the start.

US 10Y TREASURY: the last call for 4.2%?Although the US equity market was strongly supported during the previous week, where one of the reasons was expectation on forthcoming rate cuts, still, the US 10Y Treasuries reacted in a bit different manner. Yields were testing the level of 4.2%, after successfully breaking the 4.0% level. As per CME's FedWatch tool, traders on the futures market have decreased their expectations for the rate cut in March this year. The percentage dropped from 71% to 53% within a week. This came after the jobless claims were released, which were at its lowest level since 2022. A too strong jobs market might be an indication of increased spending and in this sense, potential for the increased inflation, which might impact Fed's decision to postpone rate cuts for the second quarter of this year.
The level of 4.2% will be tested at the beginning of the week ahead. However, there is a relatively low probability that this level might be breached in a week ahead. In this sense, yields might look toward the 4.0% support line to test it once again.

US10YBearish US10Y
Supported by technicals. Supported by other signals.
Will be good for long-dated bonds.

US10Y at major resistance? down from here.super consistent resistance/support. should keep moving lower from here.

US 10Y : "FED vs MARKETS" (...who will win?)Hello Traders!
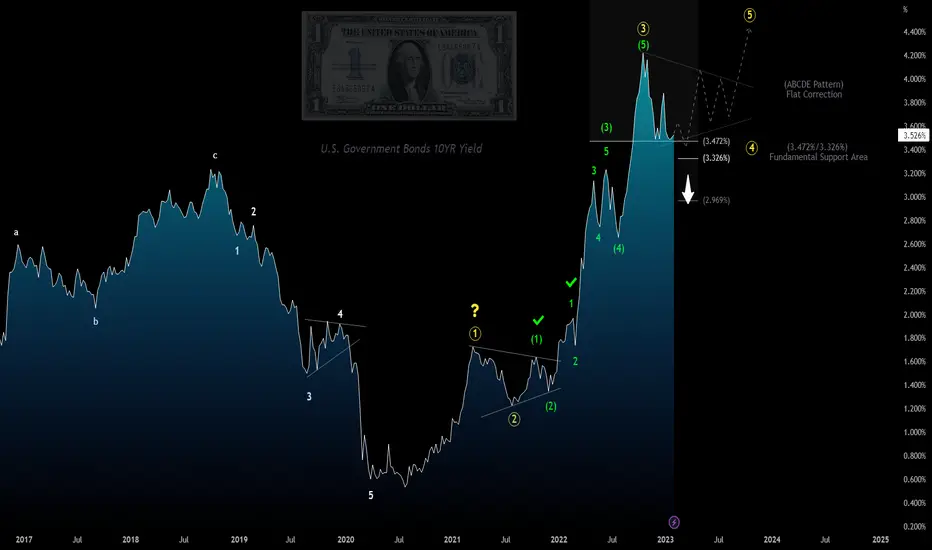
The FED's monetary policy is not convincing the markets, but Powell seems very determined to meet his inflation targets. In near term, market seems to want to counter this hawkish monetary policy, but that could change going forward. In short term, yields remain at high levels and I don't exclude that this rally could continue for the last bullish impulse with wave 5 formation.
Does this bullish pattern meet economic fundamentals over the medium term? ...What is your opinion?
--------------------------------------------------
--------------------------------------------------
...trade with care! 👍
If you think that my analysis is useful, please...
"Like, Share and Comment" ...thank you! 💖
Cheers!
Long term yields have been running, US Dollar as wellGood Morning Update
Unless this reverses it looks like it is getting stronger.
Thought #interestrates were supposedly going down?
10Yr #yield looks very good & the 30 Yr has been pumping for a bit.
2Yr stopped falling, is it bottoming here?
US #Dollar pumping as well - TVC:DXY
We've been warning.......
10 versus 2 year yieldsRecent history has shown the 10 vs 2 year yields unwinding as favorable for gold, silver and miners.
Will definitely be a rocky road, with full of turbulence.
#gold #silver #miners #inflation

US 10Y TREASURY: 4.0% testing is over?The US Treasuries ended the previous year with investors expectations on the forthcoming rate cuts, which was reflected in the Treasury yields which took the downtrend. This year, the 10Y US Treasury benchmark started by testing the $4.0% short resistance level, which ended in a short reversal further to the downside. During the previous week yields were moving within a relatively short range, between levels of 4.0% and 3.9%. Friday’s session ended with modestly lower grounds as investors were digesting the latest US inflation data released for December 2023.
As inflation is easing down further in the US, so will the investors' expectations that the Fed might cut rates sooner from the second half of this year. In this sense, the 10Y yields might test lower grounds, where 3.8% currently stands as a next target and support line in technical analysis which is pending testing.

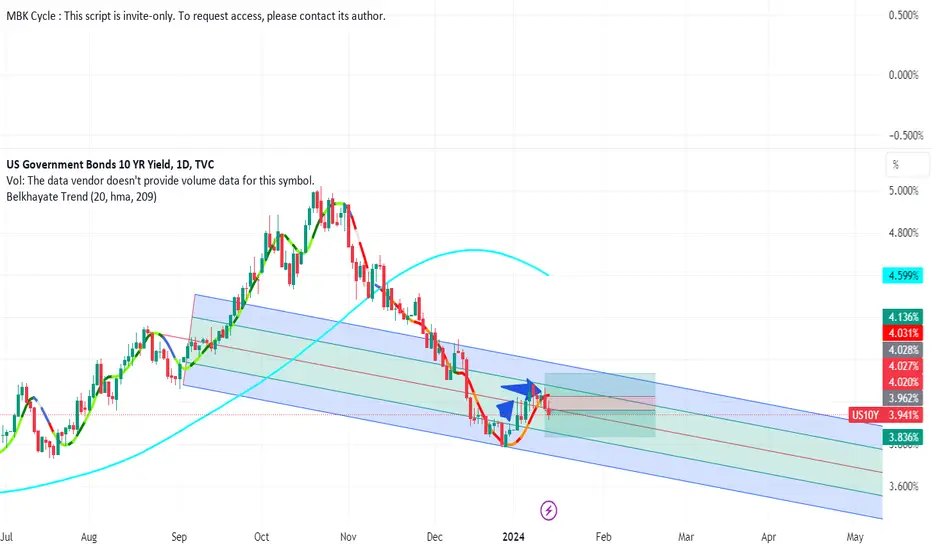
US10Y
Currently US10Y is in the selling zone, but if the red average indicated by the blue arrow is broken and we enter the green zone, the market will be in the buying phase.
US10Y: Bullish long term.The US10Y is being rejected on the 1D MA200 after a HL rebound at the bottom of the 1 year Channel Up. The 1D technical outlook turned bearish again (RSI = 42.660, MACD = -0.055, ADX = 36.524), same with the 1W timeframe (RSI = 43.184), so this is still an early buy opportunity for the long term. The 1D RSI patterns among the three bottoms so far are similar and one more pullback to the HL would be ideal for the most comfortable buy entry until the 1D MA50 is crossed. Our target is towards the 0.786 Fibonacci level (TP = 4.600%).
## If you like our free content follow our profile to get more daily ideas. ##
## Comments and likes are greatly appreciated. ##

Bonds go up, stocks go downThe 10YR Yield is retracing up with a strong bullish div on the RSI and momentum wave.
The SPX is on the opposite side.
- strong bearish div on the RSI and momentum wave.
- blue pivot point indications
- price is trading outside the BB and is closing back inside.
The SPX is ready for a big retrace.
