US10Y and DXY show no signs of stopping for the next 2 weeksThe DXY and 10Y are the cryptonite for stocks and crypto and show no hesitation in moving up. This trend line has not been broken, scary thing is the break through levels of where these can hit. DXY at 114$ has been catastrophic to everything and with inflation data we could be headed there.
US10Y trade ideas

US 10Y TREASURY: time for relaxation, or maybe not?The US inflation figures were published during the previous week, which showed that it is not going to be an easy task for the Fed to bring it back to its 2% target. At the same time, oil was traded above $90/barrel with some analysts’ prediction that it might easily reach the level of $100 till the end of this year. Taking current circumstances into account, the market was able only to move in one direction – bringing 10Y Treasury yields back toward the 4.30% level, where the benchmark is finishing the week.
Currently there is a bit of a tricky moment on the charts. Namely, 4.3% could be treated as sort of the resistance level for 10Y Treasury yields. But, taking into account that the FOMC meeting is scheduled for the week ahead, surprises might be possible in terms of a break of 4.3% level. However, if everything stays as anticipated by the market, then yields might come a bit back down to 4.2% levels.
inflation & yieldsThe Us 10 Year yield is one of the most important yields to follow.
It greatly impacts long term investment decisions in a vast array of markets; stocks, bonds, real estate.
A clear technical breakout is being observed & this could mean inflation is becoming entrenched.
Yields have a tendency to rally in parabolic fashion. if this breakout holds we can likely expect higher rates.
Dark times are coming...
- TVC:US10Y is showing significant strength on all major timeframes.
- The EMA's on the monthly timeframe broke bullish after 12,000 days (Last seen 1962).
- If the US10YR breaks the 50% price retracement, we could see between 7.25% - 15%. (Last seen 1981)
The markets are in a scary place right now. This bear market may be extended due to many factors were dealing with in 2023 (War, Virus, Inflation, Rising Interest Rates, Upcoming election, etc...).
Maybe a crash is what's needed to reset all of this chaos?

US10Y divergence suggesting "Sucker Rally" aheadDuring market crashes yields plummet along with equities in flight for safety and also they tend to lead in the decline. But here as we see 10-year yield divergence is suggesting equities can retest ATH once more before the crash. This also aligns with previous market behavior where equities rally on rate pause leading to recession - a "Sucker Rally" essentially.

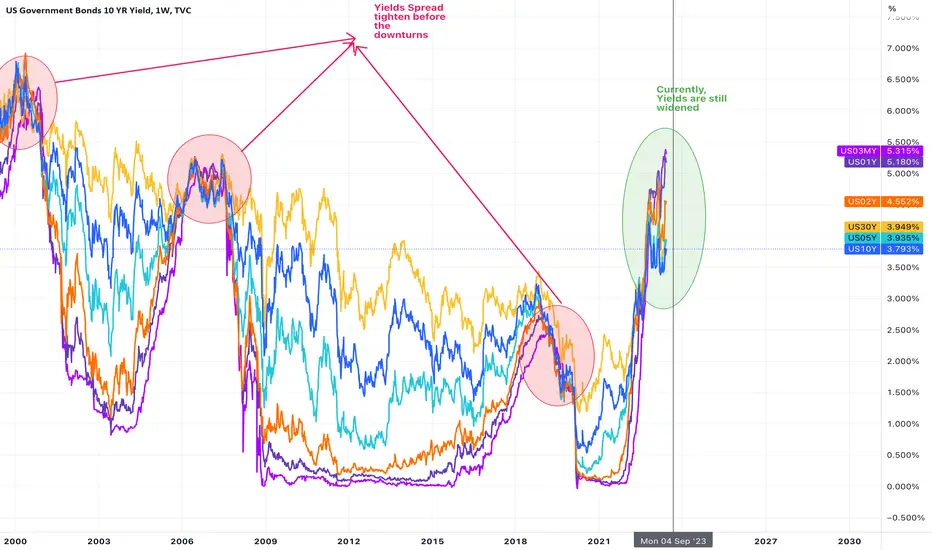
Yields Spread Market Crash AstrologyYield spreads tighten and also invert leading into a recession and it is only once they start to de-invert that any sizable decline begins once all the durations have been squeezed and there is nowhere else to run/hide for market participants. The 10Y-03M curve is of particular interest compared to 10Y-02Y, which almost always leads to a crash once that cuts above 0.
Current widened spreads suggest there is still time for any black swan event to realize. I would expect long duration to rally in the next 2-3 months to narrow the spread around ~5% range, this can occur with help from TGA refill that's occurring until the end of September. Once at the end of the fall, I think we will see trouble brewing in markets from high rates and short liquidity.
Net-net, equities, and all risk assets can float around until late August/September before any major decline can transpire.
US10Y potential tumble to the downsidesince price of GOLD has reached its lower price for the month will cause people to lose faith on US10Y and soon will divert to put their trust back on gold.

US10YHey folks i do hope everything is going well around you ......lets ckeck us10y chart as of now we are seeing bear flag on DXY and double top in us10y bond and bullish flag on Gold chart....based on these all things i conclude we can dare to expect devaluation in Dollar in midterm and increasing price in gold and commodities...... more over please consider we are getting close to election year day by day , and us goverment needs strong economy in election debates.....
GOOOOOOD LUUUUUUCK

US 10Y TREASURY: reversal is still pendingThe market uncertainty of the future course of inflation and FED`s next moves continued during the previous week, especially after the news that Saudi Arabia will continue with its decreased supply of oil by 1 million barrels per month until the end of this year. The price of oil surged on this news, putting the markets back on the negative sentiment. However, Treasury yields did not make a significant reaction to this news, as investors will probably need some more time to digest potential next Fed's move. The 10Y Treasury yields started the week around 4.18% and went back to the level of 4.30%, without a strength to break this level. They are ending the week around 4.26%.
Current charts are pointing that there is time for further relaxation in the 10Y Treasury yields. In this sense, the level of 4.0% is still pending to be tested. During the week ahead yields might again revert back toward the levels from the beginning of the week, around 4.2%, with some probability that 4.10% might be reached. A move toward the upside, in terms of 4.30% is unlikely at this moment, at least based on the charts.

US 10 Year Bond ready for downward moveFor all trade on my Auto Harmonic patterns indicator trade setup -
Risky trades can take trade after crossing 23.6% on either side and safe traders can take trade after 41% We can start buying when our Trailing SL hit at 23.6% with SL of recent low our Target will be 41%, 78.6% , 127.2% 161.8% and 223.6 % , when reversal pattern appears on chart we have to trail our SL if trailing SL hit exit from long trade and initiate sell trade ,


Buy the 10 years sometime soon?for the two year to drop rapidly ( BY Powell) there would have to be a black swan event: WW3 GF
When the 2 year crosses the 10 year that´s when you need to be paying attention as the market has gone risk off!
In times of crisis good to own the 10 year assuming the FED drops rates, Long end rates may go higher maybe 6-7%, but the opportunity will be fleeting and painful..
but eventually it could be worth the pain as the FED then cuts and equities drop.

Reversal Bars: Springs and Upthrusts: 4-2 In part one (4-1, linked) we outlined the base characteristics of spring and upthrust patterns. In part two we examine two charts that have the potential to develop the behavior, and describe why they are candidates. The two examples use daily perspective charts but the patterns are fractal and translate well to all time frames.
Many popular published strategies center around buying and selling breakouts of prior swing points or patterns and consequently is the first approach that most new technical traders attempt to implement. But failed breakouts are common, and when they fail, they often fail violently. The rapid reversal creates panic among the weak hands who entered in response to the breakout. The panic often results in significant slippage on both entry and exit when poorly placed stops are elected.
Early in my trading career I made a concerted effort to trade breakouts. Ultimately the losses convinced me that, despite what the books said, buying and selling initial breakouts was a very bad idea. Eventually I discovered Richard Wyckoff, Richard Shabacker and John Hill and began to understand why.
I flipped the script and began to develop trading strategies around failed breakouts (my favorite trades) and that entered into legitimate breakouts only after the breakout was confirmed.
Since my trading style is not constrained, I can cycle through hundreds of charts (equity, income, commodities) and time frames looking for setups and situations that fit my pre-established risk-reward parameters. Just as it is “always five o'clock somewhere,” there is also always a trade setup somewhere. You just need to put forth the effort to find it.
As I cycle through the charts that I trade, I simply monitor for markets that, after extended trends, are testing a prior high or low, or that have developed a trading range in the vicinity of an important high or low. In other words, markets that are at critical junctures in their trend where the short-term behaviors are more likely to generate signal as opposed to noise. I am also cognizant of momentum divergences, countable threes, channels, sentiment and other nonprimary factors that might strengthen my view or influence the size of the trade.
Those markets go on my "list" and I begin actively monitoring them for behavior. Note that I often monitor in one perspective lower (IE from daily to hourly) than the perspective I am trading. 10-year Treasuries and the Citi equity charts offer solid examples of charts that would go on my watch list.
One final point: In my work, market behavior is much more important to trading than my fundamental opinion. This is particularly at potential trend inflection points in daily, weekly, and monthly perspectives. Don't get me wrong, I dig it when both my fundamental and technical reads are in sync, but I typically default specific trades to behavior rather than outlook, particularly in the daily and lower perspectives.
The U.S. ten-year Treasury offers a good example of a market that would go on my list. It has described a long uptrend (in yield), there are multiple momentum divergences, the bigger pattern has unfolded in three distinct advances (labeled 1X, 2X & 3X), rates are in a seasonally bullish (rates falling) period. The news/sentiment around rates is almost uniformly bearish.
Note that the market briefly traded above the prior pivot (by 2 basis points) and then traded modestly lower. The small failure generated some selling, but the weakness has not developed the kind of follow-through (for instance a break of the uptrend along the lows of the test) that would convince me the testing process was complete.
Additionally, while I maintain the view that the long-term trend in rates has changed and that over time, they will be generally higher, there are several fundamental relationships that I monitor that may make it possible for rates to fall for several weeks/months before rising next year.
CITI Daily and Weekly:
Citi is also on my watch list. Following a long decline (see weekly) and after absorbing the supply along the downtrend line via a lateral trading range, it has now retreated into a good support zone and is quite oversold. Because of the trading range dynamics, it’s my suspicion is that it will move closer to 32 before producing a tradable spring. However, I am open to the idea that this smaller range may present a terminal spring and will be alert for setups to take advantage if it does so.
And finally, many of the topics and techniques discussed in this post are part of the CMT Associations Chartered Market Technician’s curriculum.
Good Trading:
Stewart Taylor, CMT
Chartered Market Technician
Taylor Financial Communications
Shared content and posted charts are intended to be used for informational and educational purposes only. The CMT Association does not offer, and this information shall not be understood or construed as financial advice or investment recommendations. The information provided is not a substitute for advice from an investment professional. The CMT Association does not accept liability for any financial loss or damage our audience may incur.


Second Evening Star, This one will be significant. A 2nd setting sun on the US10y. Id expect yields to have a hard tumble here. Could be risk off could be the catalyst for a rally in small caps. We will have to see the narrative around the fall.

faith of US10Yafter gold sudden bullish price volume from demanded price we could see price is rejecting ceiling price from US10Y
This chart pattern suggests yields are going higherUS10Y remains in an established uptrend on the daily chart, and Friday's bullish engulfing candle suggests a swing low has formed and more gains are to follow.
But having looked back at price action since the April low, we note that prices are yet to break the low of a bullish engulfing candle if it has formed after a pullback or period of consolidation. Granted, there are one or two of those engulfing candles that do not fit the exact description (as an open or close is out be a few ticks, meaning it has not truly engulfed). But we've relaxed the rules to note bullish candles that show clear range expansion over the prior candle.
And if that pattern persists, it looks like the 10-year yield (and likely yields across the curve) are at least going to make an attempt to retest or break their cycle highs.
us10y for gold bearish faithbasic inverse correlation towards the for XAUUSD.expecting bullish leg after bullish formation of basic price structure.
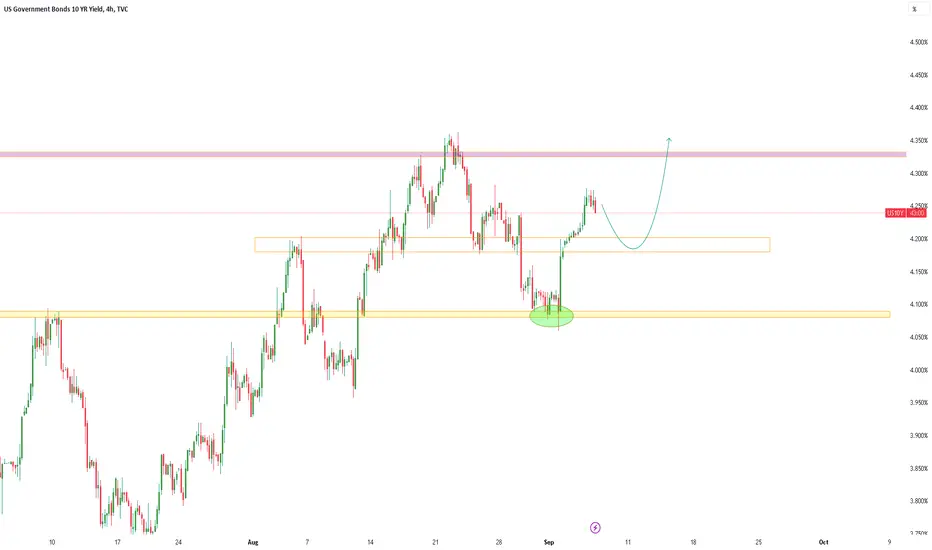
US 10-Year Yields Threaten Uptrend ResumptionA massive outside-day reversal off confluent support is now approaching a key resistance zone at 4.22/24 - look for a reaction there IF reached.
A topside breach / close above is needed to mark resumption towards 4.33.
Broader bullish Invalidation now raised to the 50-DMA (currently near ~4%).
@MBForex

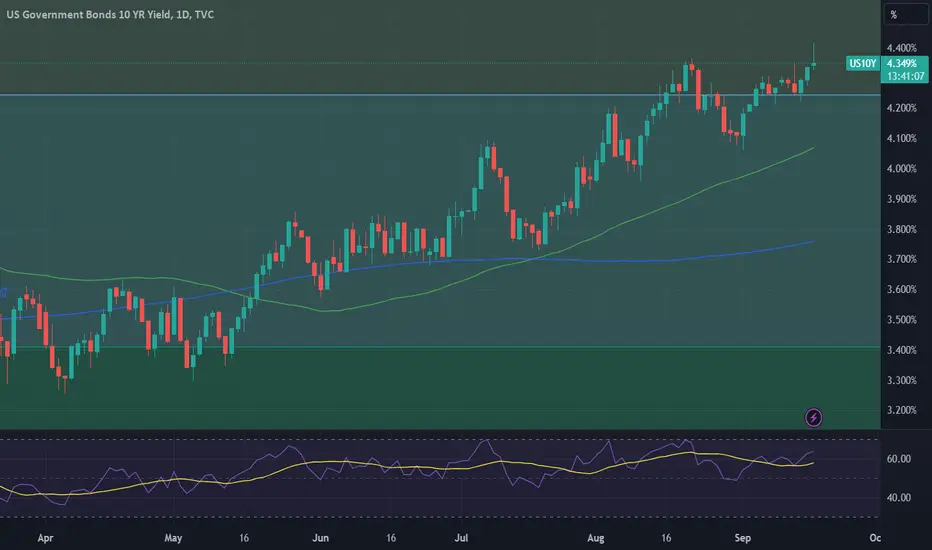
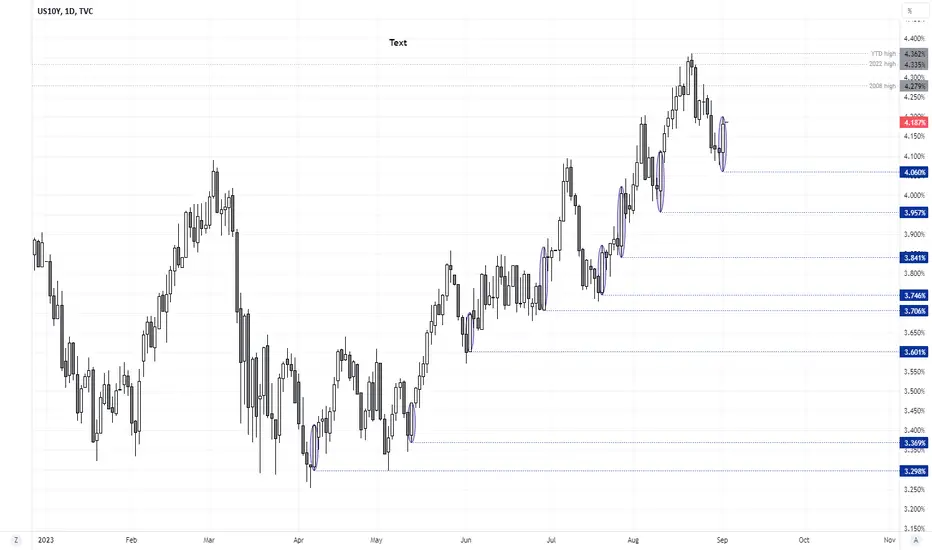
US10Y Rejection not confirmed yet. Bullish unless this breaks.The U.S. Government Bonds 10YR Yield (US10Y) is having a 2-week rejection since the August 22 High that was priced marginally above the 4.336 Resistance. However both the 1D MA50 (blue trend-line) as well as the Higher Lows trend-line that moves just below it, remain intact, maintaining the long-term uptrend.
Today is the ideal spot for a new buy entry, targeting 4.365 (August 22 High). We are only willing to turn short after the price breaks below the Higher Lows trend-line and closes a 1D candle below the 1D MA50. In that case, we will sell and target 3.810 (Fibonacci 0.5 level).
Notice also the 1D RSI which just hit its own Higher Lows trend-line that is holding since March 15.
-------------------------------------------------------------------------------
** Please LIKE 👍, FOLLOW ✅, SHARE 🙌 and COMMENT ✍ if you enjoy this idea! Also share your ideas and charts in the comments section below! **
-------------------------------------------------------------------------------
💸💸💸💸💸💸
👇 👇 👇 👇 👇 👇

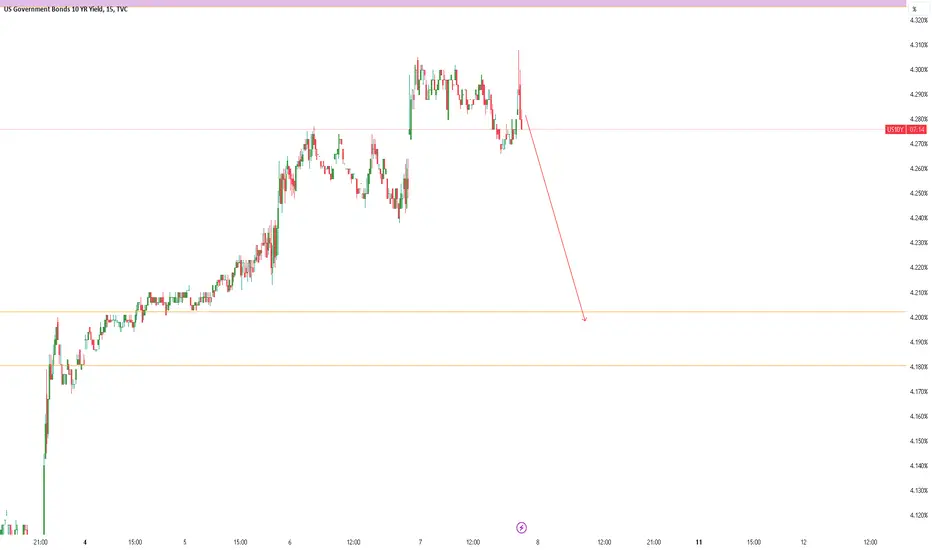
US 10Y TREASURY: targeting 4.0%?The pivotal point for markets during the previous week was the release of the unemployment rate in the US for August. The rate was increased above market expectations to the level of 3.8%. This was sort of a surprise for markets, where the majority of participants revised their estimations, anticipating that Fed will not hike rates at September`s meeting. The odds for such a decision are currently very high, reaching 93%. Treasury yields also reacted with modest relaxation. The 10Y Treasury rates made a move from 4.25% down to 4.063% as of the end of the week.
Current charts are pointing to a higher probability that 4.0% might be the next target for 10Y yields. This level might be tested in the week ahead. A move toward the opposite side might lead to 4.20% which could be tested for one more time

10 Y Treasuary Up by +1.7%How can you tell whether a price is in
an uptrend?
--
In this video we tackle this question
--
To learn more
watch it now
---
Disclaimer:
Do not buy or sell anything as this not financial advice please
do your own reasearch before you trade
--
Cheers,
Lubosi Bonds
