US10Y trade ideas
Decline in the 10-year Treasury yieldsThe US office market is facing challenges, with a decline in the 10-year Treasury yields, and the value of distressed US offices reaching $24.8 billion, surpassing that of malls. This trend indicates a severe challenge in the distressed office market.
Distressed offices refer to office buildings facing rising vacancy rates, declining rental income, and financial difficulties. Over the past few years, the demand for office buildings has declined due to the accelerated trend of remote work and increased economic uncertainty, leading to distress in many office buildings.
The reflection of this data suggests that the shopping center industry is no longer the primary focus in the commercial real estate market, as distressed offices have become the center of attention for investors. Investors' focus on distressed offices may stem from their potential investment opportunities, such as acquiring undervalued office buildings and gaining returns through leasing and repositioning.
Due to lackluster new housing data, the US Treasury 10-year yields experienced a decline on the day.
The disappointing new housing data may trigger market concerns, indicating a sluggish performance in the real estate market. Investors typically pay close attention to the performance of the real estate market as it has significant implications for interest rates and economic growth.
Treasury bonds are essential investment instruments, and their yields are considered indicators of market sentiment and investor risk appetite. When new housing data shows signs of weakness, investors may lean towards purchasing safer assets such as Treasury bonds as a hedge.
However, it is important to note that a single data point cannot entirely determine market trends. Fluctuations in Treasury yields are influenced by various factors, including inflation expectations, monetary policy, and the global economic environment. Therefore, investors should consider multiple data points and market factors when making decisions.
In summary, the US Treasury 10-year yields declined on the day due to the release of disappointing new housing data. Investors expressed concerns about the sluggishness in the real estate market, potentially leading them to favor relatively safer assets such as Treasury bonds. However, fluctuations in Treasury yields are influenced by multiple factors, necessitating a comprehensive consideration of other data and market factors.

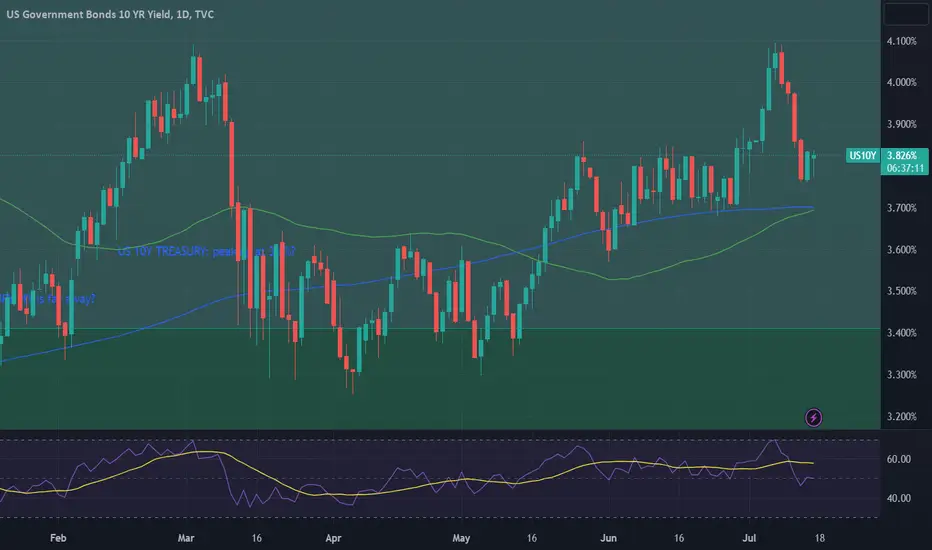
Digital and technical analysisWe notice that there is a divergence and that we are in a major correction

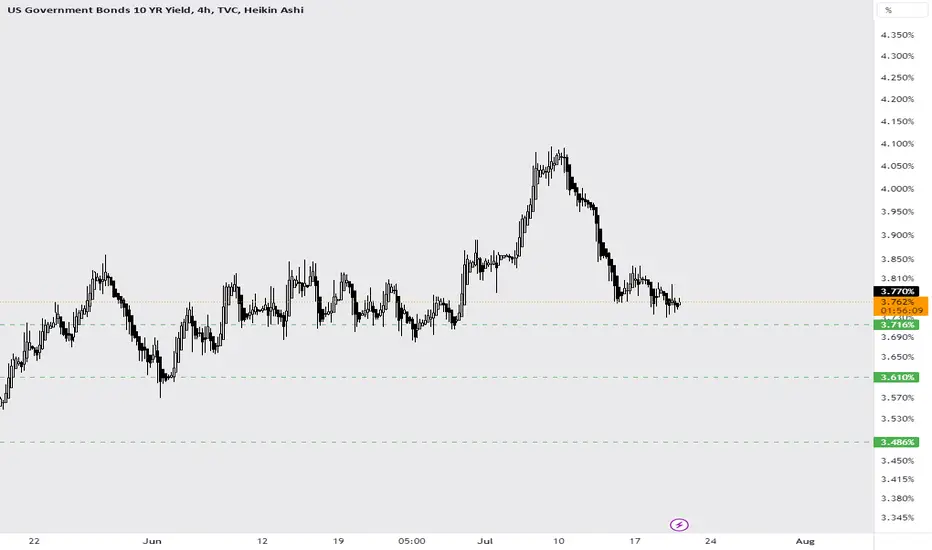
US 10Y TREASURY: waiting for Fed Debate over the question whether FED should further increase interest rates or not is still quite active among economists. A Nobel-prise winner and economist Christopher Pissarides is of the opinion that there is no need for the US to further increase interest rates, as noted in an interview with CNBC. Many other influential economists share his opinion. However, Fed Chair Powell previously noted that two more rate hikes should be expected till the end of this year. At the same time, CME's Fedwatch is showing investors expectations of 92% for a 25 bps rate hike at July`s FOMC meeting. Until the final decision, US Treasury yields might express higher volatility, as seen during the previous week.
10Y US Treasuries reached the level of 4% two weeks ago, still, during the previous week, yields have dropped to the short term stop at 3.8%. Lowest weekly level was at 3.76%. Volatility around 3.8% might also continue during the week ahead. At this moment on charts, there is a low probability that yields might return to 3.6%. They will rather oscillate around 3.8% or higher, waiting for the FOMC meeting as of the end of July.
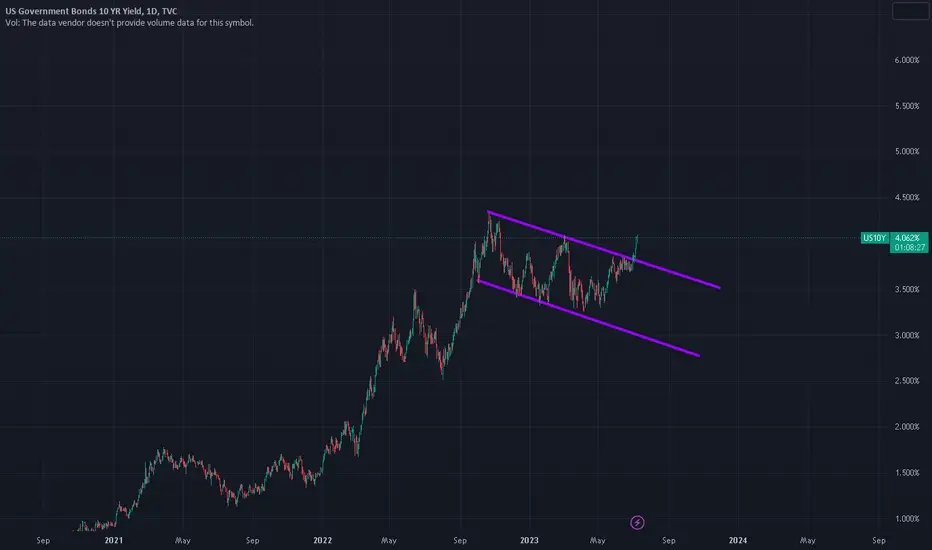
US10Y A break below the 1D MA50 will trigger a 2nd sell-off.The U.S. Government Bonds 10YR Yield (US10Y) is approaching the 1D MA50 (blue trend-line) that has been supporting the price action since May 16. The long-term trend since the October 21 2022 market top has been bearish, guided downwards by a Lower Lows trend-line but since February it has transitioned into a Rectangle. The recent July 07 High was a direct hit at the top of the Rectangle, so this week's rejection comes as a very natural consequence.
If the price closes a 1D candle below the 1D MA50, the 2nd part of the Rectangle's bearish leg will most likely be triggered. As you see during this long-term pattern, we've had two -19.70% decline sequences and if the current one turns out to be of that magnitude, we are looking at a 3.300% target.
Note that 4 days ago we formed a 1D Golden Cross, technically a bullish pattern, but the previous 1D Death Cross (bearish pattern) turned out to be the Rectangle's bottom. On that notion, the Golden Cross may have formed the top.
-------------------------------------------------------------------------------
** Please LIKE 👍, FOLLOW ✅, SHARE 🙌 and COMMENT ✍ if you enjoy this idea! Also share your ideas and charts in the comments section below! **
-------------------------------------------------------------------------------
💸💸💸💸💸💸
👇 👇 👇 👇 👇 👇

If yields make a new high I think they'll fly. If we draw a fib from the high to low of the last leg into the low in yields we can see the current bounce is off the 127 fib.
Most often when this is a correction the high comes around 161 (Which would be 7%). However, i find more often when we have a 127 bounce the 161 breaks and the following fibs hit.
If this TA norm plays out, it'd imply the FED is far from finished.

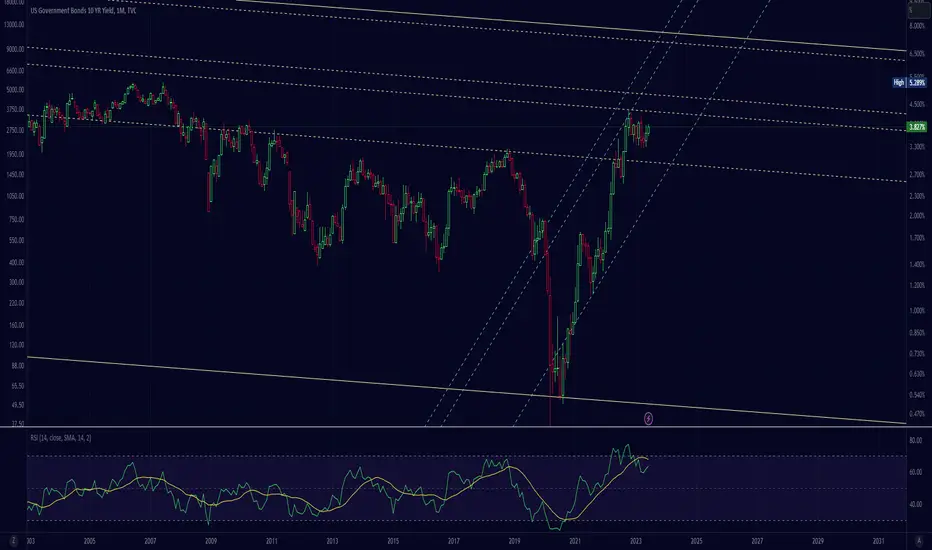
US 10Y yield stick peak cycleUS 10Y yield long-term remain uptrend but we look like stick peak cycle.
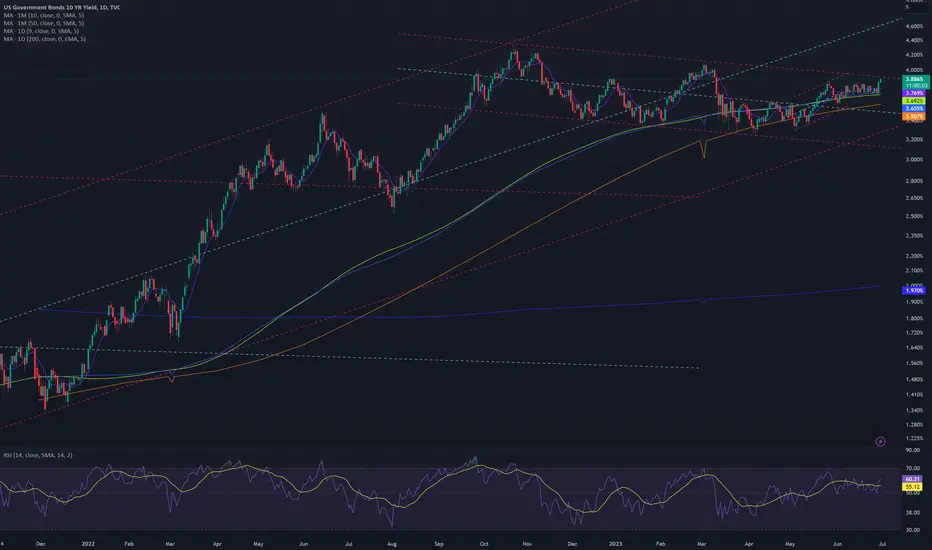
We recommend US10Y yield turn down SMA200 day at 3.70%.
US 10Y yield will be a risk of dropping to test the support at 3.30%.

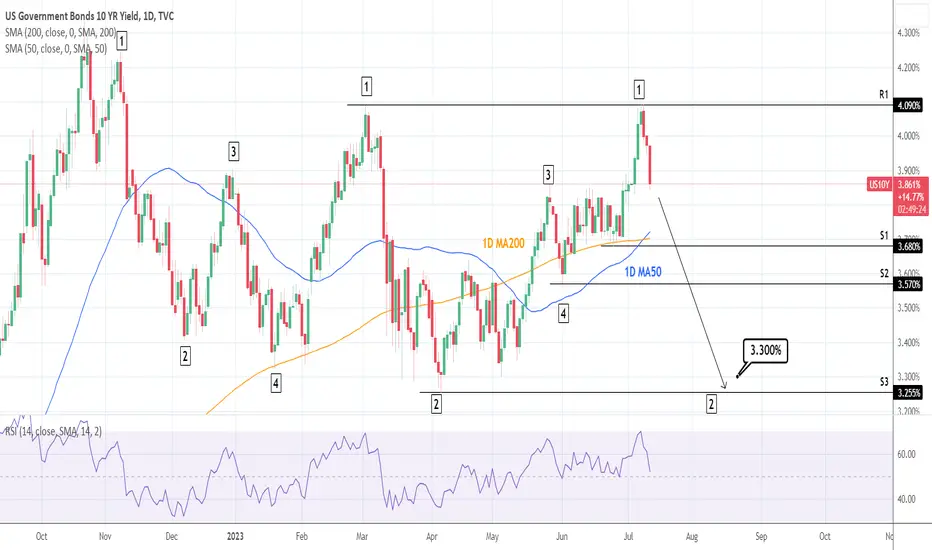
US10Y: Excellent long term sell opportunity.The US10Y turned neutral on the 1D timeframe today (RSI = 51.795, MACD = 0.074, ADX = 33.857) after it got rejected on R1 two days ago. It is likely to see a sharp fall as on the March 2nd rejection, and in that case S1 and S2 won't pose any bullish pressure to the downtrend, nor should the 1D MA50 and 1D MA200, which in the past 12 months haven't had any such significance.
Consequently, we consider the current level early enough for a low risk sell position on the long term, targeting the S3 (TP = 3.300%). As you see, the trading structure follows quite similar legs since November and right now we are most likely on a leg 2.
## If you like our free content follow our profile to get more daily ideas. ##
## Comments and likes are greatly appreciated. ##
10yr likely to rest and continue higher10yr likely to rest and continue higher. During the cool-off i expect spx to spike 6-7k. Then 10yr to 10%, spx below 2k.
Stay safe
Good luck

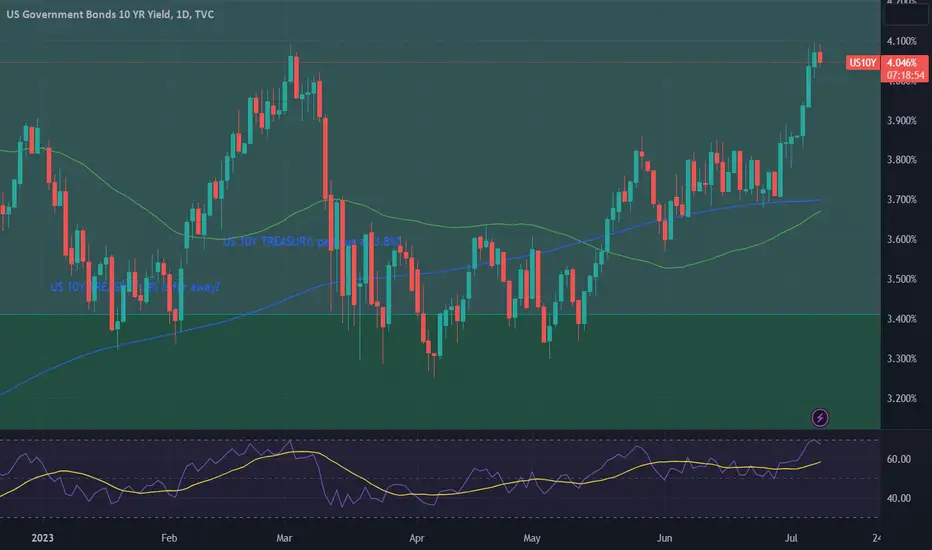
US 10Y TREASURY: 4% will holdFor some time charts were pointing to a potential for US10Y to reach 4% level, which finally occurred during the previous week. Job figures released for June show that average hourly earnings continue to be increased, 0.4% m/m in June or 4.4% on a yearly basis, which might bring inflation further to the higher grounds, which will push FOMC to further increase interest rates. Market sentiment for an increase in July reached 92%, but whether the Fed will have the same perception is about to be seen as of the end of July, when the FOMC meeting is scheduled.
10Y Treasuries started the previous week around 3.8%, however, after released jobs data, yields jumped to the highest weekly level at 4.09%. Considering current sentiment, it could be expected for yields to continue to be elevated during the week ahead. At this moment, there is decreased potential that they might revert to the previous, 3.8% level.
US10YHi ,,,, us 10 year bond yield break this bullish flag and it could put more pressure on stock market and the shares like TEsla which I am bearish on that ......
the us economy players are going to take the risk off the table be aware of that ....
Good luck ...
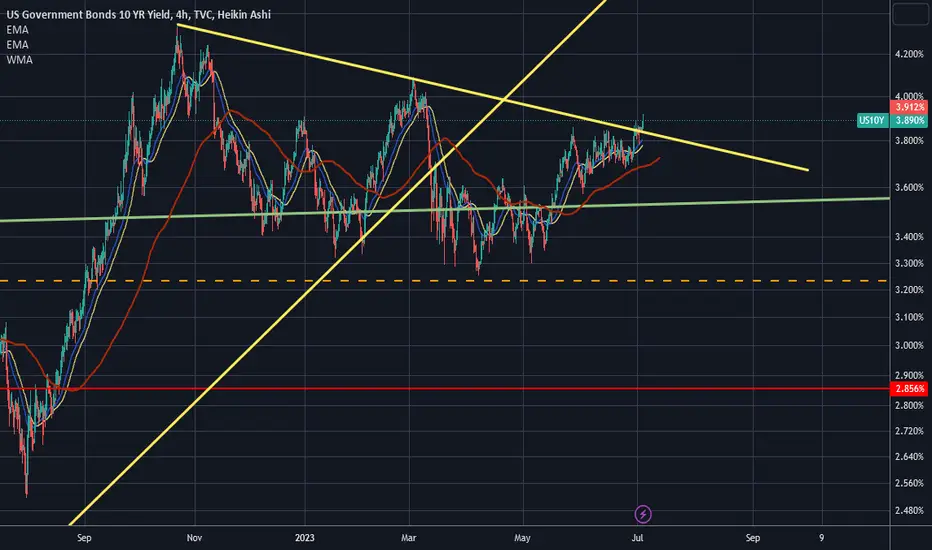
US 10Y yield levels following the break of its 9-month dtrendDisclaimer:
The information posted on Trading View is for informative purposes and is not intended to constitute advice in any form, including but not limited to investment, accounting, tax, legal or regulatory advice. The information therefore has no regard to the specific investment objectives, financial situation or particular needs of any specific recipient. Opinions expressed are our current opinions as of the date appearing on Trading View only. All illustrations, forecasts or hypothetical data are for illustrative purposes only. The Society of Technical Analysts Ltd does not make representation that the information provided is appropriate for use in all jurisdictions or by all Investors or other potential Investors. Parties are therefore responsible for compliance with applicable local laws and regulations. The Society of Technical Analysts will not be held liable for any loss or damage resulting directly or indirectly from the use of any information on this site.

us 10 year bond yield go to 5.00-5.25%us 10 year bond yield break up sideway down channel and above SMA 200 day. We think us 10 year bond yield have go to 5.00-5.25% form 4.00%


INTERMARKET ANALYSIS : TREASURY YIELDS VS DOLLARThe TVC:US10Y have taken out a major swing low and made some rally to the upside. ThoughI still expect more rally to come, which in my opinion, would eventually come
If the TVC:US10Y rallies to the buyside Liquidity at rates of 4.089% and 4.335% respectively, then I am expecting the price of dollar to rally to the upside
This analysis explanation would simply make me Bullish on TVC:DXY and bearish on all other asset classes

10 year yield pops above channelCould be that interest rates and yields are on the rise again with todays small but noticeable pop above this 'bull flag' style parallel channel.

Knock Knock Who is there? it is me, US10Y 4.2%Knock knock.
Who's there?
I. O.
I. O. who?
Me.
When are you paying Treasury holders back?
Never!
Bullish Breakout ...to be continued...
The information and publications are not meant to be, and do not constitute, financial, investment, trading, or other types of advice or recommendations.
SPX: MAKE A MONTHLY TREND TOPHi everyone, im a portfolio manager. Today, i send you a warning to create a peak of the S&P500 index.
Careful.

US 10Y TREASURY: staying elevated The resilience of the US economy is evident in the latest posted economic figures. Both business and consumer sentiment is improving, while inflation, expressed through PCE continues to slow down. Still, the pending issue is what the FOMC will do at their meetings till the end of this year. As per Fed`s Chair Powell comments, two more rate increases should be expected. Whether that will actually occur, is to be seen till the end of this year, still, possibility of “soft landing” holds.
The 10Y Treasury ended Friday`s trading by reaching a level of 3.89%. It seems that the market is anticipating further rate hikes which might stay for a longer period of time at higher levels. With this move, a new chapter on charts was opened, in which terms, a road toward the 4% is now open. This level might be tested in the coming period. As for the week ahead, 10Y yields will open at level of 3.90%. It could not be noted at this moment whether yields will go higher from this level. In case of a short reversal, 3.8% will be tested, with lower probability that yields might return to the 3.6% level.

US10Y for shits and gigglesLet's see if it's accurate in the future since right now it looks like the mad market continues.
Ten year yield testing this channelThe US treasury bond ten year yield has been in a down trend channel for the last 9 months in the context of an uptrend that started in 2020. This could be a bull flag. The price now is at the top resistance line of that channel. A breakout could indicate higher inflation and interest rate expectations.
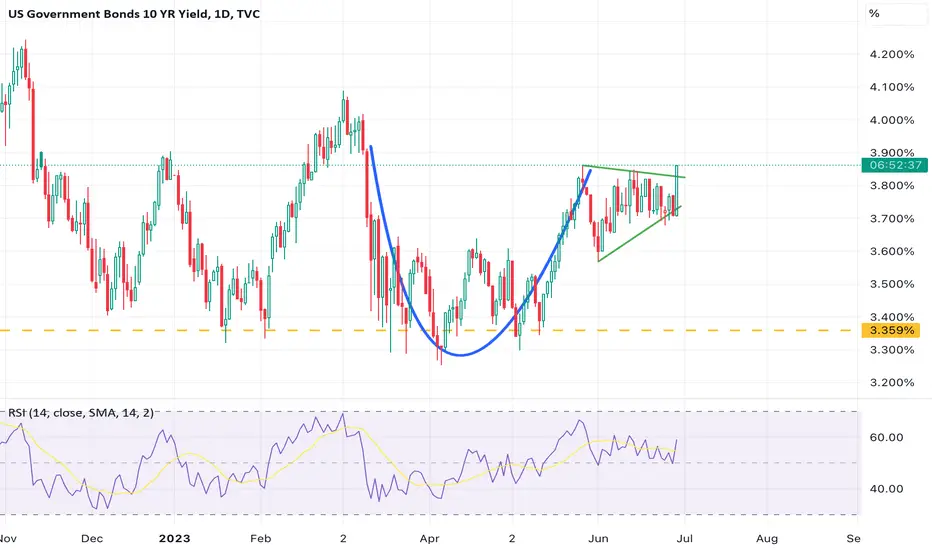
us 10yr looks like it breaking out from the cup and handle patteTVC:US10Y looks like it breaking out from the cup and handle pattern and could be on its way back to 4.1%
US 10Y yield looks to be failing at its downtrendDisclaimer:
The information posted on Trading View is for informative purposes and is not intended to constitute advice in any form, including but not limited to investment, accounting, tax, legal or regulatory advice. The information therefore has no regard to the specific investment objectives, financial situation or particular needs of any specific recipient. Opinions expressed are our current opinions as of the date appearing on Trading View only. All illustrations, forecasts or hypothetical data are for illustrative purposes only. The Society of Technical Analysts Ltd does not make representation that the information provided is appropriate for use in all jurisdictions or by all Investors or other potential Investors. Parties are therefore responsible for compliance with applicable local laws and regulations. The Society of Technical Analysts will not be held liable for any loss or damage resulting directly or indirectly from the use of any information on this site.
