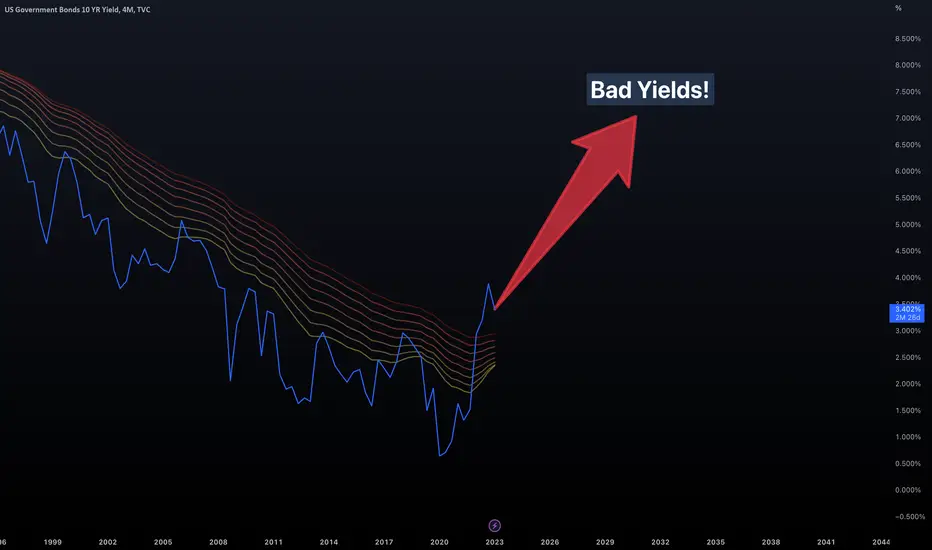
The Good, the Bad and the Ugly YieldsI have this question... Why are high yields bad? What is bad?
We are in a period of big changes. There are lot's of balances changing, one of them is money. We have just passed (?) the biggest monetary experiment ever (QE) and we are about to enter the successor to that experiment, digital money. Digital money conveniently came about just at the time when hyperinflation became an expected reality. If you talked about hyperinflation 4 years ago, you were crazy, now it is expected (and perhaps actually coming).
... Instinct tells us that the unknown is a threat, rather than an opportunity. Instinct slyly and covertly compels us away from change and progress. ...
-Dr. Breen
In the center of the stages is the paradigm shift in yields. After decades of consistently lower yields, now we are expecting consistently higher ones. Many (including me) have prejudged themselves into be lie ving that high yields are inherently bad.
I cannot conclude into what high yields are bad at. The title suggests that they have 3 faces, good bad and ugly. I can conclude that now, like always throughout history, we are rolling in a cycle.
Some things have changed in unpredictable ways. This unorthodox chart shows us that this year, we have lived through something unique. Perhaps this will be the way things move forward.
From the charts above I have tried hard to conclude into something. The only thing I have learned is the following:
Bonds are the new equities.
In QE world, lower yields made more money. How? Money printing and borrowing needs low yields for it to be popular. Immense liquidity bubbled everything and productivity skyrocketed. QE is the fuel of globalism. Equities paid out dividends, so higher equities led to even more money.
In QT world, higher yields make more money. How? Money burning and lending needs high yields for it to be profitable. Money makes more money, and every day it makes even more money. Commodity producers (GOLD*PPIACO as an example) and wealthy individuals/corporations/nations can enjoy this new era. QT is the fuel of war. Everything is precious and everyone fights for it.
In a globalized world, you could make money by being an intermediate entity. Now to make money you must actually own the resources and money. Rich get richer, and poor get poorer.
This is the purchasing power of the consumer dollar. Poor get poorer...
Poor get poorer when rich get richer.
These charts above are simple to understand and analyze. Down below I will add some of my favorite charts. These charts calculate the value of commodities compared to equities or money supply.
Commodity production bull-flags against equities.
Commodity production bull-flags against money supply itself.
The bull flag is against yields as well.
True Production Cost (PPIACO*yields) is bull-flagging (?)
PPIACO is used as a historical alternative to USOIL. For some reason, we cannot perform old historical calculations using oil.
They show that the commodities prove a big motive for everyone. Especially to those who seek war.
Would anyone in their clear mind expect WWIII to be talked about in the 2020s? With the knowledge we have collected throughout all these years, this would be out of the question! Yet, here we are, casually talking about it. Again, changes are happening but we are stuck in a cycle. All we can do about it is to understand where we are, and not constantly deceive ourselves and others into thinking otherwise. So there is a clear benefit into just realizing where we are, it is not financial profit, it is speaking truth.
Conclusion? This is a zero-sum game for consumers. Also, with bonds we are committing hubris. Bonds is a mechanism that helps money itself make more money.
Have you heard about the Ancient Greeks? They talked about the fact that when money makes money, it is Hubris (something like sin, only worse).
Equities gave more output than there was input, if someone includes long-term dividends. You working and making money is not Hubris (according to Ancient Greeks). Making a system which enables money to make money, then you commit Hubris. Consistently higher yields will help money make even more money.
Equities are facing Nemesis (compared to bonds). Bonds have just now committed Hubris. There may be many years until they face Nemesis as well.
Tread lightly, for this is hallowed ground.
-Father Grigori
PS. This movie "good bad ugly" was released in 1966, a period financially similar to the one we live now.
US10Y trade ideas
We bounce and most claim a bull market alreadySo you think we entered a V shape bull market? Lets just forget we have unsustainable amounts of debt, we gone from QE to QT and from rates at zero to world record speed increases making a 40 year long us10y breakout.

US10Y : What the Market is saying.The above chart explains.
There were 2 important events this week, the Fed raising 25bps and also the BLS delivering a 'spectacular' jobs report.
So what is the market reaction and what is the market actually thinking???
I think a simple look at the yield can tell us much. We can use it to guide our trading for the coming week.
Good luck.
P/S : As always, do not just believe what I say. Use your common sense.

The next rate cycle is going to be inflationary...We will have a deflationary crisis before super inflationary crisis. During the upcoming rate cycle we will have inflation going up at the same time as rates. Welcome to a new world. At least in the US. I've been saying this for years, higher rates only compensate inflation it doesn't fight inflation.
US10Y: Something bad is about to happenUS10Y finally catching a bounce at the 200 DMA with a daily hammer and bullish continuation in tandem with a DXY pump. Additionally, there is bullish divergence on RSI. Possible double bottom here.
Something bad is about to happen. Delayed reaction to Apple/Amazon/Google earnings? Debt Ceiling "Crisis"? Ukraine/Russia Update? 666th COVID Variant?
Won't really take US10Y to seriously unless it gets above the long term .618 fib at 3.62%, and holds it as support.

What is the Terminal Rate and Why Does it Matter?What is the Terminal Rate and Why Does It Matter?
When looking at what’s going on in the world of interest rates, it’s pretty easy to get lost in the different terms central bankers and financial media use.
Tapering, pivot , neutral rate, fed funds target range, quantitative tightening…
They don’t make it easy to understand!
But something that has become more and more key as we have gone through this (seriously) rapid rate hike cycle that started at the beginning of 2022 is where the peak in interest rates in the US will be.
This is known as the terminal rate, and we are approaching it…
Maybe.
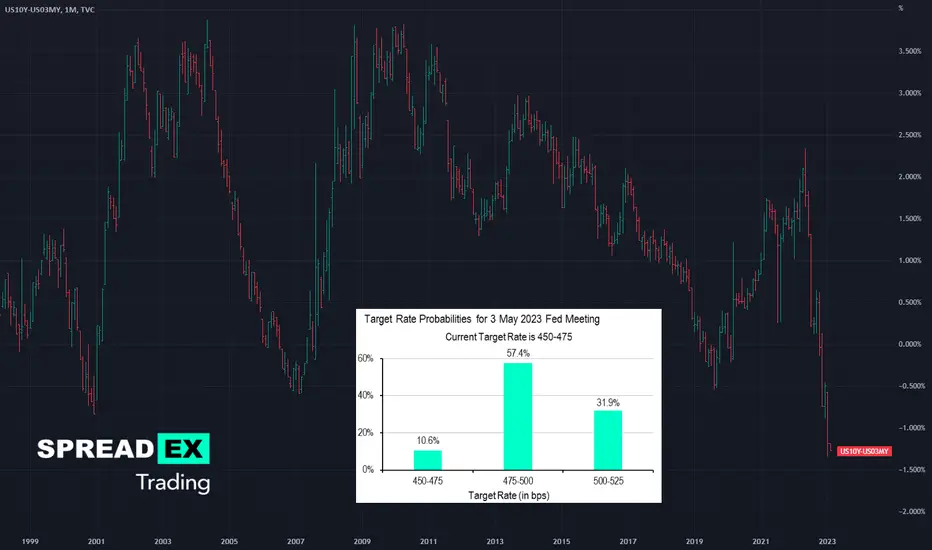
In the chart above, you can see where the market is pricing for the peak in US interest rates to be - about 5% in May with a slightly outside chance of the peak extending to 5.25% in June.
And what matters most is the change in that outside chance of the extra 25 basis points for June being more and more priced in.
If that were to happen based on the macro data, the market might start to feel like risk is most certainly off once again (stocks fall).
This is because for the last 3-4 months, the terminal rate has changed only slightly around the 5% mark, meaning the market has gotten comfortable with this data being priced into the future path of asset prices.
Any deviation, even minor, from this would be trouble, especially if the general context sours, such as if geo-political risk enters the fray (as it has over the weekend with the reports of the drone strikes in Iran).
Interest rates are effectively the barometer of the opportunity cost of holding one asset vs another so if the rate of interest is expected to increase, you can bet the market thinks it’s effectively not worth holding onto riskier assets (like tech stocks).
So if you hear the phrase ‘higher for longer’, what we really have to translate this to is ‘investors will think risk assets are more expensive to hold and so will buy less of them until it’s safe to resume buying again (which we will come onto in the next idea we post!)’.
But what, right now, could influence whether the terminal rate stays at 5% for May or gets pushed back or higher?
Enter the 3m10y chart.
This shows the spread between the US 3 month treasury bill yield and the US 10 year treasury note yield.
And right now, it is signifying that growth 2 years out (the 3m10y curve is also called the ‘public sector yield curve’) is looking rather glum, based on historical data on forecasted GDP growth from the curve structure.
This is obviously a natural phenomenon after the Fed raised rates at the front end of the curve so rapidly in 2022, but the concerning aspect is recession tends to come when the curve reverts back towards positive territory again… and it’s currently about 35bps off the January low.
What does this mean then?
Well, it could be that the Fed is going to focus more on the yield curve and how it behaves over the next few months, purely because they are 100% aware of the implications of a reversion-post-inversion yield curve: recession.
Whilst Powell pleased the markets with a more doveish tone in his press conference last night, the statement released by the Fed was very hawkish. The Fed maintained that “ongoing increases in the target range will be appropriate” to bring price pressures under control.
If the Fed is completely adamant that inflation has to get down to 2% again then this could imply the terminal rate extends beyond 5%, even if not reflected currently in market pricing.
For this to occur, there will likely have to be more strong positive prints in NFP numbers and for PCE inflation to remain elevated. It’s a tough ask, but the structural changes in the inflation backdrop and dynamic could cause this type of mess to unfold, which is naturally painful for most portfolios.
The biggest risk that we can see from a situation like this, though, is the left tail of the price distribution curve comes into play.
This is where liquidity gets extremely thin and we see 3 standard deviation negative moves, which tend to precede recessions, and end up breaking the normal distribution of asset price returns (they end up happening many times more than predicted by a normal distribution of values).
We hope this doesn’t happen, but we must start preparing for these times where the market feels stressed, because the Fed is currently not there to support with monetary liquidity!
Good luck and always remain aware!
US 10Year - 02Year - Yield Inversion (Posted 01FEB23)In this chart you can see how inverted we are and for how long on the 10-2year. I also have the 10-03mo chart that I will link to this also. This is a recession indicator. It will be interesting to follow this chart as the FOMC tries to bring the curve back under control. I will return frequently to run the "Play" and see how they do over the months!

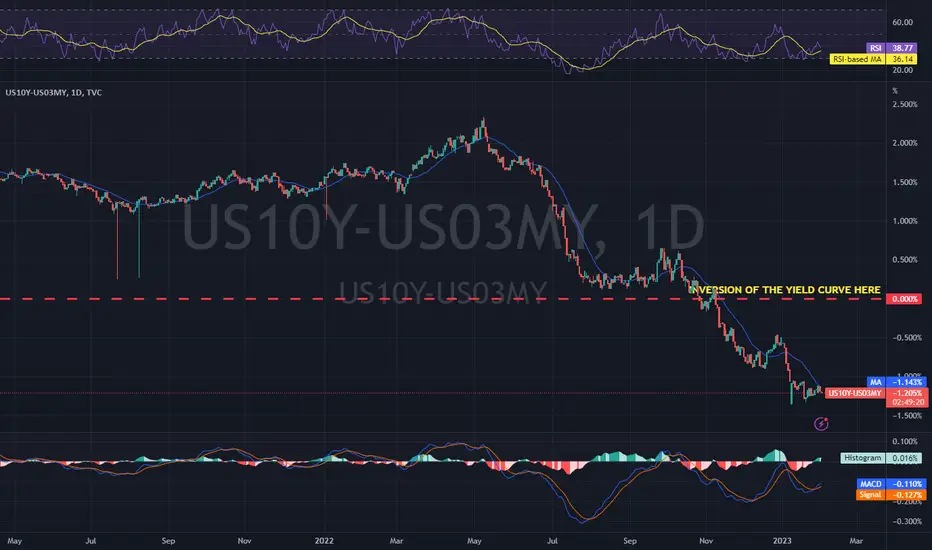
US 10Year - US03MO - Yield Inversion (Posted 01FEB23)In this chart you can see how inverted we are and for how long on the 10-3mo. I also have the 10-2YR chart that I will link to this also. This is a recession indicator. It will be interesting to follow this chart as the FOMC tries to bring the curve back under control. I will return frequently to run the "Play" and see how they do over the months!
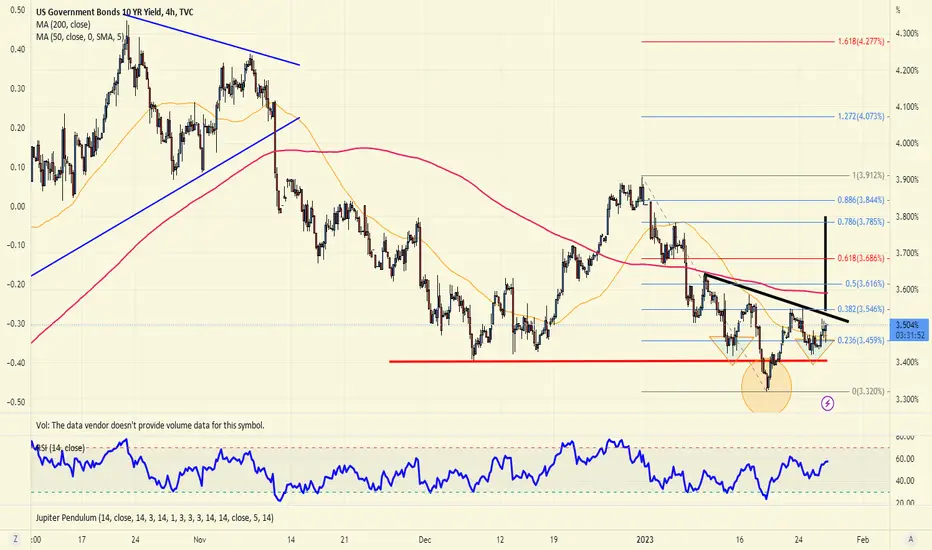
US10Y - Could Be Breaking DownCharts potentially seem to be coming together in unison here and US10Y is key...
Yields are a major factor in either releasing or inhibiting risk-on asset markets, especially crypto.
If yields pump, stocks and crypto will dump, but if yields dump then it could be a bull market for crypto, stocks, and probably metals.
And here could be the first cracks that may reveal a top, though high volatility coming in just a few hours with FOMC announcement so we will see...
...
So firstly from the low of the previous wave down we now have 3 waves up.
The 3 waves are shallow with the 3rd printing a slightly higher high.
And so these 3 waves form an ascending wedge (bearish).
And it has fallen out of the wedge and also a collapse with a bearish momentum candle (large bodied) through the 4H 50MA (4 hour, 50 moving average).
If you've been paying attention you'll know that the first wave of a continuation pattern retracement is the immediate reaction to the previous dominant wave down and so often has a lot of bounce.
But the third wave is commonly more limp as it is less reflective and is where the impetus of the dominant trend is regaining control for the next wave down.
And so we have our Adam & Eve shapes for wave 1 and 3.
Notice the lower time frame SRP shakeout reversal patterns probing through wave 1 resistance with fast liquidity tapping wicks.
And the current candle we have probe upward that may now become a SRP when it closes, with large upper wick showing selling pressure coming in through the 4H 50MA landmark.
This could be the beginning of something but until the low breaks it is not confirmed and the correction could continue.
We look at this type of content every day 👍🏻.
Not advice.

Next economic recession this year?😓🤒As Bullard (FED) spoke, the bond market is challenging the narrative of a soft landing.
The 3 month to 10 year yield curve, which has hit every recession in the last 20 years, inverts to its lowest point. Signal that the bond market expects a recession, slowdown or anything that does not mean a soft landing

US10Y: Trapped inside the 4H MA50-MA200The US10Y, a major driver for Gold, is trapped inside the 4H MA50 and 4H MA200, before tomorrow's Fed Rate Decision. This shows the market uncertainty surrounding this event as investors haven't yet chosen to pick sides. That keeps 4H neutral technically (RSI = 52.167, MACD = 0.014, ADX = 27.887) and we can only trade this with careful points that will be triggered after a level is breached.
A breach over the 4H MA200 is a buy (TP = 3.780 / the Resistance). A breach under the 4H MA50 is a sell (TP = 3.420 / the Support). Carefully sell on tight SL further breaches below the Support (TP = 1D MA200 and Main LL in extension).
## If you like our free content follow our profile to get more daily ideas. ##
## Comments and likes are greatly appreciated. ##

us10y bull flag Notice a Daily Bull Flag and bullish divergence on the #us10y as it moves opposite from our #stockmarket and #crypto

US10Y : The BIG pictureNext week we will have the first FOMC of 2023.
Market is expecting a 50bps hike to 5.00% next week.
Note that the US10Y now is trading below the 11/2022 and 12/2022 EFFR. It seems the Market is not in agreement with the Fed. The market is OPPOSING the Fed.
I think most likely the Market will continue to push the US10Y down, irrespective of rate hikes. This is in agreement with the MOVE index trending lower.
The US10Y is important if you are trading the USDJPY. You can see that it follows CLOSELY the path of the US10Y. Looking at how things are, I would think that USDJPY would continue to FALL. I will talk a bit about trading USDJPY in a different posting.
Good luck.
P/S : Do not just believe what I say. Use your common sense.

US10Y MACD crossoverUS10Y spiking again. Bullish MACD crossover noticed today. Markets to slide downwards.

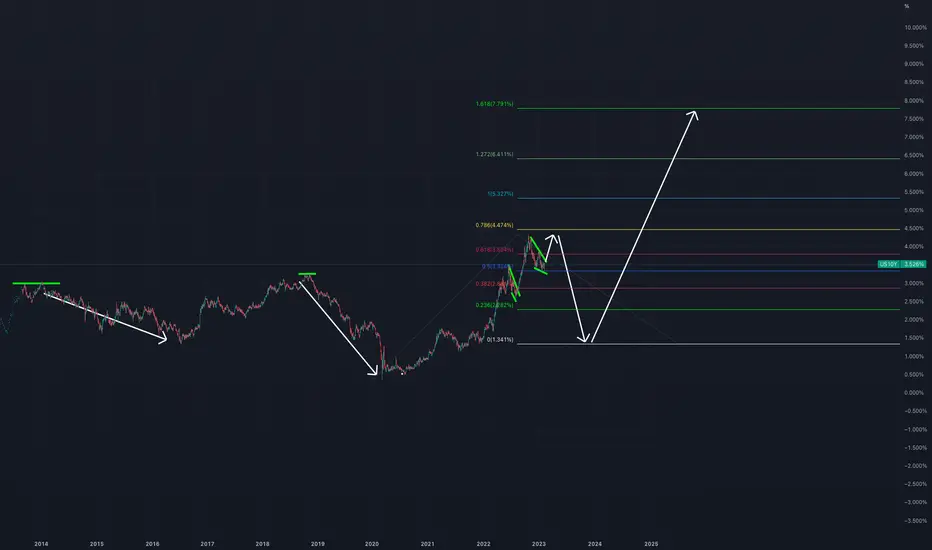
10yr Yield bullish setup. One of the traders in the Forex Analytix community (Grasshopper) pointed out that the 10yr Yields are developing an inverted head and shoulder pattern which may lead (on a breakout) to higher yields near term. Considering a false breakdown happened last week on January 19th below horizontal support, this builds the case that was the head. A break of the neckline at 3.53% could lead to a rise towards the 3.80 in the coming weeks. A rise in yields could be a warning sign for US Dollar bears too.
US10Y head and shoulders patternHello friends
As we can see, the 10-year bond is forming a head and shoulders pattern
I agree that it is bullish
I am bullish on 10-year bonds

Short- midterm bullish for stocks and cryptoBullish for stocks and crypto. Last Bear market rally before further down - Maybe

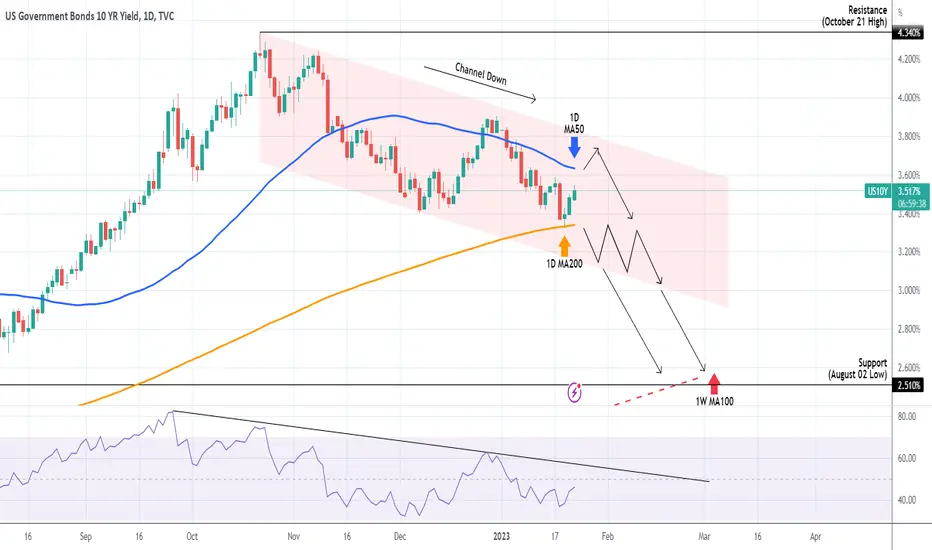
US10Y Approaching the 1D MA50.The U.S. Government Bonds 10YR Yield (US10Y) is on a 3 day rebound following a hit on the 1D MA200 (orange trend-line). The 1D MA50 (blue trend-line) is the natural Resistance, but if crossed, we can expect a long-term peak at the top (Lower Highs trend-line) of the Channel Down pattern that started on the October 21 High.
A closing below the 1D MA200 first, would largely be a long-term sell signal that could break below the bottom (Lower Lows trend-line) of the Channel and target the 2.510% Support (August 02 Low) and make contact with the 1W MA100 (red trend-line), which has been our long-term bearish target since October.
The 1D RSI can also offer sell entries on its own Lower Highs trend-line.
-------------------------------------------------------------------------------
** Please LIKE 👍, FOLLOW ✅, SHARE 🙌 and COMMENT ✍ if you enjoy this idea! Also share your ideas and charts in the comments section below! **
-------------------------------------------------------------------------------
💸💸💸💸💸💸
👇 👇 👇 👇 👇 👇
US10Y DropThe Daily timeframe is on a bearish ttrend and is making a pull back. The 4H has a double top and this confirms selling pressure. We are waiting for price to make a third touch of the trendline. This will hit out supply zone where we will wait for entry tiggers.

US10Y Dump All Year. Stocks, Crypto pump for 3 years.US government bonds are going to crash. This means nations, banks, mega corporations will pull their money out and back into the stock market. The tech money will go back into coins like truebit and future coin ftr

Big Four Macro: Bonds Part 2In last week’s macro outlook post we covered the outlook for intermediate and long bond yields. The analysis concluded that the long term technical trend has changed from lower to flat/neutral but that more work (i.e., a higher low) is needed to definitively turn the macro trend higher. That piece is linked below in the related idea section.
10 Year Yield Weekly: After peaking at 4.34% in October, 10s have declined into the first confluence of support. The confluence is defined by 2 channel bottoms, the fibonocci retracement of the last wave higher, an internal trend line (not shown and slightly violated) across the 3.04% - 3.25% highs and the last violated pivot @ 3.25%. Additionally, the move from 4.34% has covered about 100 basis points, consistent with the last two primary corrections.
This is the markets first solid opportunity since the October high to test meaningful support. Either, it bases here for a move back toward the 4.34% October high or fails and cuts much deeper, perhaps as far as the .382% retracement (2.86%) of the entire structural bear market. If the market does successfully base, the nature of the move should offer significant insight into the balance of the year.
Early in my career I was obsessed with Elliott. But after years of effort, I wasn't able to develop it as a reliable trading methodology. However, those years led me to believe that markets do often move in three and five wave sequences. But if I can't immediately identify an obvious primary sequence with a quick glance, then a count isn't reliable enough to use. Even then it is only useful only for context and then only in conjunction with a broader understanding of price volume relationships and trend.
Bond yields appear to have completed a clear five wave move from the March 2020 low to the October 2022 high, leaving them vulnerable to correction and suggesting an intermediate high that should hold for several months.
10 Year Ultra Futures Daily: When a weekly chart is resting at an important juncture, I like to drop down to the daily chart in order to assess the likely hood of it holding or failing. For this view, in order to assess volume I switch from yield to price. Ultras are into a zone of strong daily perspective resistance defined by the confluence of the .50% retracement of the 122-21 - 113-15 decline, the December 2022 high, volume profile, and the June 2022 pivot low @ 121-19. It is also taking more volume to produce gains, suggesting that supply is becoming more aggressive as the market moves higher. Three drives to a high (see linked related ideas) and the failed breakout above the 122-18 pivot all increase the odds of the resistance holding. A show of weakness that destroys the uptrend would strongly suggest a completed test and set the stage for a broader pullback.
Seasonal Tendency (US30Y Futures): Bond prices have very strong seasonal tendencies. They tend to set important intermediate highs early in the year before declining into mid-year.
Conclusions:
The monthly/macro trend has changed from lower to neutral, but yields need to make a higher low before definitively making the case that the new trend is higher.
The weekly chart is testing a solid support confluence. The outcome of that test should help define the markets behavior over the next 3-4 months. The weekly correction that began at the October high does not look complete.
The daily perspective rally that began last October is faltering. Signs of supply are developing and reliable seasonal tendencies are turning negative (yield up/price down). When combined with a strong confluence of weekly support there is a good chance that yields will begin to move back toward their October highs.
The characteristics of that rally will be important in determining if it is simply a test of the October high that eventually leads to a much deeper retracement (2.50% or so) or the beginning of a new leg higher.
A failure to hold the support confluence would strongly suggest that a much larger retracement of the two year old bear market was unfolding. Targets for that retracement would fall in the 2.25-.50% zone.
Good Trading:
Stewart Taylor, CMT
Chartered Market Technician
Shared content and posted charts are intended to be used for informational and educational purposes only. The CMT Association does not offer, and this information shall not be understood or construed as, financial advice or investment recommendations. The information provided is not a substitute for advice from an investment professional. The CMT Association does not accept liability for any financial loss or damage our audience may incur.

yield ratio vs bond priceillustrating the overshoots from yield ratio formula (1/rate) when compared to bond price formula 100 - rate

GLOBAL MARKET BOND YIELDS SIGNALS BULLISH STRENGTHThe gloabal financial markets have a direct correlation with each other
The interest rates are no exception to this rule.
Notice that the TVC:US10Y forms an SMT(Smart Money Divergence) with the rest of the Bond yields
TVC:US10Y takes out the Sellside Liqudity while TVC:GB10Y and TVC:DE10Y did not take out their respective lows. This signal Huge accumulation of longs on German and Britain's Bond Yields
This should melt Treasury Bonds and Sink the Stock Markets
