UMA/USDT – Can the 26% Pump Hold? Or Is a Full Retrace Incoming?UMA surged 26.54% from a high-confluence support zone, but price is now facing rejection near the $1.80 level. A key test is underway to determine if this rally has legs or if it was just a deviation.
Key Highlights:
Rejection wick formed at $1.80, signaling local resistance
Key support sits at $1

#UMA/USDT#UMA
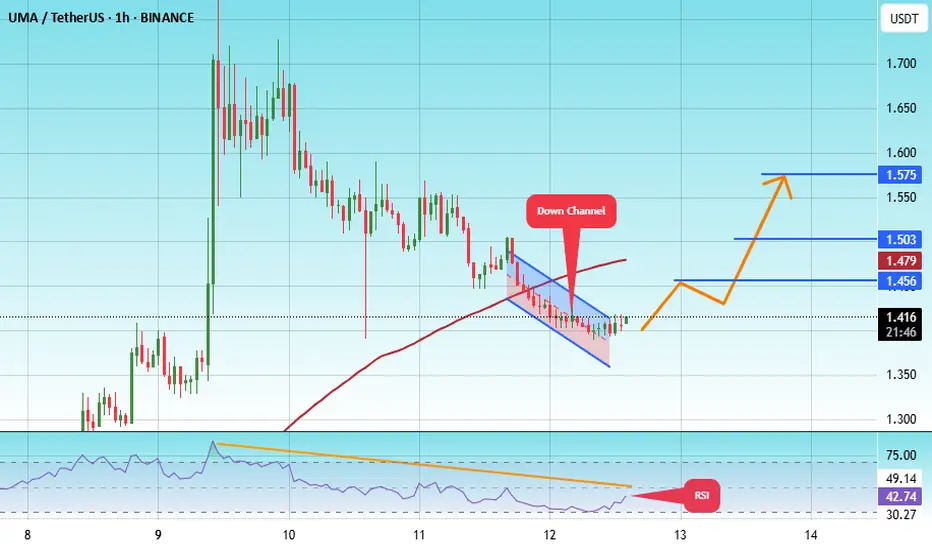
The price is moving within a descending channel on the 1-hour frame, adhering well to it, and is heading toward a strong breakout and retest.
We are experiencing a rebound from the lower boundary of the descending channel, which is support at 1.36.
We are experiencing a downtrend on the RSI
Uma Update: How To Use Moving Averages For Trading SuccessThe moving averages can be an excellent tool for trading, you can use them to confirm where the market is headed next. I no longer use them as often as before but you can use them all the time to know which pair is weak and which one is strong.
When the action is happening daily above EMA55/EMA89,
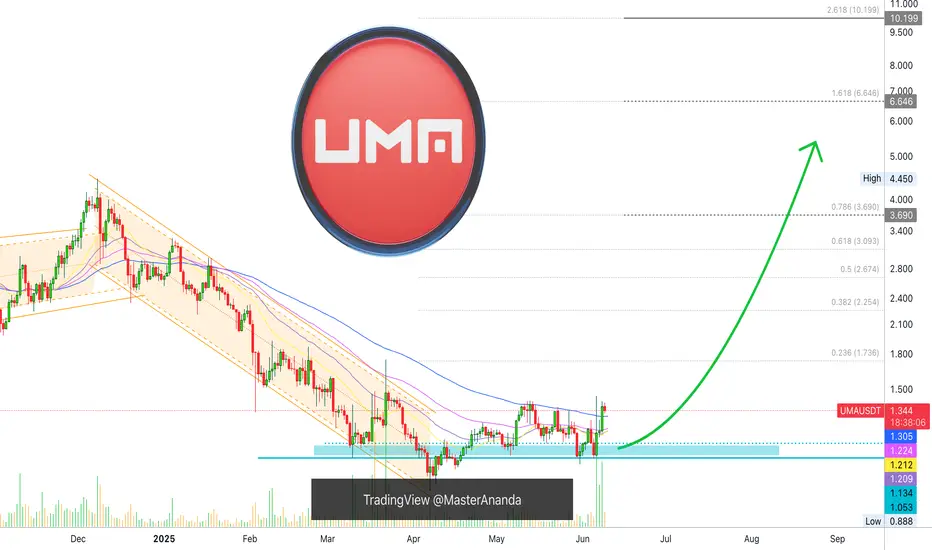
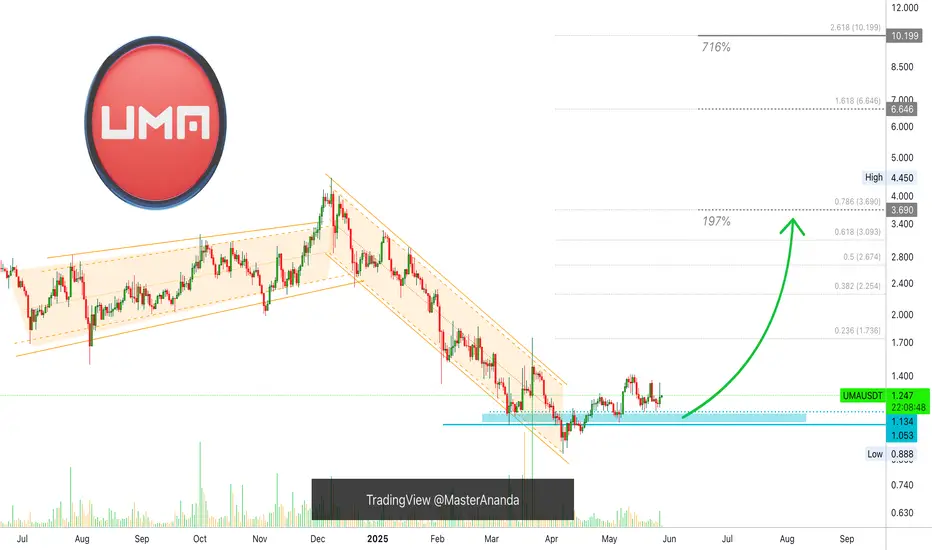
Uma Is Yet To Move: 5X Low Risk Lev. Trade Setup (PP: 3500%)This is a good chart setup and I'll tell you why, UMAUSDT is yet to move. Maximum growth from its 7-April low amounts to 58%. The current price trades some 40% above its correction bottom. Seeing some pairs growing already 300% and 400%, this means that UMAUSDT is still early. For this reason, we ca
UMA Successfully breakout this resistant lineSuccessfully breakout this resistant line with a short -term target of at least 10%+.

UMA Trendline Shattered! What’s Next for Bulls?BINANCE:UMAUSDT has broken above the key trendline resistance and is now testing a minor resistance zone.
If a candle closes decisively above this marked zone, we could see a parabolic upside move in the coming sessions.
This breakout structure, paired with strong momentum, makes it a setup worth

#UMA/USDT#UMA
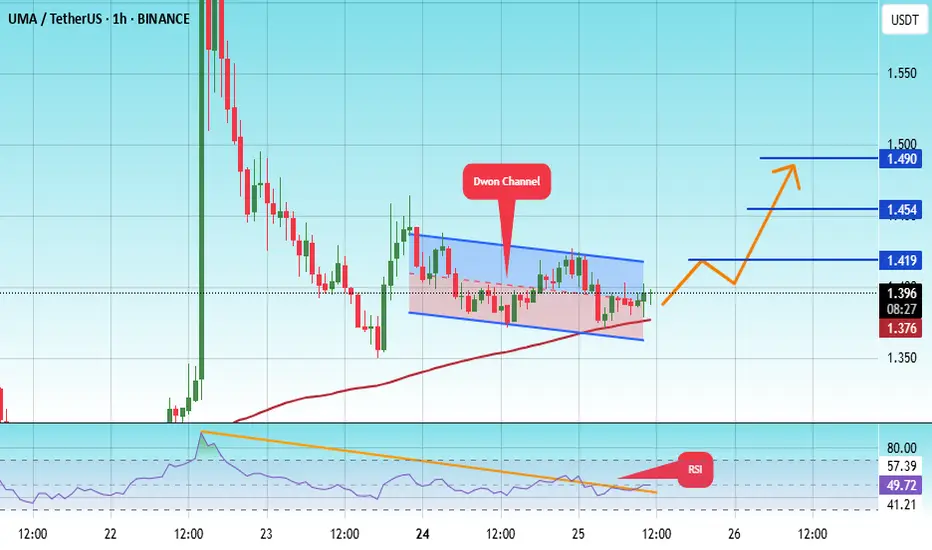
The price is moving within a descending channel on the 1-hour frame, adhering well to it, and is heading for a strong breakout and retest.
We are seeing a bounce from the lower boundary of the descending channel, which is support at 1.36.
We have a downtrend on the RSI indicator that is abou
Is UMA Losing Strength?This is a very short-term trade setup, but keep in mind that TradingView isn’t favorable toward analyses below the 1-hour timeframe.
It appears that the 1-5 impulse wave has completed, and a pullback is likely to begin soon.
Traders should be cautious and look for confirmation before entering. 📉🔍

UMAUSDT – Critical Level at 1.278!UMAUSDT – Critical Level at 1.278! 🚨
“If 1.278 breaks, we’re flipping bearish—and we won’t hesitate to short!”
🔥 Key Insights:
✅ 1.278 = Make-or-Break Level – Holding = bullish continuation, breaking = serious trouble.
✅ First Retest = High-Probability Short Zone – If we break, we wait for confir

UMA/USDT: Confirmed Breakout – Is a Major Rally Ahead?🔹 Confirmed Downtrend Breakout & Retest:
UMA has successfully broken out of its long-term downtrend and is now retesting its breakout zone, confirming strong support for a potential rally.
🔹 Descending Channel Support & Reversal Zone:
The price is trading near the lower boundary of a descending

See all ideas
Summarizing what the indicators are suggesting.
Oscillators
Neutral
SellBuy
Strong sellStrong buy
Strong sellSellNeutralBuyStrong buy
Oscillators
Neutral
SellBuy
Strong sellStrong buy
Strong sellSellNeutralBuyStrong buy
Summary
Neutral
SellBuy
Strong sellStrong buy
Strong sellSellNeutralBuyStrong buy
Summary
Neutral
SellBuy
Strong sellStrong buy
Strong sellSellNeutralBuyStrong buy
Summary
Neutral
SellBuy
Strong sellStrong buy
Strong sellSellNeutralBuyStrong buy
Moving Averages
Neutral
SellBuy
Strong sellStrong buy
Strong sellSellNeutralBuyStrong buy
Moving Averages
Neutral
SellBuy
Strong sellStrong buy
Strong sellSellNeutralBuyStrong buy
Displays a symbol's price movements over previous years to identify recurring trends.