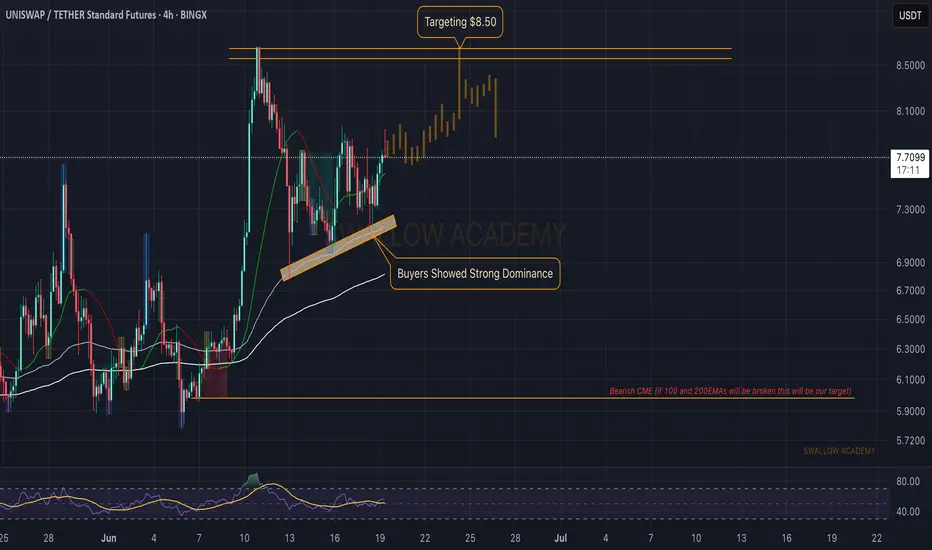
Uniswap (UNI): Buyers Showing Strong Dominance | Aiming at $8.50Uniswap is showing strong buyside momentum where recently near 100EMA we saw how dominant the buyers were, which is giving us a sign of possible further movement to local resistance area, so that's where we have set our targets as of now.
Now if we see any signs of weakenss then we will be shiftin
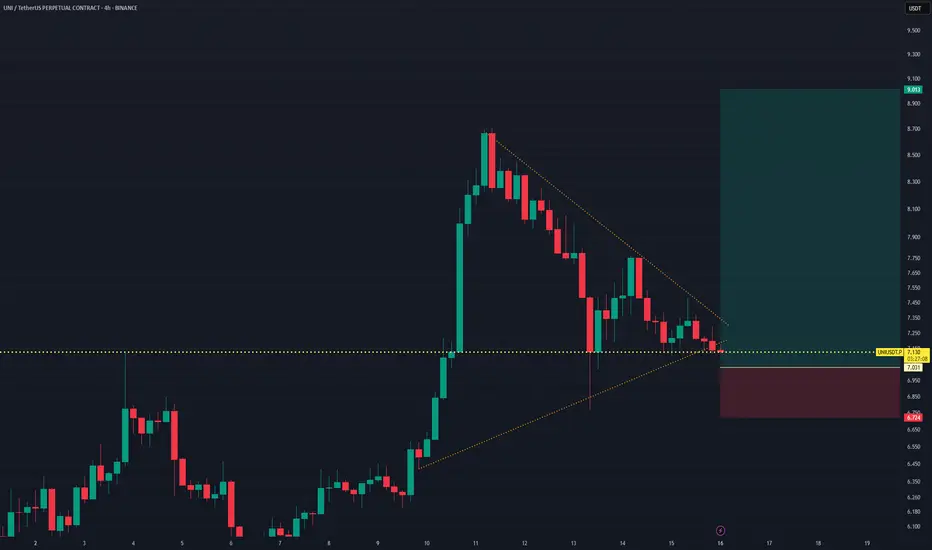
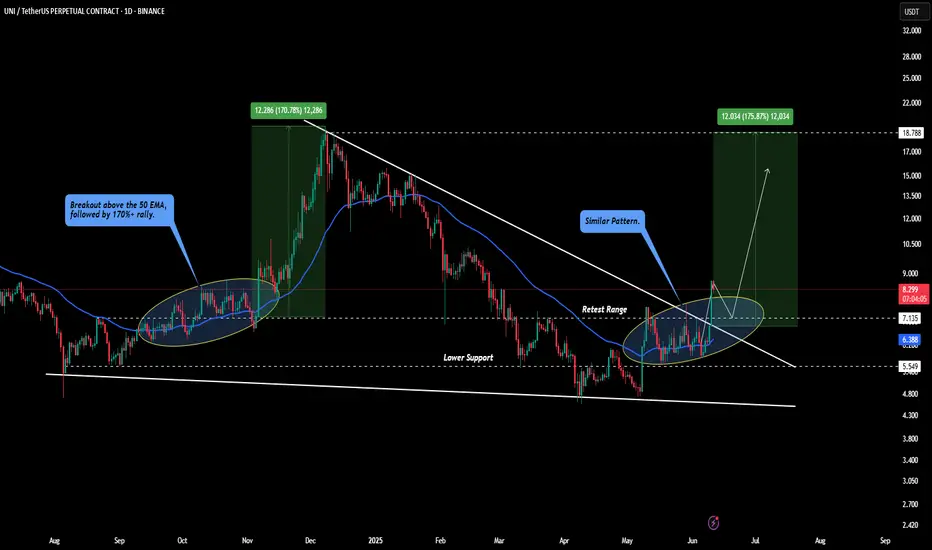
UNIUSDT Perpetual – Descending Triangle Breakout WatchUNIUSDT is currently testing the apex of a descending triangle pattern, with price compressing between a series of lower highs and a strong horizontal support near $7.13. This setup is a potential breakout trade in anticipation of bullish continuation.
Trade Details:
Position: Long
Entry: $7.137
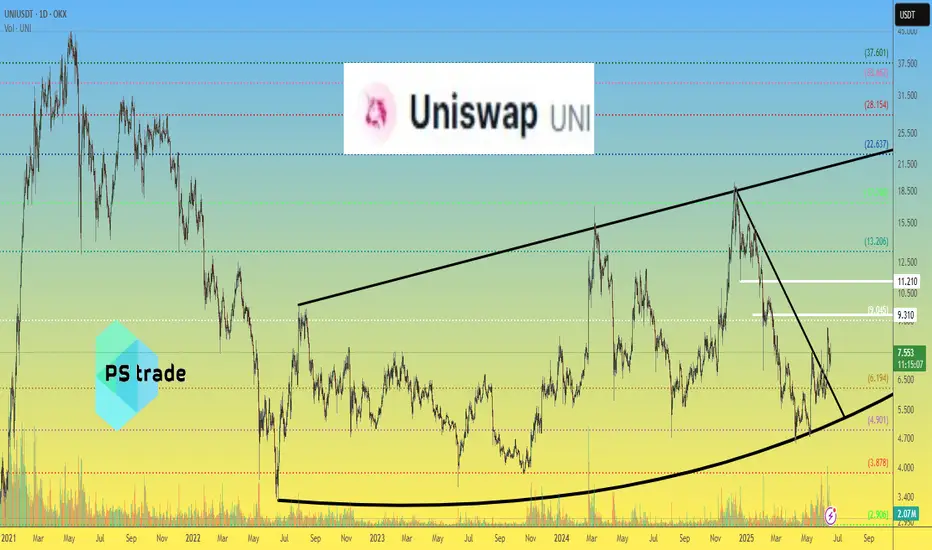
Uniswap UNI price analysis🦄 Despite the weak crypto market, #UNI is holding up quite well at the moment, so you should take it "on a pencil".
At first, the “big money” are buying, and then the news will be rolled out.
🕯 The OKX:UNIUSDT chart shows increased trading volumes.
We wouldn't be surprised if in the coming day
UNI to the Mooni - Unleashing Banking into DeFi - Send itUniswap has powered trillions of dollars of exchange volume over the years, but, while its achieved economies of scale, it's been held back from mainstream use and value accrual due to the existing banking system's de facto and now uncovered to be de jure prohibition on interaction and SEC's sys
UNI/USDTKey Level Zone: 7.620 - 7.680
LMT v2.0 detected.
The setup looks promising—price previously trended upward with rising volume and momentum, then retested this zone cleanly. This presents an excellent reward-to-risk opportunity if momentum continues to align.
Introducing LMT (Levels & Momentum Trad

UniUSDT is ready to take offUniUSDT is ready to take off, and the momentum seems to have started now.
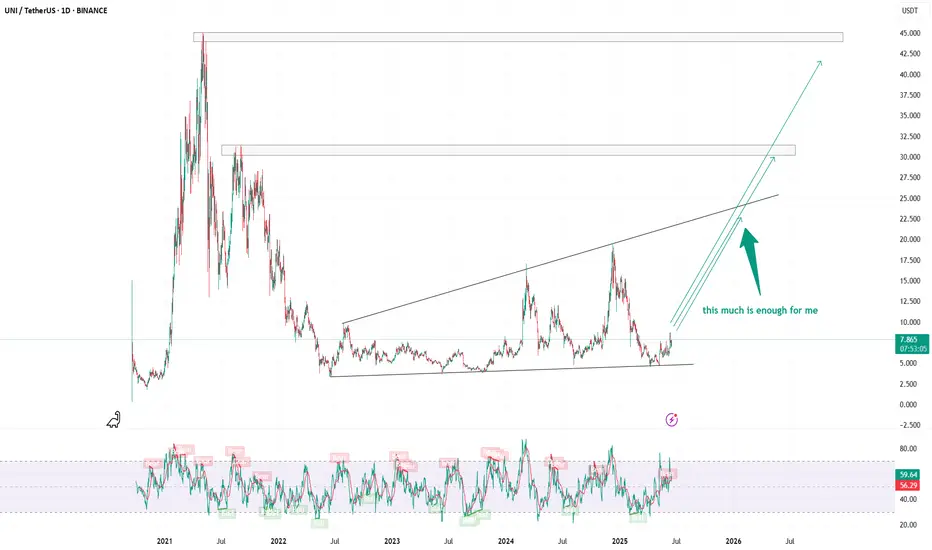
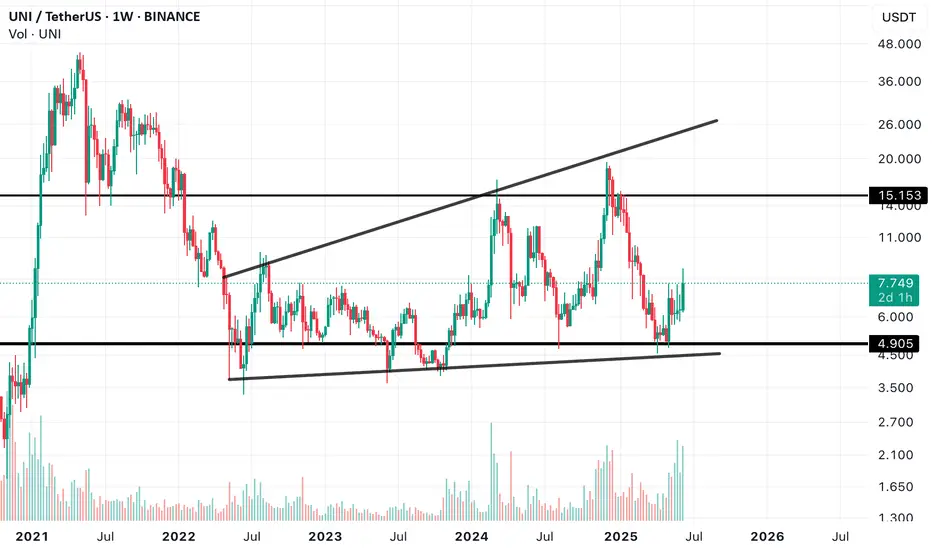
UNI is gearing up! Are you ready?Today, we’re going to discuss UNI and analyze the chart to identify the best possible scenario.
UNI/USDT has recently broken above the resistance trendline, showing a solid price acceleration from $6 to $8. If we take a closer look at the previous rally in November 2024, we’ll notice that the price
UNI - Is it Unique?So getting on UNIUSDT - It looks like a tokyo session move and a liqsurge, opting for the downmoves!


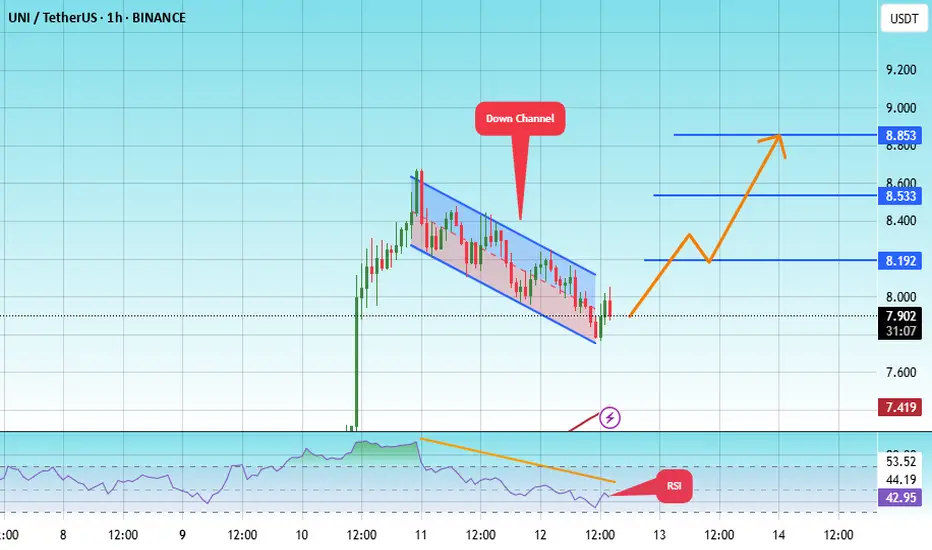
#UNI/USDT#UNI
The price is moving within a descending channel on the 1-hour frame, adhering well to it, and is heading toward a strong breakout and retest.
We are experiencing a rebound from the lower boundary of the descending channel, which is support at 7.78.
We are experiencing a downtrend on the RSI i
See all ideas
Summarizing what the indicators are suggesting.
Oscillators
Neutral
SellBuy
Strong sellStrong buy
Strong sellSellNeutralBuyStrong buy
Oscillators
Neutral
SellBuy
Strong sellStrong buy
Strong sellSellNeutralBuyStrong buy
Summary
Neutral
SellBuy
Strong sellStrong buy
Strong sellSellNeutralBuyStrong buy
Summary
Neutral
SellBuy
Strong sellStrong buy
Strong sellSellNeutralBuyStrong buy
Summary
Neutral
SellBuy
Strong sellStrong buy
Strong sellSellNeutralBuyStrong buy
Moving Averages
Neutral
SellBuy
Strong sellStrong buy
Strong sellSellNeutralBuyStrong buy
Moving Averages
Neutral
SellBuy
Strong sellStrong buy
Strong sellSellNeutralBuyStrong buy
Displays a symbol's price movements over previous years to identify recurring trends.