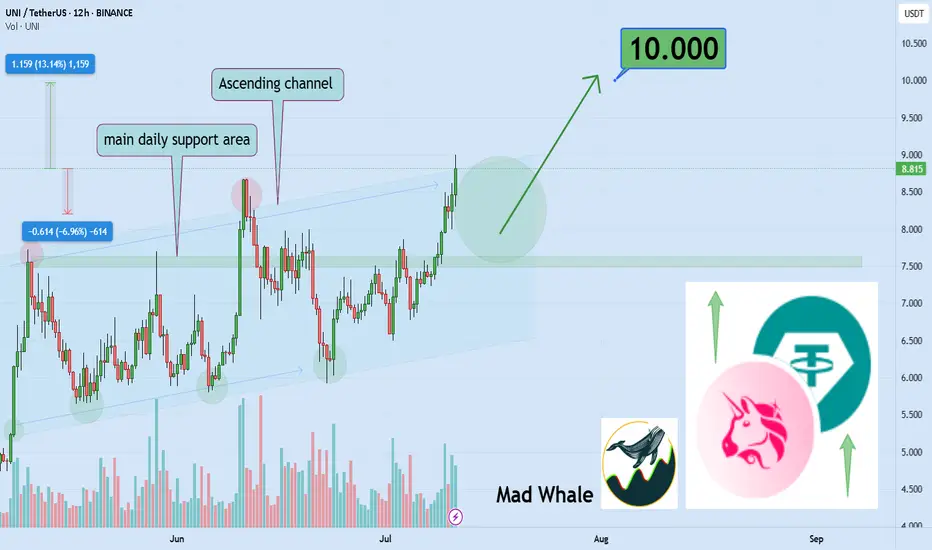
UNI up 13% – is $10 the next stop?Hello✌
let’s dive into a full analysis of the upcoming price potential for Uniswap 📈.
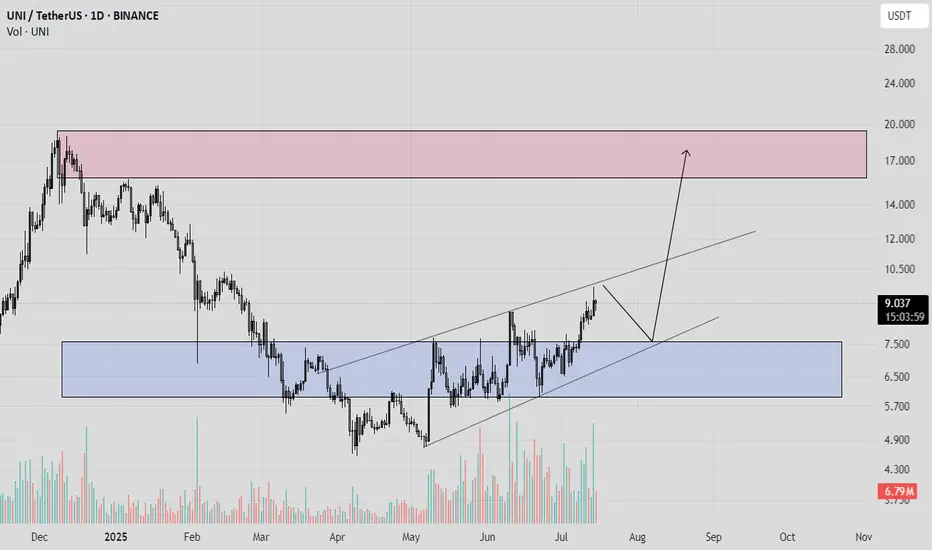
BINANCE:UNIUSDT has maintained solid bullish structure within a well-formed ascending channel and is now approaching a key daily support zone. Recent volume spikes and a 13% price increase indicate growing buyi
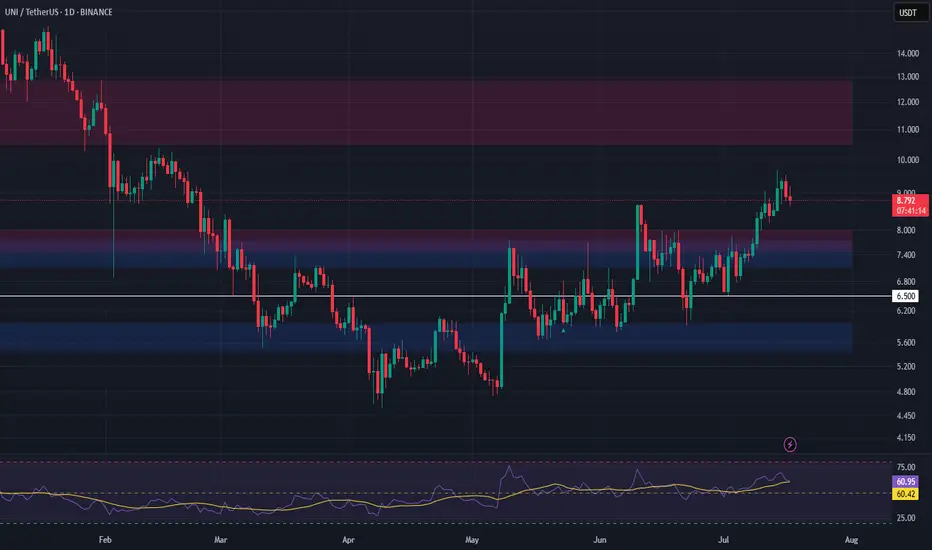
INJ vs UNI – Are We About to See a Massive Buy Program? This chart comparison between Injective Protocol (INJ) and Uniswap (UNI) on the weekly timeframe suggests that UNI might be entering a similar buy program to what INJ previously experienced.
🔍 Key Observations in the Chart Comparison:
1️⃣ Sell Program → Accumulation → Buy Program
INJ (Left Chart)

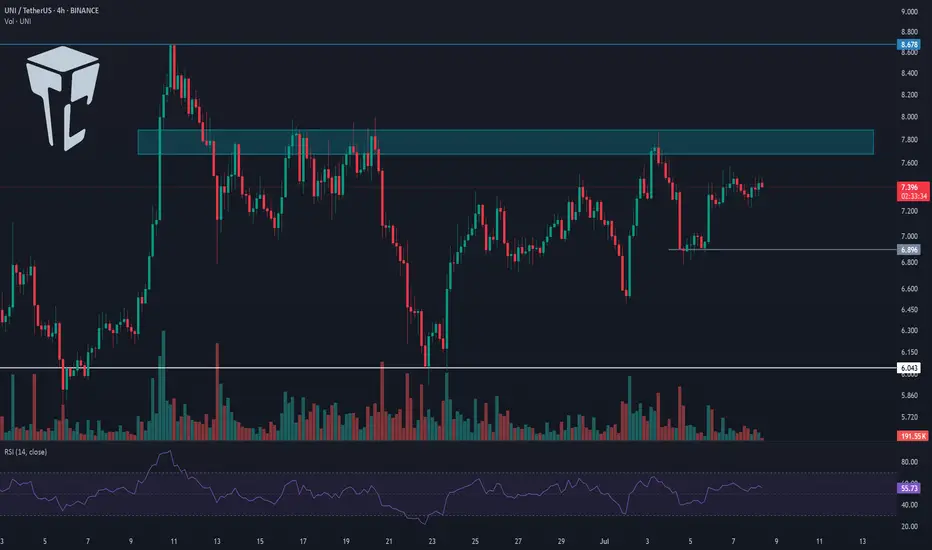
TradeCityPro | UNI Builds Pressure Below Key Resistance Zone👋 Welcome to TradeCity Pro!
In this analysis, I’ll be reviewing the UNI coin — one of the notable DeFi tokens, currently ranked 27th on CoinMarketCap with a market cap of $254 million.
⌛️ 4-Hour Timeframe
On the 4-hour chart, as you can see, UNI has formed a bottom around the 6.043 level, which is
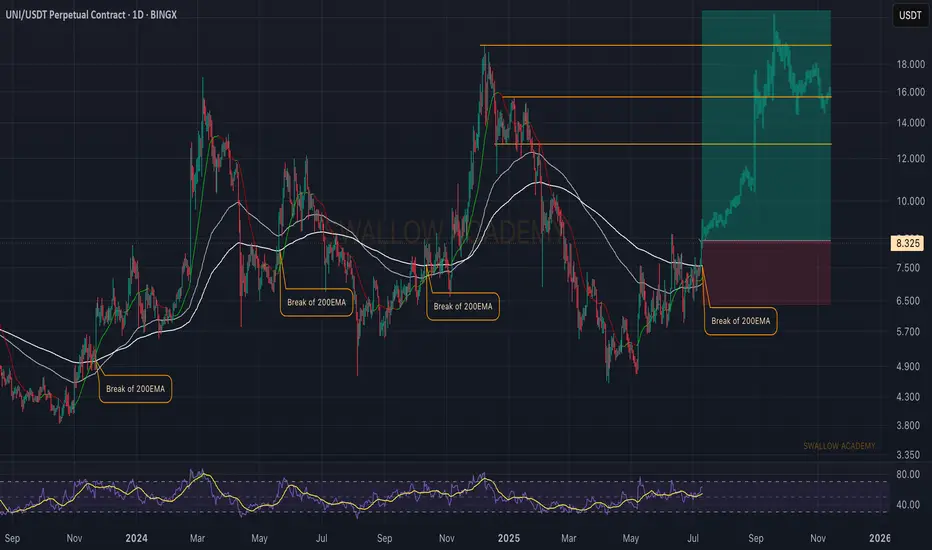
Uniswap Coin (UNI): Buy Entry Incoming | Be Ready For ExplosionUniswap is showing good signs for potential bullish movement that might happen from here on. The key area is once again the 200 EMA, which historically, once it has been broken and secured, buyers gathered all the volume and sent the price as high as they could.
We are aiming to see same movement
UNIUniswap
Uniswap protocol is the largest Automated Market Maker (AMM) DEX on the Ethereum Virtual Machine.
Everything is clear on the chart.
I wish everyone abundant profits.
Like and follow
for more.
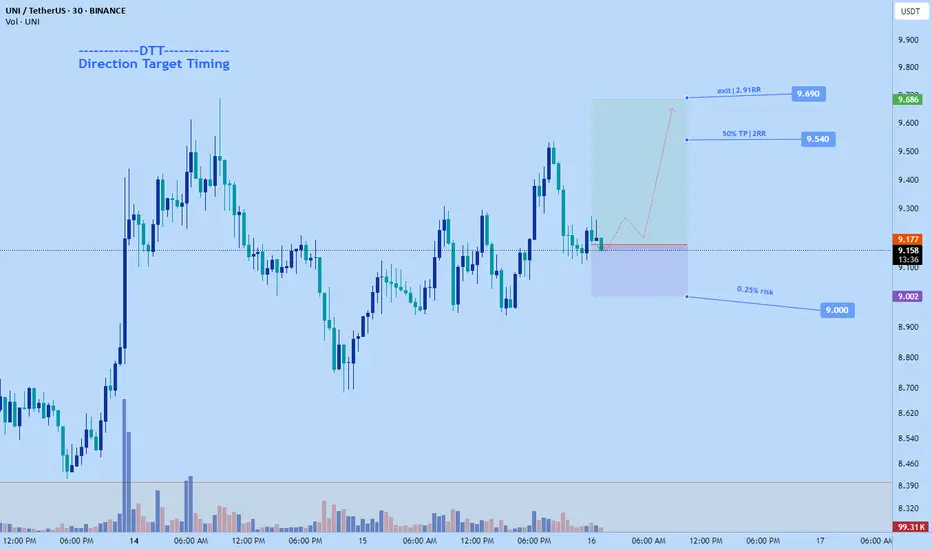
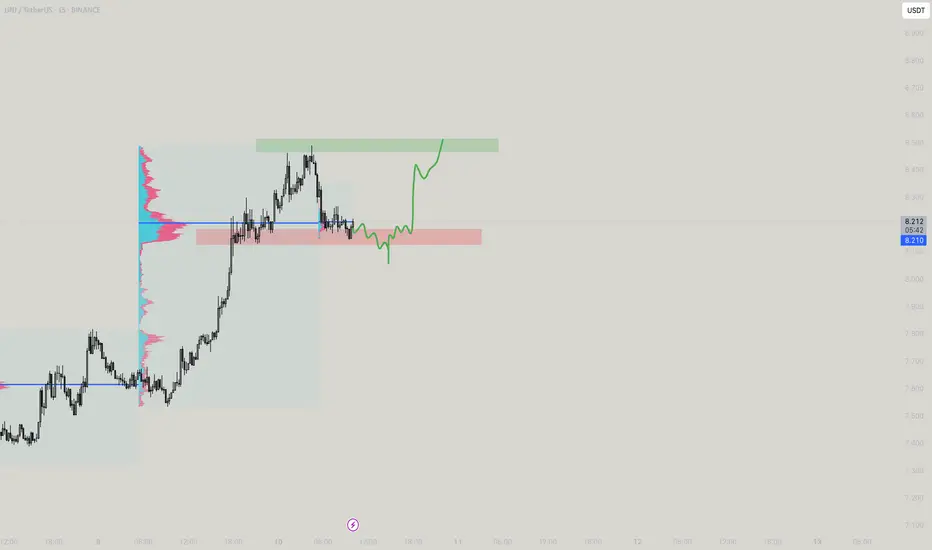
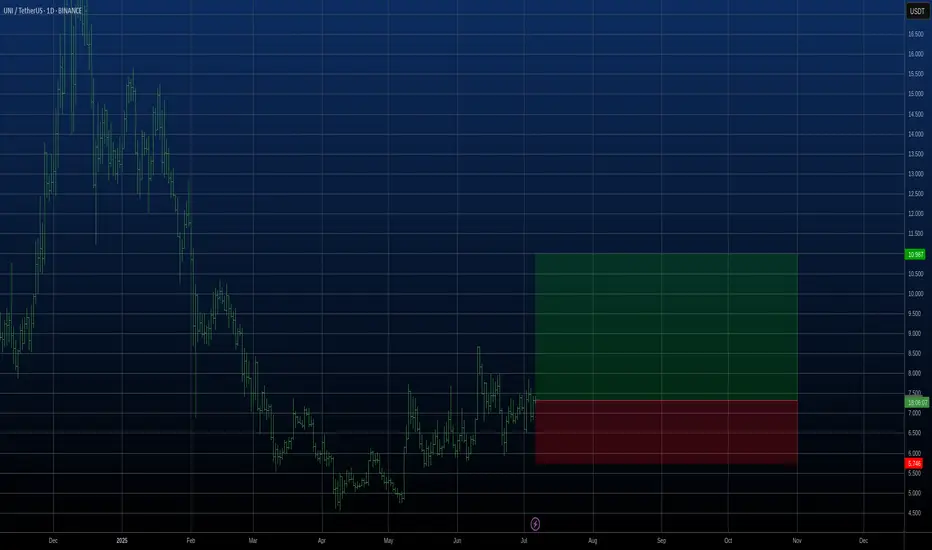
UNI Long Setup – Breakout Retest into High-Confluence SupportUniswap (UNI) has broken out of resistance and is now pulling back into a high-confluence zone, forming a strong bullish structure. The $7.13–$7.73 area presents a favorable entry on the retest.
📌 Trade Setup:
• Entry Zone Around: $7.13 – $7.73
• Take Profit Targets:
o 🥇 $10.50 – $12.85
• Stop Lo
UNI - One more Unified Trade!As seen here, looks to go up, little bit of liq dump is needed for further up
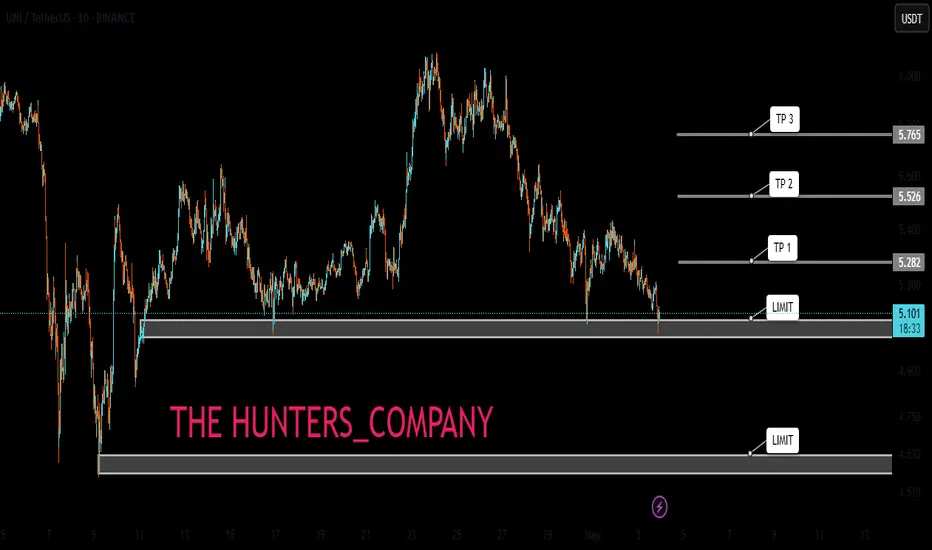
UNI:LIMIT FOR BUY(FREE)Hello friends
Due to the price drop, we can buy on the drop within the specified limits and move with it to the specified targets, of course with capital and risk management.
*Trade safely with us*
A good moment to try to Buy UNIA good moment to try to buy UNI. We see a strengthening upward trend and now we are closer to the lower border of this trend. We put a stop behind the local low of the sideways. Let's see...
See all ideas
Summarizing what the indicators are suggesting.
Oscillators
Neutral
SellBuy
Strong sellStrong buy
Strong sellSellNeutralBuyStrong buy
Oscillators
Neutral
SellBuy
Strong sellStrong buy
Strong sellSellNeutralBuyStrong buy
Summary
Neutral
SellBuy
Strong sellStrong buy
Strong sellSellNeutralBuyStrong buy
Summary
Neutral
SellBuy
Strong sellStrong buy
Strong sellSellNeutralBuyStrong buy
Summary
Neutral
SellBuy
Strong sellStrong buy
Strong sellSellNeutralBuyStrong buy
Moving Averages
Neutral
SellBuy
Strong sellStrong buy
Strong sellSellNeutralBuyStrong buy
Moving Averages
Neutral
SellBuy
Strong sellStrong buy
Strong sellSellNeutralBuyStrong buy
Displays a symbol's price movements over previous years to identify recurring trends.