Crypto market review: Bitcoin, ETH, and Altcoins Setting Up for Prepared a new in-depth crypto market video update covering BTC, Ethereum, and key altcoins. Here’s a quick summary of the current landscape and what I’m tracking in the charts:
We’ll begin with Bitcoin. After the Fed’s decision, BTC showed a constructive shakeout and has been consolidating tightly around the same range for three weeks. I previously anticipated resistance near the 1.23 area and expected a sideways phase within the 1.15–1.13 support zone. That’s exactly what we’re seeing—shakeouts and quick recoveries. As long as we stay above 1.13 structurally, and especially above yesterday’s highs short-term, I expect BTC to push higher toward the 1.26–1.30 resistance zone.
Institutional buying during the post-Fed dip has been significant. Volume on Coinbase and Binance indicates strong participation, and Bitcoin treasuries have been accumulating. This bolsters confidence in the underlying trend structure.
I wrote in mid-July about BTC’s broader macro structure—this resistance region may trigger a prolonged consolidation, but ideally without breaking June lows. Short-term bias remains bullish.
Ethereum remains the strongest large-cap altcoin. It has respected the 8EMA on pullbacks and shows strength to target 4300–5100 in the coming weeks. It continues to lead risk-on sentiment.
XRP has been deep in consolidation, but we may be seeing a higher low forming. Any rally in BTC and ETH could lift XRP toward 3.30–4.60 levels, possibly even 5.00.
Solana showed strong action through late July, pulling back into mid-term support. As long as this structure holds, I expect upside toward 220–230 and potentially reclaiming ATH zones.
Hyperliquid has been a laggard but held its key macro support. If yesterday marked a bottom, I’ll be watching for higher lows and a move toward 55–60.
Other notable setups:
Brett: Both showing impulsive structures from April lows. Brett in particular looks poised for 74–77, potentially retesting May highs around 95.
ONDO: Recovering key zones and shaping a potential bottoming pattern.
SUI: Leading structure from July lows. After a likely wave-one completion, it could extend toward 5.15–7.70 before topping.
RENDER: Looks to have finished its correction. Potential long-term upside beyond May highs; the macro uptrend might already be underway.
SUPER: Since July breakout, forming a strong trend structure. If it holds the higher low, could reach 1.20–1.46 in coming weeks.
TON: Slow mover, but the macro pattern suggests a bottom with potential toward 4.60 short-term.
LINK: Hasn’t finished its move. Watching for 21–22 as a next target.
FET / Fetch.AI: Macro structure looks great. Watching for recovery from June lows with potential for strong continuation if structure holds.
Trump Coin: In a diagonal pattern post-failed impulsive breakout. If higher lows hold, watch for rally toward 13–14.
LTC: Linear and clean structure. Looks ready to push toward 130–145 before potential base-building.
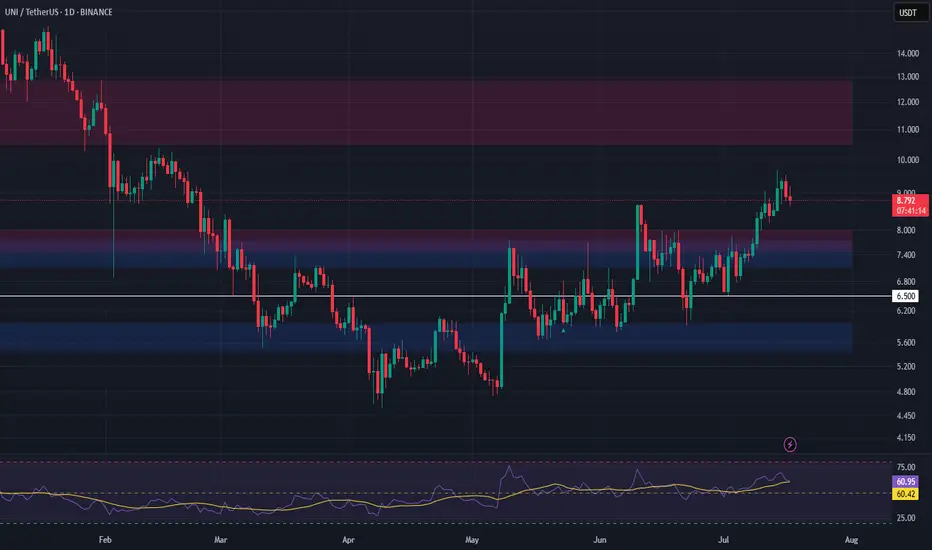
UNI: Targeting 14–18+ in wave continuation if structure holds.
Let me know in the comments if there’s a specific coin you’d like me to go over. I’ll include it in future updates or make a quick standalone video.
Thanks for watching, and I wish you a successful trading week ahead. Let’s see how far this rally can go through the rest of the summer!
UNIUST trade ideas

UNI Analysis (4H)UNI – Correction Might Bring Opportunity
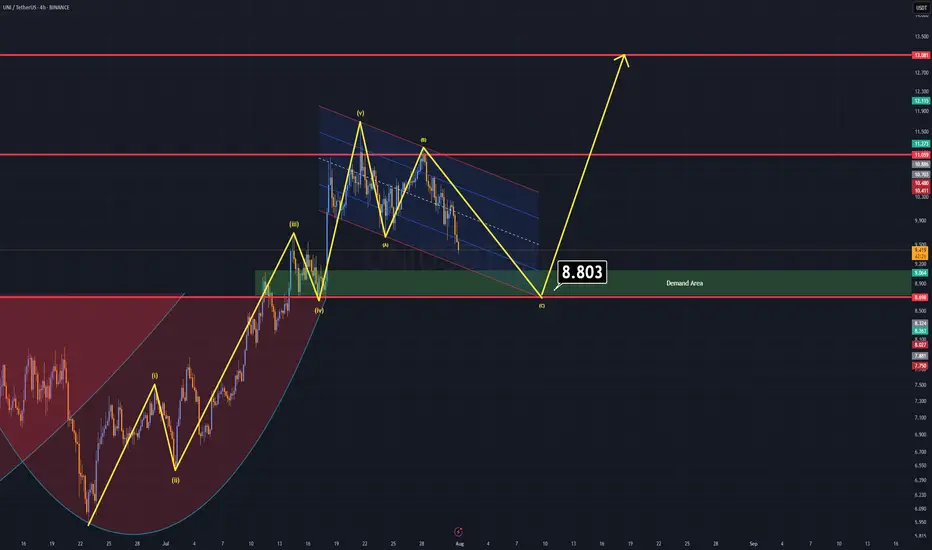
Currently, UNI is forming an A–B–C corrective pattern, and based on technical structure, this correction may complete around the $8.8 level.
Key Zone to Watch: $9.0 – $8.5
There's a strong demand zone just below $9, supported by historical price action.
On the daily time frame, a broken cup & handle formation aligns perfectly with this area — the old neckline may now act as support, increasing the confluence.
This overlap of structure and demand makes the $9–$8.5 zone a favorable entry for a long position.
Once price reaches this area, expect a significant upward correction as part of the next move in the cycle.
Good Luck.
UINI LongFollowing a significant decline, the asset will take support and bounce back from this point.
Disclaimer: This is not financial advice.
This algorithm provides highly precise buy and sell signals with alerts:

Watch Uniswap’s $10 Defense For 16% Breakout Toward $12.5Hello✌
Let’s analyze Uniswap ’s upcoming price potential 📈.
BINANCE:UNIUSDT is currently trading near a key confluence zone that includes the psychological round number of 10, a daily timeframe support level, and a Fibonacci retracement area. If this zone holds, there is potential for a 16% upside move toward the 12.5 level , making it a setup worth monitoring in the coming sessions. 📊🔍
✨We put love into every post!
Your support inspires us 💛 Drop a comment we’d love to hear from you! Thanks , Mad Whale

Buy Trade Strategy for UNI: Backing the Leading DeFi DEX UniswapDescription:
This trading idea is centered on UNI, the governance token of Uniswap, the largest decentralized exchange (DEX) on Ethereum. UNI holders play a crucial role in the protocol’s development, and the token benefits directly from Uniswap’s expanding user base, trading volume, and influence in the DeFi space. As decentralized finance continues to evolve, Uniswap remains a foundational pillar for trustless asset swaps, and UNI serves as a strategic asset for exposure to this ecosystem. The platform's commitment to innovation, including cross-chain expansion and layer-2 integrations, further strengthens UNI’s long-term fundamentals.
That said, the crypto market is highly volatile, and **UNI**'s performance is subject to sudden changes due to regulatory shifts, Ethereum network updates, or competitive developments in the DeFi sector. Investors should remain aware of these dynamics and manage their positions responsibly.
Disclaimer:
This trading idea is for educational purposes only and should not be considered financial advice. Cryptocurrencies like UNI carry substantial risk, including the possibility of total capital loss. Always conduct your own research, evaluate your risk tolerance, and consult a qualified financial advisor before making investment decisions. Past performance is not a guarantee of future results.

$uni stop a tad below white thick line
may or may not reverse this move by monday for now longing it and expecting dominance to roll over
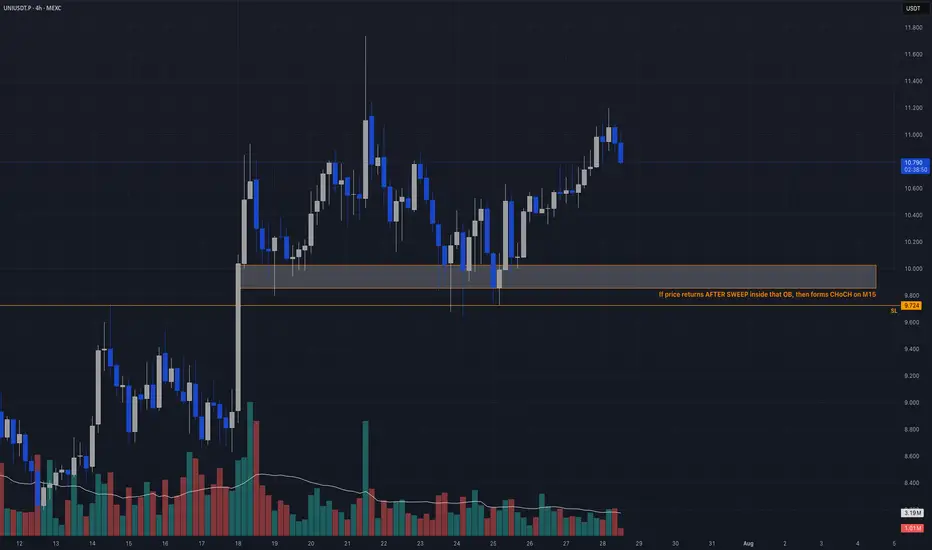
Liquidity Sweep + OB Retest → CHoCH TriggerCandle Craft fam — we’ve got a clean and calculated setup unfolding on UNIUSDT.P (4H). This one fits our criteria perfectly: structure, sweep, and planned trigger. No rush. We wait for the market to show its hand.
⸻
📈 Bias: Long
🧠 Strategy: Liquidity Sweep + OB Retest → CHoCH Trigger
📍 Entry Plan:
▫️ Entry Zone: 9.80 – 10.00 (after sweep)
🛡️ Stop Loss: 9.724
🎯 Take Profits:
• TP1: 10.85
• TP2: 11.20
• TP3: 12.00+
⸻
🧠 Why This Trade?
– Price approaching 4H OB with prior impulse support
– Eyes on liquidity sweep under $10.00
– Looking for M15 CHoCH after sweep for confirmation
– HTF bias remains bullish → continuation expected on reclaim
⚠️ This is a reactive setup — no blind entries. Let the trap trigger the trade.
⸻
Trade clean. Execute with intent.
We don’t guess. We wait, we strike.
—
Candle Craft | Signal. Structure. Execution.
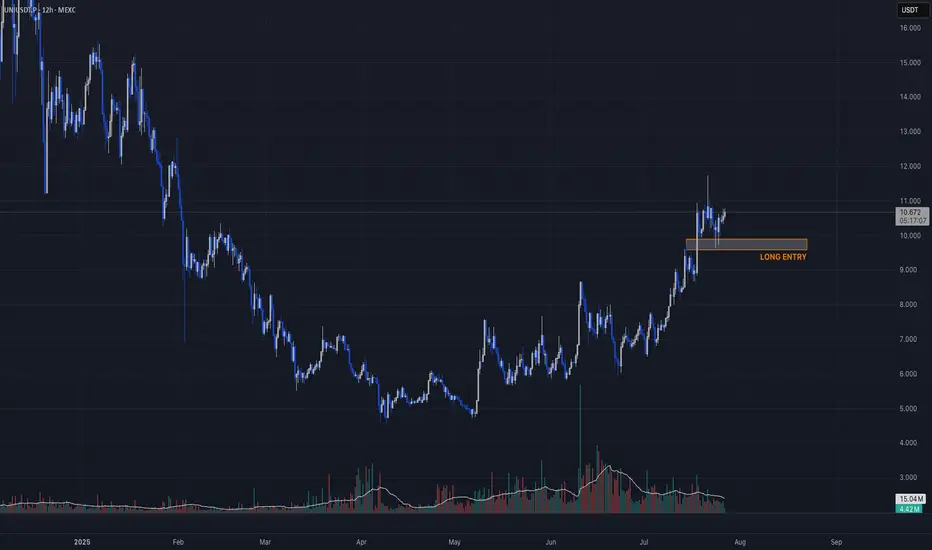
UNIUSDT.P – LONG SETUPCandle Craft fam — here’s a clean long opportunity shaping up on UNIUSDT.P (2D) that aligns with our strategy: momentum continuation backed by structure, not hype.
UNI just broke out of a multi-month range and is now consolidating right below resistance, printing a textbook bullish continuation flag on the 2D chart. The trend is strong, volume confirms, and the structure is respecting higher lows.
This is the kind of move that builds legs if BTC remains stable. Here’s how I’m positioning:
⸻
🟢 LONG ENTRY PLAN (2 Options):
1. Breakout Entry
• ✅ Entry Trigger: Above 11.10
• ⛑️ SL: 9.95 (below structure low)
• 🎯 Targets:
• TP1: 13.00
• TP2: 15.50
• TP3: 18.00+
2. Retest Entry (More Conservative)
• Entry Zone: 9.60 – 10.00
• SL: 8.80
• Targets: same as above ☝️
⸻
📊 Why This Setup Matters:
• Broke major range on strong volume
• Consolidating in a controlled pullback — bullish sign
• 2D structure showing strength (HH + HL)
• No divergence, no breakdown — just accumulation and compression
⸻
🧩 Candle Craft Note:
We favor structured breakouts, not emotional pumps. This setup gives us both entry flexibility and clean invalidation levels. Perfect R/R, perfect structure — we’re executing with discipline.
Let’s stay sharp, team. The market rewards patience and precision.
— Candle Craft
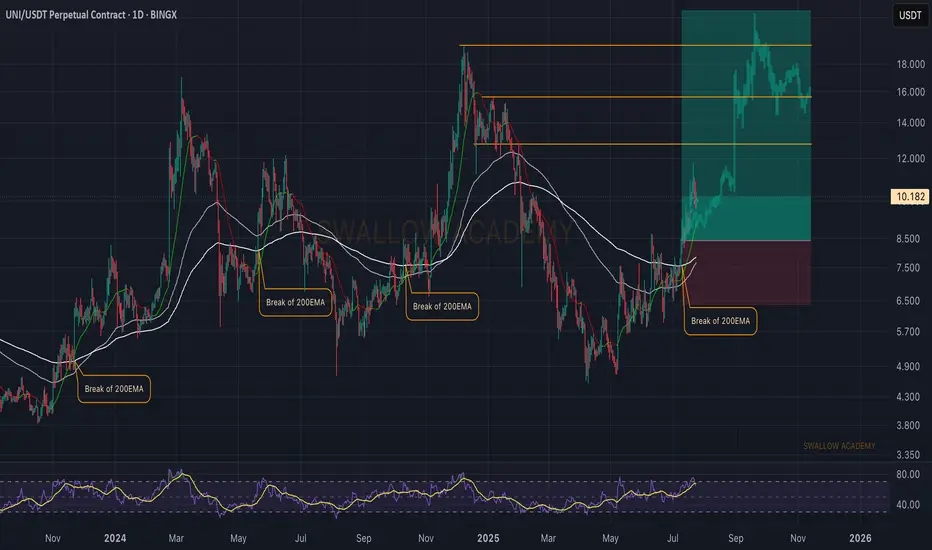
Uniswap (UNI): 200EMA Has Been Broken | We Are About To FlyUniswap is doing well;we have broken once again the EMA that has been in our attention since last week, and since then we have had a decent movement.
But this is not yet the full potential that we are looking for so we want to see even bigger movement to upper zones, buckle up.
Swallow Academy
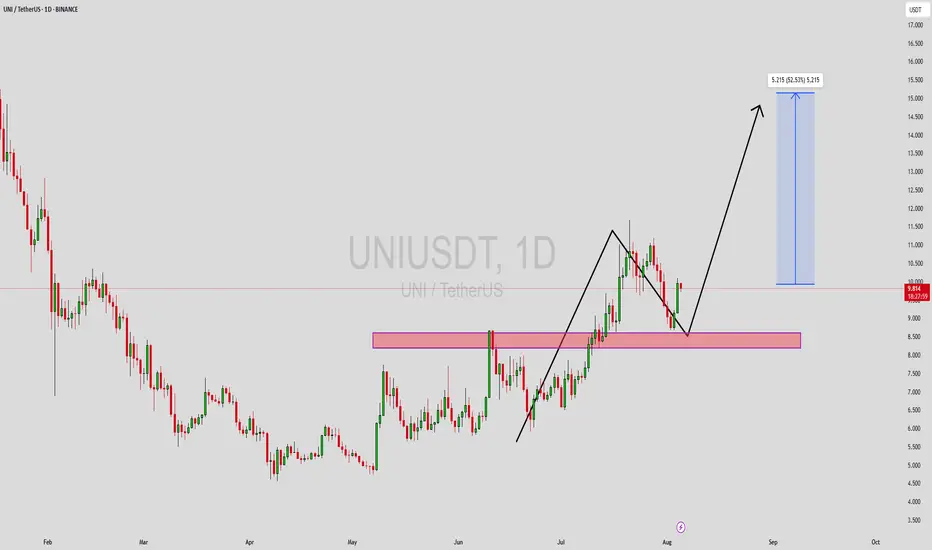
UNIUSDT Forming Bullish ContinuationUNIUSDT is currently presenting a compelling bullish continuation setup, as evidenced by the recent price action retesting a major support zone that previously acted as strong resistance. This key area, highlighted on the chart, has flipped to support—indicating a potential launchpad for the next impulsive move. The price has respected this zone and is already showing signs of a rebound, which may lead to a fresh leg upward in the near term.
The chart analysis points to a potential 52%+ gain from current levels, with a clear projection toward the $15.00 mark. The current pullback appears healthy within an overall bullish structure. UNI's steady volume during this phase further validates investor confidence, supporting the potential for a strong recovery rally. Technical traders often look for such clean price action following a breakout and successful retest of critical levels.
Fundamentally, UNI (Uniswap) remains one of the leading decentralized exchange protocols, and its continued development in DeFi space keeps it highly relevant. The market seems to be recognizing this with renewed buying interest. If current market sentiment remains bullish and broader conditions support altcoin growth, UNI could reach its projected upside in a relatively short timeframe.
With a strong technical setup, supportive volume, and renewed investor attention, UNIUSDT is shaping up to be a promising trade idea for mid-term swing traders and investors.
✅ Show your support by hitting the like button and
✅ Leaving a comment below! (What is You opinion about this Coin)
Your feedback and engagement keep me inspired to share more insightful market analysis with you!
UNI Liquidity Grab ReversalHey Candle Fam,
UNI’s been falling faster than weekend trading discipline—don’t worry, we stayed sober and spotted the setup before the panic hit. Let’s see if the market’s done crying yet or if there’s one last flush before the bounce. 💧📉
🔥 UNIUSDT.P TRADE IDEA 🔥
Bias: Long (Pending Confirmation)
Strategy: Liquidity Grab Reversal
Entry: $8.65 / $8.52
SL: $8.39
TPs: $9.20, $9.88
📊 Rationale:
– HTF structure: Clear breakdown from $11 top into unrefined imbalance—bearish until we trap the late shorts
– LTF signal: No BOS or CHoCH yet, but potential sweep forming under local support
– Liquidity target: Eyes on the zone under $8.60—this is where retail gets baited
🧠 Order Flow Note:
– OI bleeding out = exit of weak hands
– Funding flipped negative = short bias crowding
– CVD diving like a leveraged newbie in a pump-and-dump room—perfect for a reversal play
We don’t buy red candles. We buy their fear.
Wait for the trap, then we strike. Precision, not impulse.
Candle Craft | Signal. Structure. Execution.
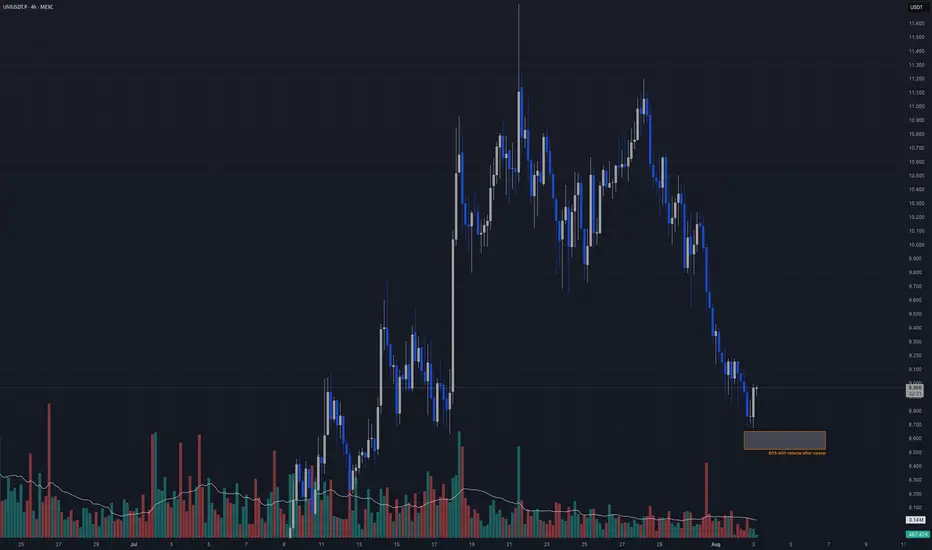
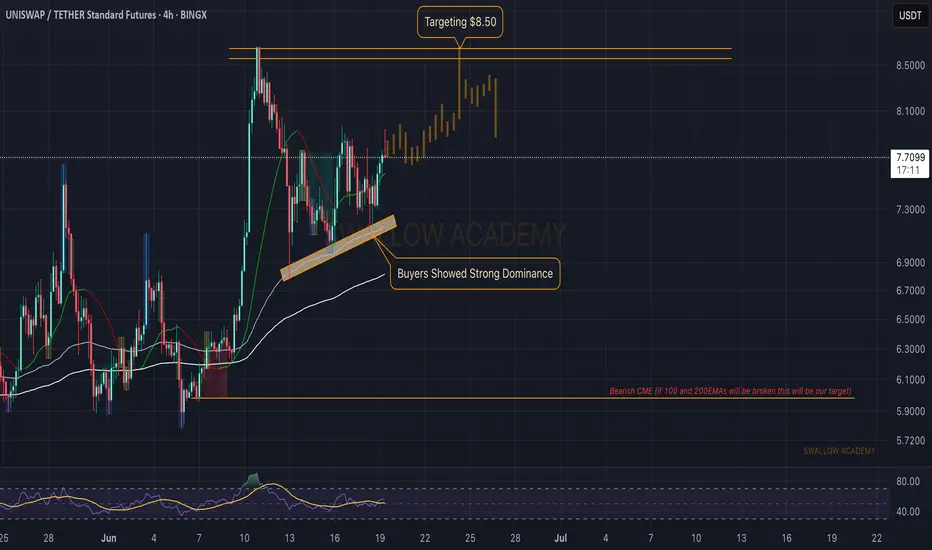
Uniswap (UNI): Buyers Showing Strong Dominance | Aiming at $8.50Uniswap is showing strong buyside momentum where recently near 100EMA we saw how dominant the buyers were, which is giving us a sign of possible further movement to local resistance area, so that's where we have set our targets as of now.
Now if we see any signs of weakenss then we will be shifting our view for Bearish CME.
Swallow Academy
UNI/USDT Analysis. Strong Support
This pair has been in a downtrend since July 21st, but after approaching the important $9.8 level, the price has failed to break below it on three separate attempts.
Below that, there is a very strong buyer zone between $9.5 and $8.9. If this zone is tested and we see a reaction from buyers, we will consider a long position.
This publication is not financial advice.

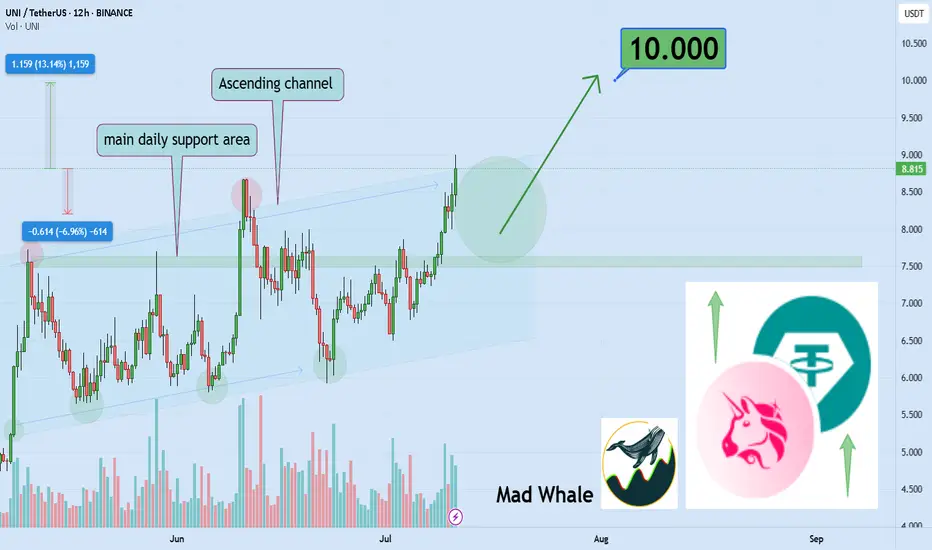
UNI up 13% – is $10 the next stop?Hello✌
let’s dive into a full analysis of the upcoming price potential for Uniswap 📈.
BINANCE:UNIUSDT has maintained solid bullish structure within a well-formed ascending channel and is now approaching a key daily support zone. Recent volume spikes and a 13% price increase indicate growing buying interest. A breakout above the channel resistance could open the way toward the psychological target at $10, a level watched by many traders. Monitoring price action and volume confirmation here is essential for potential trend continuation. 📈🧠
✨ Need a little love!
We pour love into every post your support keeps us inspired! 💛 Don’t be shy, we’d love to hear from you on comments. Big thanks , Mad Whale 🐋
Uniswap Exits Opportunity Buy Zone · $73 & $118 2025 ATH TargetUniswap is finally out of its long-term opportunity buy zone, a trading range that was activated first in 2022 and remained valid for a long time.
After October 2023, UNIUSDT produced two bullish moves but each time fell back into this zone. Orange/brown on the chart. Notice how this zone matches price action happening below EMA89, EMA55, MA200, EMA144 and EMA233. As Uniswap turned bullish and fully confirmed, it broke above all this major levels.
Last week, it managed to close above the really long EMA233 and this week the action is staying above. Currently $10.30.
Notice waves "1" and "2" these are relatively small waves. Something will happen with #3. The market evolves exponentially. Instead of another similar wave going a bit higher, it will be something like 2021. Not like 2021 in the sense that it will reach similar price levels, but in the sense that it will be completely out of proportion with what you saw in the last several years. Prices will go off-the chart.
We can think of resistance as a new all-time high being found around $73 and $118, but this time I only want to call your attention to this moment now. The fact that market conditions are changing and it is still early when we focus on the long-term.
I just realized that I might be seeing things differently and it is hard to visualize, for someone without the actual experience, what is about to happen. But despair not because that is the one reason why I am here and why you are reading this. I am here to alert you, remind you and prepare you for an event before it happens. In this way, you can profit and achieve your financial goals. I want to give you value in exchange for your trust. Will you trust? Uniswap is going up. Crypto is going up and it will be the best since 2021. Possibly the best bull market in the history of Crypto, the new regulatory framework and global adoption is saying so.
Thanks a lot for your continued support.
Namaste.

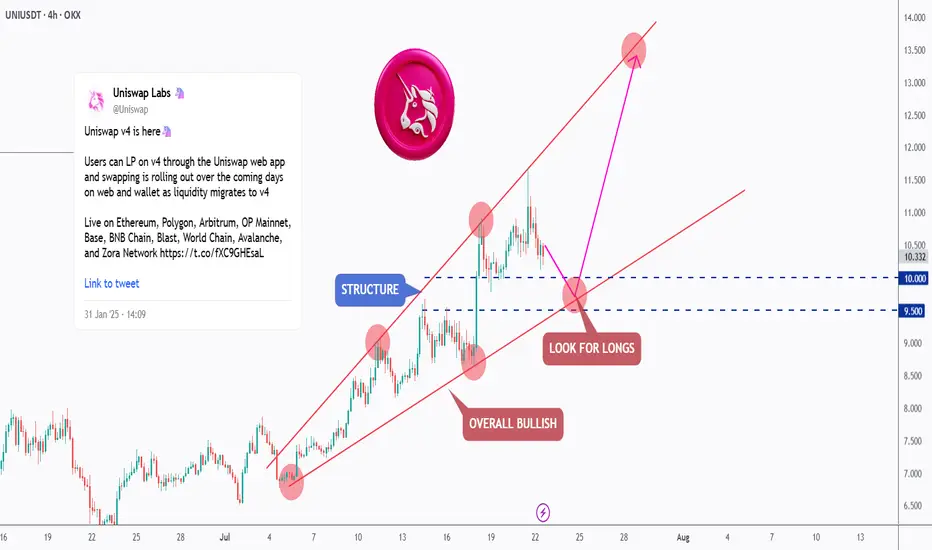
[Deep Dive] UNI – Edition 1: Retest. Reload. Rally?Uniswap (UNI) has been trading within a well-respected rising channel, showing consistent bullish structure across the 4H timeframe.
After a strong rally from the $7.50 region, price is now undergoing a healthy correction — retesting the lower boundary of the channel, which intersects with the $9.50–$10.00 demand zone.
📐 Technical Outlook
The market has printed a series of higher highs and higher lows, confirming the bullish momentum. The recent correction is testing a key support structure — previously a resistance zone — and this confluence aligns perfectly with the channel’s lower bound.
As long as this zone holds, UNI is well-positioned for a continuation toward the $13–$14 region, in line with the pink projected path.
🔥 Fundamental Boost
Uniswap has recently launched its V4 upgrade, introducing "hooks" — customizable smart contracts that allow developers to build more complex DeFi logic directly within liquidity pools. This upgrade not only enhances flexibility and capital efficiency, but also reduces gas costs — making Uniswap an even more dominant player in the DEX ecosystem.
Additionally, with Ethereum L2 adoption growing and Uniswap expanding across multiple chains (Arbitrum, Base, and Optimism), protocol usage and fees are on the rise again.
The UNI token may soon benefit from the proposed fee switch, which would redirect a portion of protocol fees to token holders — potentially adding new value accrual mechanics.
🟢 Conclusion
The technicals and fundamentals are aligning. UNI is in a bullish structure, trading at a key area of interest, and the latest upgrades may unlock new growth for the ecosystem.
Traders and investors alike should keep a close eye on this zone for long opportunities, as the next impulse could be just around the corner.
💬 What do you think — is UNI ready to break toward new highs, or will the demand zone fail? Let me know in the comments 👇
🔔 Disclaimer: This analysis is for educational and informational purposes only. It does not constitute financial advice or a recommendation to buy or sell any asset. Always do your own research and manage your risk accordingly.
📚 Always follow your trading plan => including entry, risk management, and trade execution.
Good luck!
All strategies are good, if managed properly.
~ Richard Nasr
UNI/USDT – Technical Analysis (3D)Confirmed Structural Breakout – Swing Targets + Fibonacci Extensions - With alignment across technical structure, product roadmap, on-chain adoption and regulatory tailwinds, UNI has a clear path to re-test its ATH around $45—assuming the market stays bullish and upcoming catalysts deliver.
🔍 The asset UNI/USDT has just broken out of a multi-month range between 4.80 and 10.60 USDT, confirming a Change of Character (CHoCH) on the 3-day timeframe.
🧠 Technical Context
⏱ Timeframe: 3D (mid/long term)
⚙️ Market Structure: Confirmed trend reversal after multiple CHoCH and BoS since 2023
🔁 Long consolidation > recent breakout with bullish volume and RSI > 70 (strong momentum)
🎯 Breakout above the key resistance at 10.66 USDT now validated
📏 Target Levels (Take Profits)
TP1: 10.66 USDT (confirmed breakout / potential retest)
TP2: 13.00 USDT (horizontal resistance)
TP3: 15.00 USDT
TP4: 20.00 USDT
TP5: 29.58 USDT
TP6: 45.85 USDT (maximum Fib extension)
⚡ TP3 to TP5 were calculated using Fibonacci extensions (1.618, 2.0, and 2.618) from the latest impulsive move.
📐 Risk-Reward Ratio (RR)
TP1 : 0.94
TP2 : 1.80
TP3 : 3.95
TP4 : 8.06
TP5 : 15.04
(calculés sur base d’entrée 10.80 / SL 8.47)
⏳ Estimated Timeframe
4 to 12 weeks, depending on market volatility.
🧩 Indicators
RSI 14: 71.23 → in bullish territory, no bearish divergence detected
Structure: multiple CHoCH and Breaks of Structure (BoS) confirmed
No bearish divergence on recent local tops
📌 Current Scenario
📈 Bullish as long as price holds above 9.32 USDT (swing low / key support)
A pullback to the 9.95–10.20 USDT zone would offer a solid entry with good RR
⚠️ To Watch
Retest near 10.00 USDT for a healthy consolidation
Possible resistance around 13–15 USDT (previous congestion zone)
Daily close above 10.66 to unlock higher Fibonacci targets
💡 Conclusion
UNI is showing a mid-term trend reversal, confirmed by structural breaks and solid momentum. Targets at 15, 20, and 29 USDT are realistic in the coming weeks to months.
This is not financial advice. Always do your own research and assess risks yourself.

UNI Market Cap Breakout Signals Major Repricing Ahead 🚀📈 UNI Market Cap Breakout Signals Major Repricing Ahead 💥💹
Forget the December highs. That spike? It came with a bloated market cap and little real growth. T oday, it’s different.
UNI has reclaimed the key $10 level, but more importantly, its market cap structure is breaking out after years of compression — and that’s where the real alpha lives.
🔍 Technical View (Market Cap-Driven)
🔹 UNI broke above the $10.94 price zone with strong momentum
🔹 Currently retesting the $9.73 breakout base — a critical zone for bullish continuation
🔹 Market cap structure targets:
– Next milestone: $14.72 (aligned with local resistance)
– Macro extension target: $17.70, corresponding to a market cap near $18.08B
This puts UNI at the doorstep of a major repricing phase.
🧠 Why This Time Is Different
✅ Market Cap Breakout – We’re not just looking at price anymore. The structure on the market cap chart shows accumulation and a clean breakout from multi-year compression.
✅ Whale Activity – Addresses holding 1M+ UNI are growing fast. Over $60M in UNI was moved off exchanges in July alone.
✅ Protocol Expansion
– Uniswap v4 is imminent, introducing Hooks, dynamic fees & native ETH support
– Unichain L2 has now hit 6.3M wallets and 147M txs, growing faster than expected
✅ DeFi Rotation – Capital is rotating back into blue-chip DeFi. Uniswap isn’t just riding that wave — it’s helping define it.
🏁 What We’re Watching
🟦 Support: $9.73 – this must hold for continuation
🟩 Target 1: $14.72
🟩 Target 2: $17.70 (aligned with $18.08B mcap)
🟨 Risk zone below: $9.03 – invalidation if daily closes below
This is not about retesting old prices. It’s about rewriting the valuation story.
The UNI bulls aren't just hunting a T-bone — they’re after a full 8-figure steak. 🥩🧠
One Love,
The FXPROFESSOR 💙
D isclosure: I am happy to be part of the Trade Nation's Influencer program and receive a monthly fee for using their TradingView charts in my analysis. Awesome broker, where the trader really comes first! 🌟🤝📈

A good moment to try to Buy UNIA good moment to try to buy UNI. We see a strengthening upward trend and now we are closer to the lower border of this trend. We put a stop behind the local low of the sideways. Let's see...
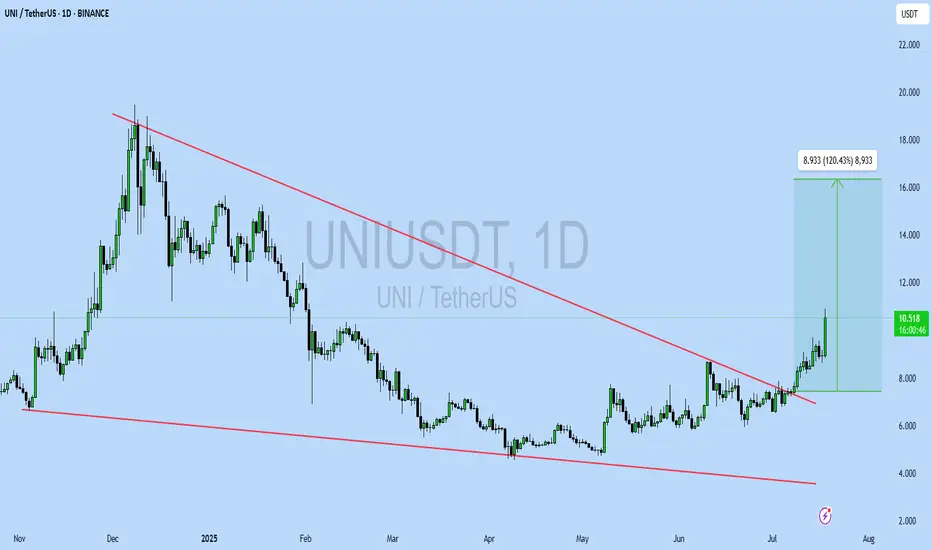
UNIUSDT UPDATE
Pattern: Falling Wedge Breakout
Current Price: \$10.545
Target Price: \$16
Target % Gain: 52%
Technical Analysis: UNI has broken out of a long-term falling wedge on the 1D chart with a strong bullish candle and 18% daily gain. Volume spike confirms breakout momentum with upside potential toward \$16.
Time Frame: 1D
Risk Management Tip: Always use proper risk management.
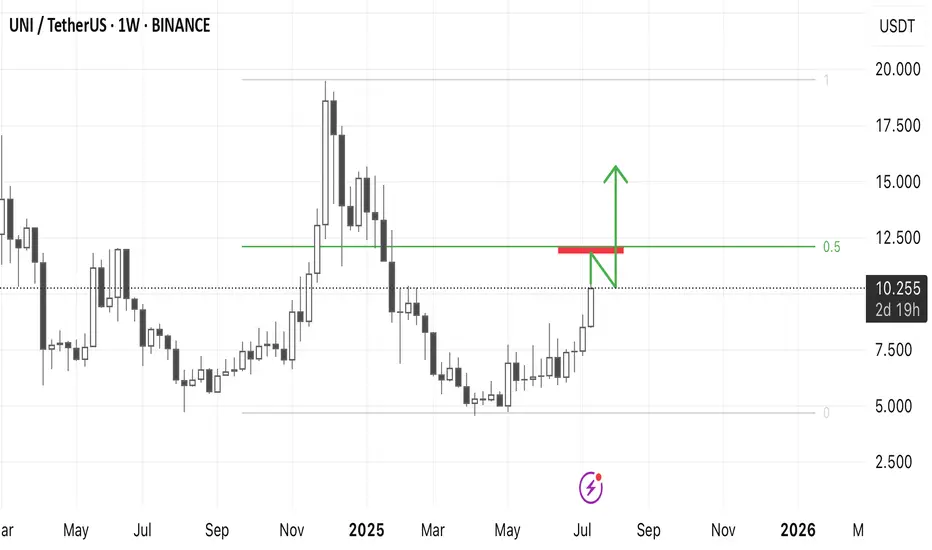
UNI/USDT ANAOThe market is in a very strong bullish mood yet you can still catch places where some cryptos will make some retraces. From the chart UNI is not an exception and at the $12 dollar price it going to face some resistance and retrace back
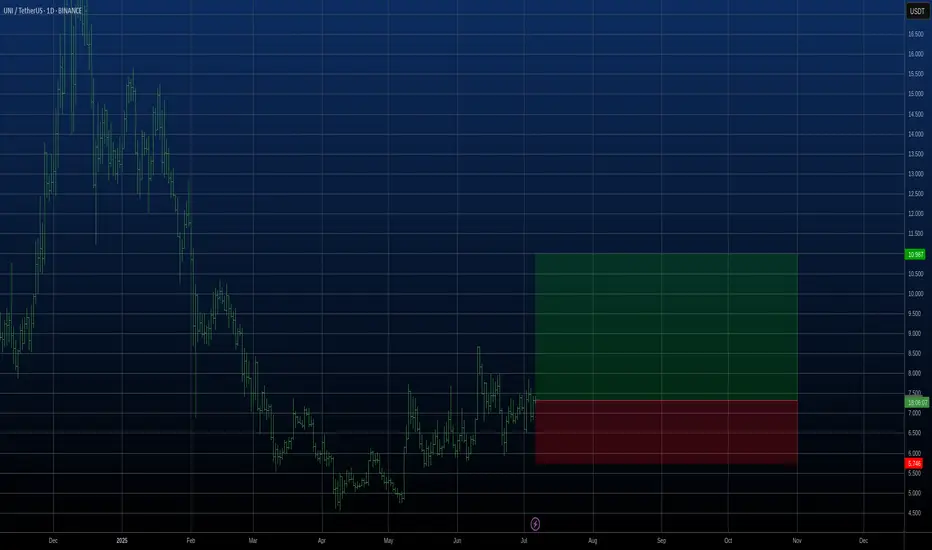
UNI Long Setup – Breakout Retest into High-Confluence SupportUniswap (UNI) has broken out of resistance and is now pulling back into a high-confluence zone, forming a strong bullish structure. The $7.13–$7.73 area presents a favorable entry on the retest.
📌 Trade Setup:
• Entry Zone Around: $7.13 – $7.73
• Take Profit Targets:
o 🥇 $10.50 – $12.85
• Stop Loss: Daily close below $6.50