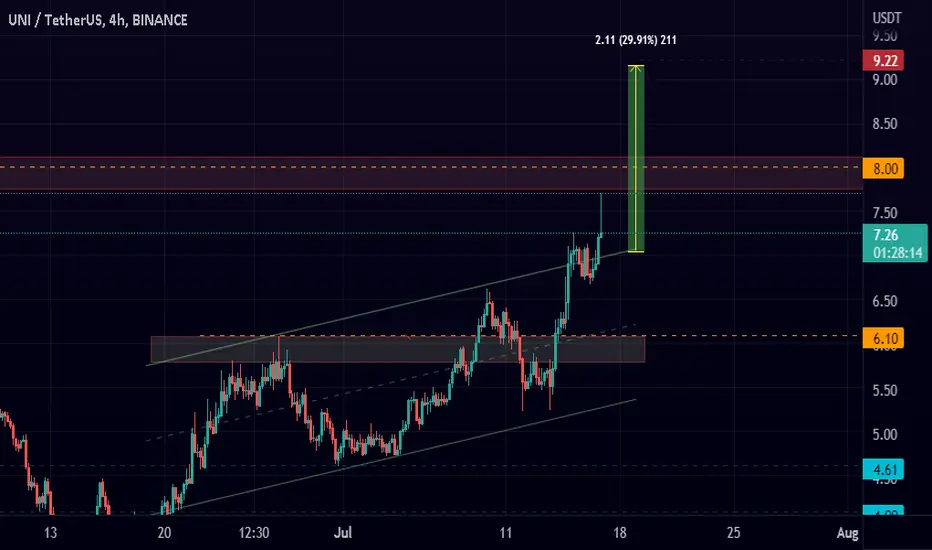
UPDATE: UNI UP 43% after bullish daily signal.UNI pumped 43% after the bullish Supertrend Ninja - Clean signal (green vertical line on the background).
UNI broke out of the bullish Zone of the Ichimoku Cloud , which is bullish. The RSI is in the bullish zone at 63. If we take a look at the Average Directional Index ( ADX DI) its bullish. The +DI (Green Line) is above the -DI (Red Line). While the Trend Strength is becoming stronger. Since the ADX (Orange Line) is above its 9 Period EMA (Black Line). Currently UNI is also above its Bollinger Bands Middle, Band Basis 20 Period SMA. Which is a bullish sign as well.
Waiting patiently on a bullish Supertrend Ninja signal, before entering a long paid off.
Thank you for reading.
Namasté 🙏
Disclaimer: Ideas are for entertainment purposes only. Not financial advice. Your own due diligence is highly advised before entering trades. Past performance is no guarantee of future returns.
What Indicators Do I Use:
In the chart I am using the "Supertrend Ninja - Clean", which is a trend-following indicator (Green and red vertical lines on the background). When the background of the candlestick closes green (vertical line). It indicates a possible bullish (up)trend. And red for downtrends.
UNIUST trade ideas

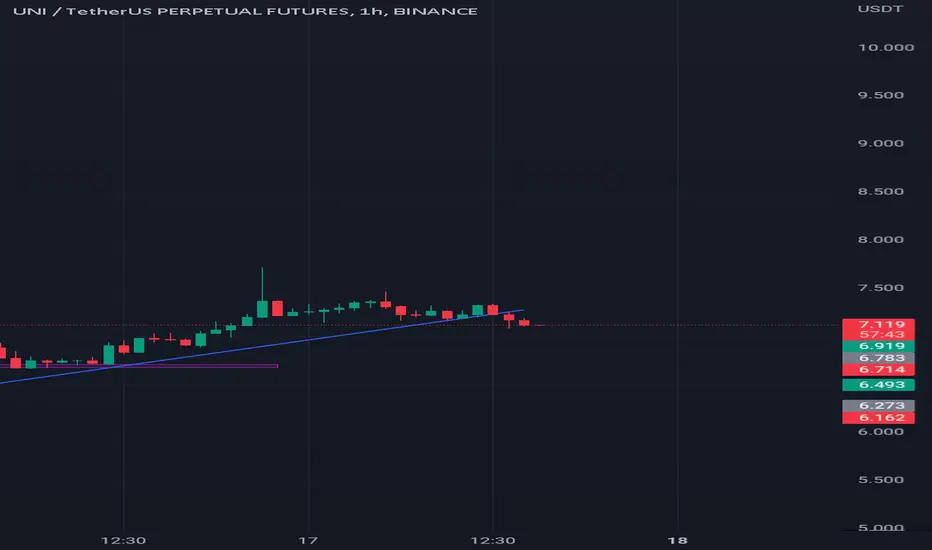
UNIUSDT BULLTRAP OR UPWARD CONTINUATION ?
Hello Traders,
Please feel free to like my idea or even comment :)
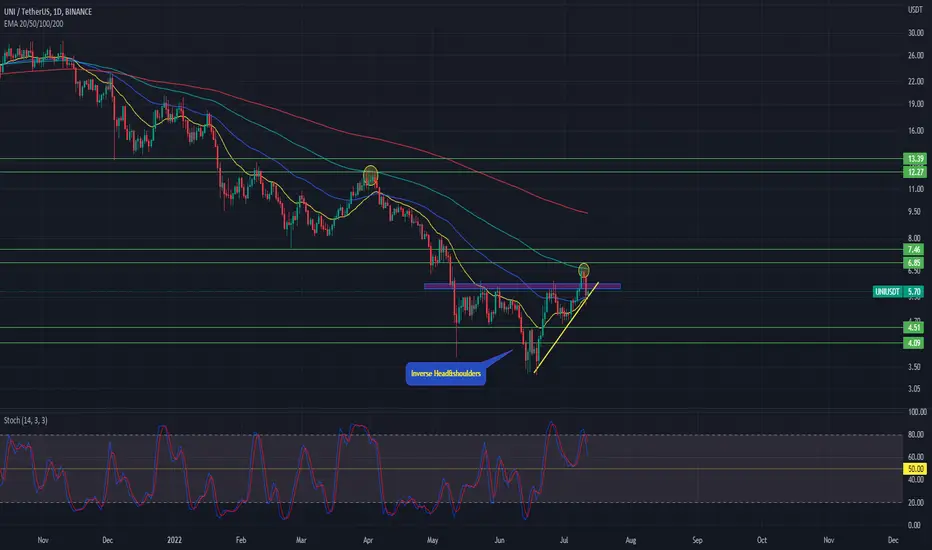
- UNI broke above the local resistance at 6.10$ which completed a bullish inverse head and shoulders pattern. The bears tried to push the price back below the breakout level and they succeed pushing the price below again
suggesting that we were into a bull trap. Price fell towards EMA20 of 5.39$ yet price action bounced back with strength ( aggressive buying ) respecting as well our trendline support. Buyers should take the price above 6.10$ in order to
pick the momentum and reach the nearest resistance level on 6.80$
- If price got weakened and fall below EMA20 and EMA50 it suggests that buyers couldnt bring up the momentum and they are losing control, failing to make a new higher low also by breaking the trendline support, price could fall again
towards support level of 4.00$ - 4.50$
Good Luck Traders
UNIThe price approaches the upper border of the wedge. In case of strong bullish momentum, the wedge can be broken to the level of 200 MAs. Bearish scenario will turn the price down and lower to 50 EMA
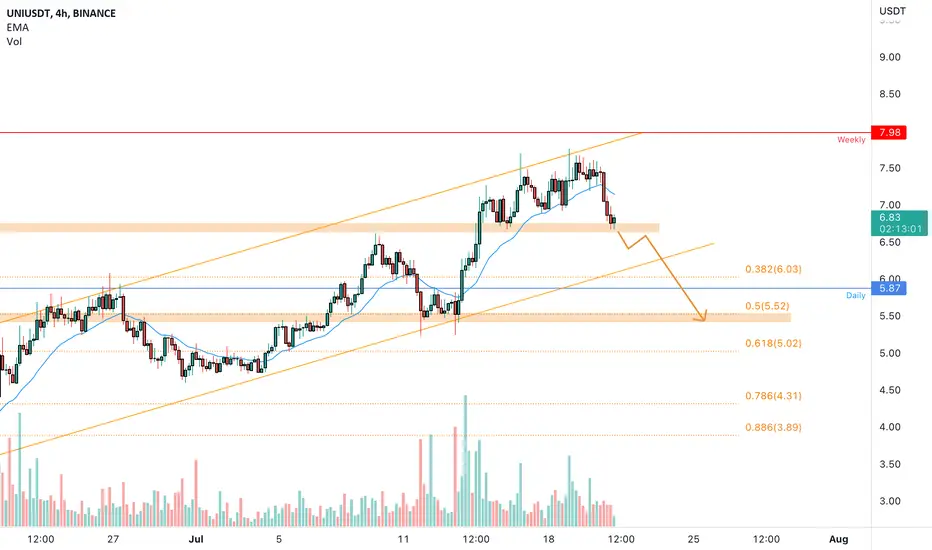
UNIUSDT is inside an ascending channel 🦐UNIUSDT on the 4h chart is trading inside an ascending channel.
The price is now testing the 4h support and might provide a deeper bearish move.
How can i approach this scenario?
I will wait for a clear break of the support and in that case, i will search for a nice short order according to the Plancton's strategy rules.
–––––
Keep in mind.
🟣 Purple structure -> Monthly structure.
🔴 Red structure -> Weekly structure.
🔵 Blue structure -> Daily structure.
🟡 Yellow structure -> 4h structure.
–––––
Follow the Shrimp 🦐
uniusdt short TAuniusdt potential short formation
Uniswap is a cryptocurrency exchange which uses a decentralized network protocol. Uniswap is also the name of the company that initially built the Uniswap protocol. The protocol facilitates automated transactions between cryptocurrency tokens on the Ethereum blockchain through the use of sma

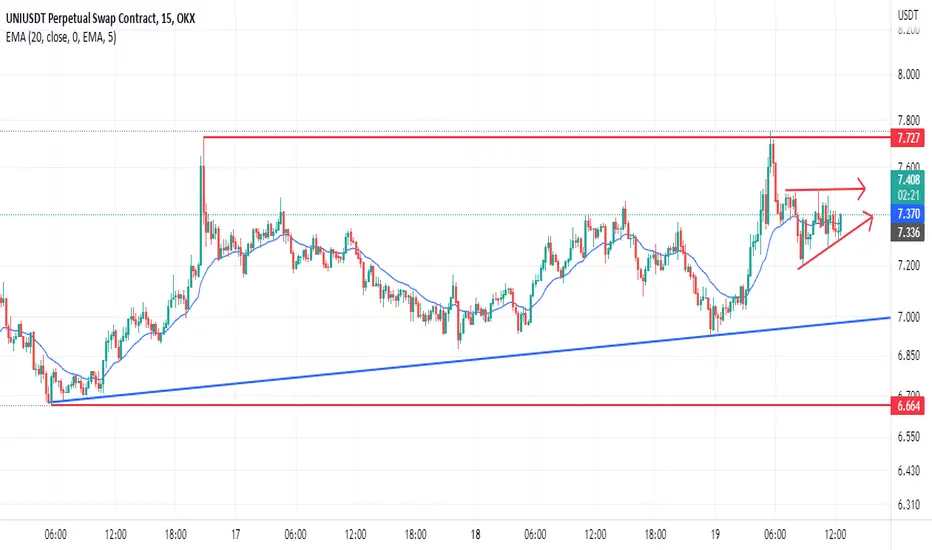
UNIUSDT Chart AnalysisWell how to start !! Everything is in green from the past few days so as UNI, it's in nice uptrend heading towards the resistance which is at around 6% above from here ( Resistance at $8.146).
Currently it's in middle of the river, so what to do now? IMO as $BTC is testing it's breakout zone, I see no reason to be bearish for short term atleast it doesn't mean that I'm suggesting you to go long here, you can trade UNI if you want but make sure you ready to take big risk cause may be the local support zone at $7.3 may hold but don't trade based on the expectations. Let the market to tell us what we need to do.
So what's next? My suggestion is to let it come to one of our zones, may be retracement towards $7.31 price zone, I'll update if I observe high interest there, with respect that you can plan your trade.
What if it headed towards straight away towards resistance well then we can observe again and based on the appearing interest at that time let's decide whether we have to be on long side or short side. See guys no need to rush planning is everything.
Disclaimer : Anything provided here are only my opinions and ideas. I am not giving any financial advices, trade at your risk.

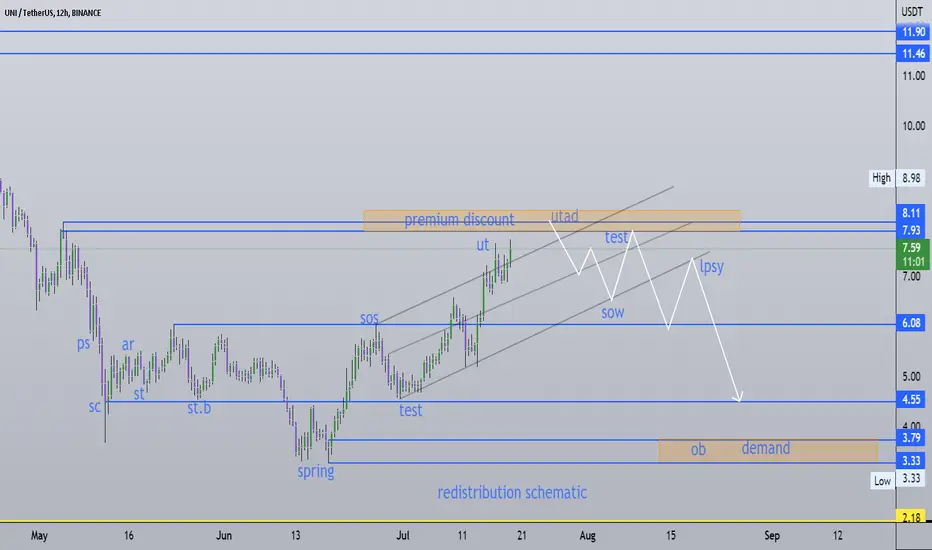
uniusdtuniusdt may see a redistribution schematic and we might get a chance to short it at premium discount
NFA DYOR
UNIUSDTINTRADAY ANALYSIS
Timeframe 15M
Wait until price touches the trend lines then look for signal bar and key bar to recognize direction of price movement.
Money Management should be obeyed.
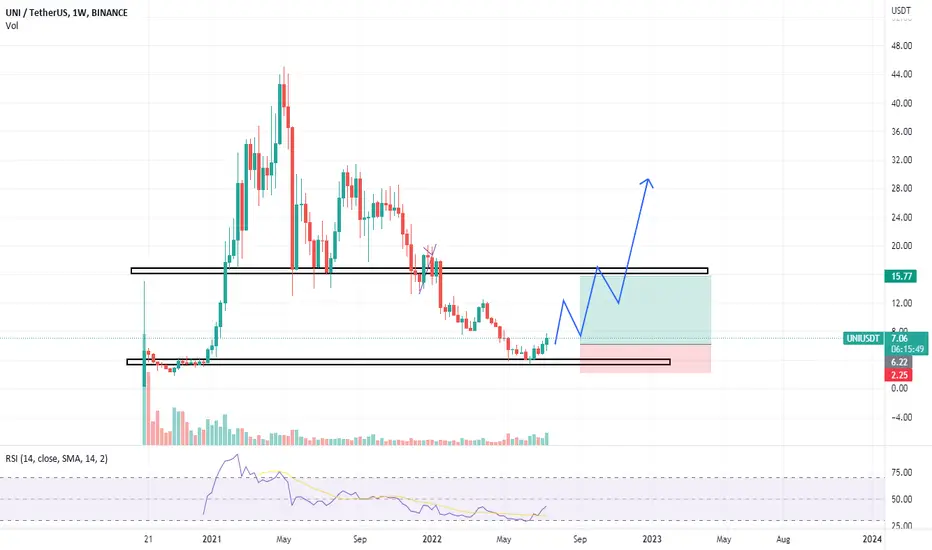
Uniswap Looks Really Strong (150% Easy Target)This is a very strong chart we have for Uniswap (UNIUSDT).
We can see a long-term higher low.
Nov. 2020 vs Jun. 2022.
The 13-June weekly candle ended in a Dragonfly Doji with the highest bull/green volume ever.
Last week UNIUSDT closed above EMA10.
The RSI moved above 40 (strong on the weekly).
Finally, we have a falling wedge pattern already breaking bullish...
All that is left is for prices to grow.
Below $3.30 is the stop.
And the targets/resistance levels can be found on the chart.
Namaste.

UNIUSDTIt is not a buying and selling signal and it is a personal analysis. Any buying and selling is the responsibility of the trader.
UNI FALLING APART! SEE BEFORE ITS TOO LATEUni is breaking the uptrend on the downtrend. It looks pretty bearish now. You can short on a retest
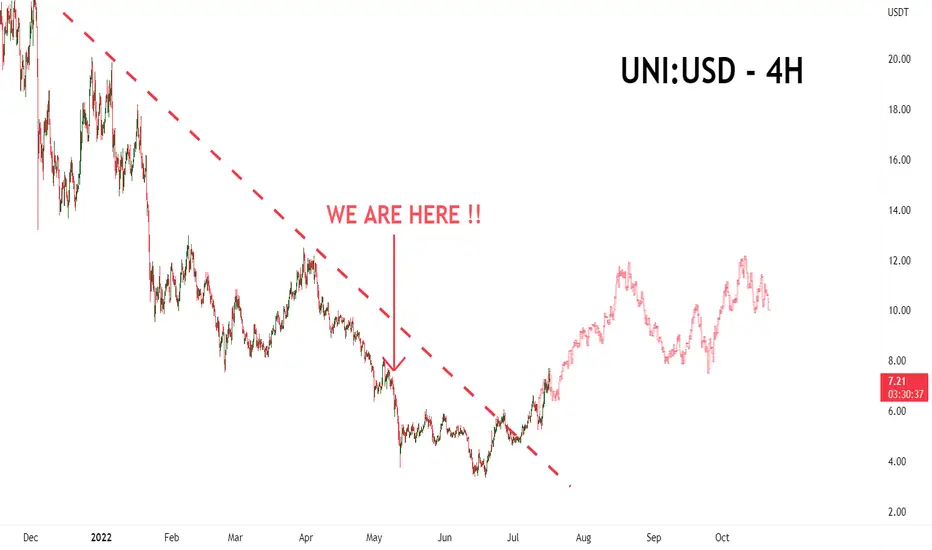
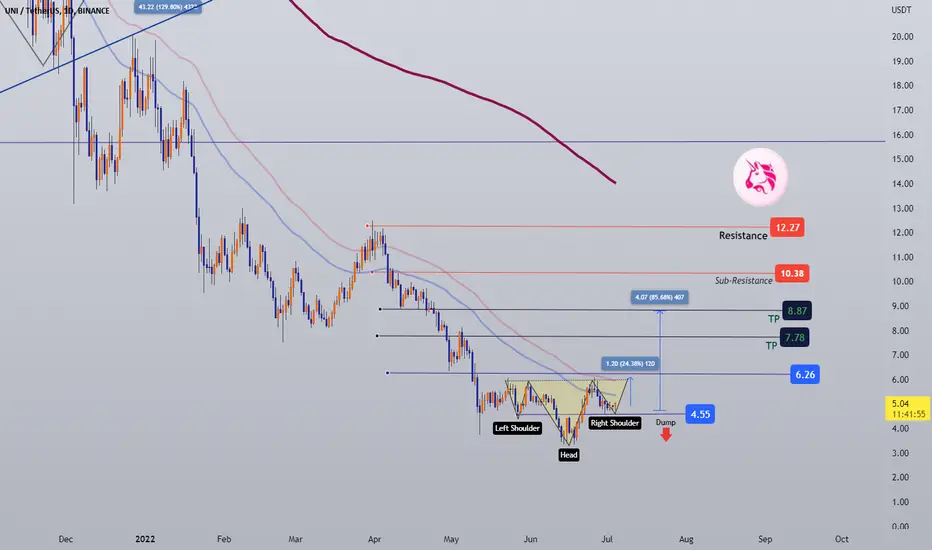
UNI: The Crypto Market Is Pricing In Rate Cuts NOW Recent price action for UNI leads us to believe the cryptocurrency market is pricing in rate cuts now . Cryptocurrency and bond markets are very forward thinking . Therefore, it seems that crypto prices are looking beyond July's expected 100 bp rate hike, and extrapolating that this means the Fed will have to cut rates during the second half of 2022.
Accordingly, we believe this reframing process can power UNI to reach $9 - $12 by August.
Furthermore, with the recent liquidity issues among centralized entities (such as Celsius, Voyager, and others), there is now INCREASED demand for decentralized, transparent, and functional protocols. Alongside Uniswap, other DeFi names we expect to perform in the coming months include AAVE, CRV, MKR, COMP, and SNX.
We're also watching MATIC and SAND closely, as the metaverse represents another forward-thinking sector that can benefit from a near-term bullish shift in sentiment.
UNI Daily Trade Setup>>>>>>>>>>>>>Hello EveryOne
I Have Tried My Best to Bring the best Possible outcome in this Chart.
In the case of close above broken upside channel in Daily-T frame,
We can entry long trade setup>>>>>>>>>
Short term support & resistance's marked on the chart.
TP"s marked clear on the chartm
if this scenario proved.
This is not financial advise.
PLZ DYOR
With hopping success>>>>>>
#UNI (Uniswap) 7 / 2022 Watchlist!#UNI maybe worth it to add this coin to your Watchlist. 👀
(Share it with your friends)
Major support located around $4.5/$4 showing classic pattern H&S as well, looks good to average with a small investment.
our view will fail once UNI breakdown $4 and BTC breakdown $15K with a weekly close below it!
Remember Alts are totally rekt during bearish cycle they always do -92 -95 -99% so be sure to follow risk management.
#DYOR
Everything mentioned on the chart (Pattern/Resistance/Support / Breakout/Breadkwon levels, Also R: R)
add to watchlist means the coin we mentioned is forming a pattern or moving near a historical bottom, around or above good support, increase in trading volume , showing a reversal candle, accumulation stage, etc, but no reaction from bulls, so we inform you to add it to your watchlist until the right time for entry.!!
Ps:
we avoid trading any coin if the entire project for it is based on gambling, prostitution, human trafficking, borrowing, and lending, etc.
This is not financial advice, The purpose of these Charts is to give you an idea about coin movement (not buy or sell signal) so before following any idea be sure to make your own research and follow risk management.
The Cryptocurrency market is very volatile and involves gains and losses, so know very well what you are heading towards before engaging in it.
The information we mentioned here is a personal effort so it subject to success or failure.
Good luck to All.
🙏we ask Allah reconcile and repay🙏
uni shortuni is in good position for a good short gain . targets has been pointed out in chart
plus it has a divergence in daily time frame

Uniswap Falling Wedge UpdateUpdate on Uniswap falling wedge , a bullish pattern
Price has seemingly broken out at a critical point of this pattern
