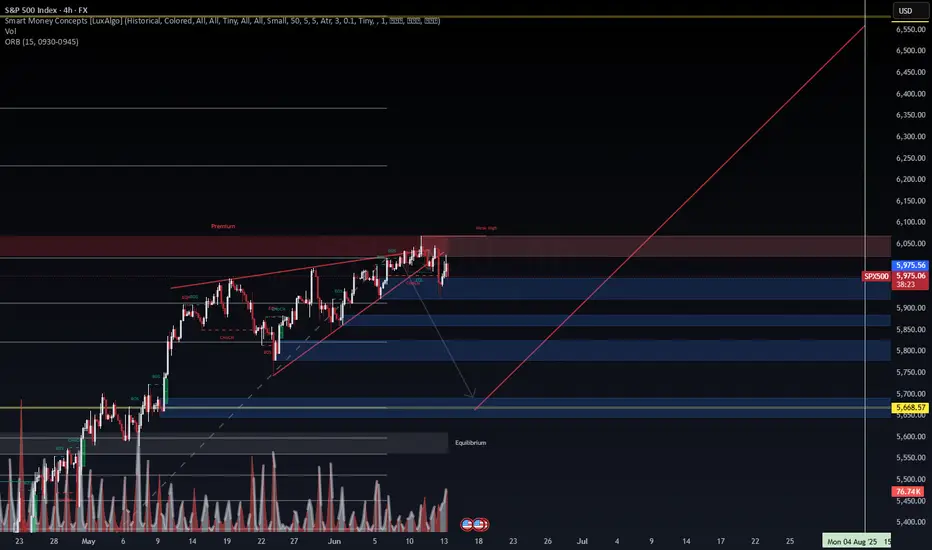
SPX500 – 4H Smart Money Concepts | Compression Breakout & LiquidThe S&P 500 has broken down from a tight ascending wedge within a premium zone, confirming a CHoCH and suggesting a shift in short-term order flow. A corrective move is now unfolding.
🔻 Bearish Short-Term Outlook:
Weak High + CHoCH within the premium zone confirms rejection.
Multiple FVGs below offer potential draw zones:
5,900
5,850
Strong liquidity pool near 5,668.57
🧠 Smart Money Roadmap:
Structure suggests a short-term liquidity hunt below recent lows.
Equilibrium zone rests near 5,650, ideal for reaccumulation/reload.
📈 Long-Term Outlook Remains Bullish:
If liquidity objectives are met and macro improves, we may see a bullish reversal back above 6,050 toward:
6,200+
Mid/long-term fib targets near 6,500
📊 Strategy Insight:
Short-term trade: Scalps into the 5,700–5,660 zone.
Macro timing: Watch July CPI/FOMC for bullish or bearish confirmation.
Long-term positioning: Start building once price reclaims structural BOS with a displacement.
🎯 Smart money plays both ways — sweep liquidity, then reprice.
#SPX500 #SMP500 #SmartMoneyConcepts #OrderFlow #LiquiditySweep #FVG #CHoCH #PremiumZone #TechnicalAnalysis #VolumeProfile #EquityMarkets #WaverVanir #TradingView
US500.F trade ideas
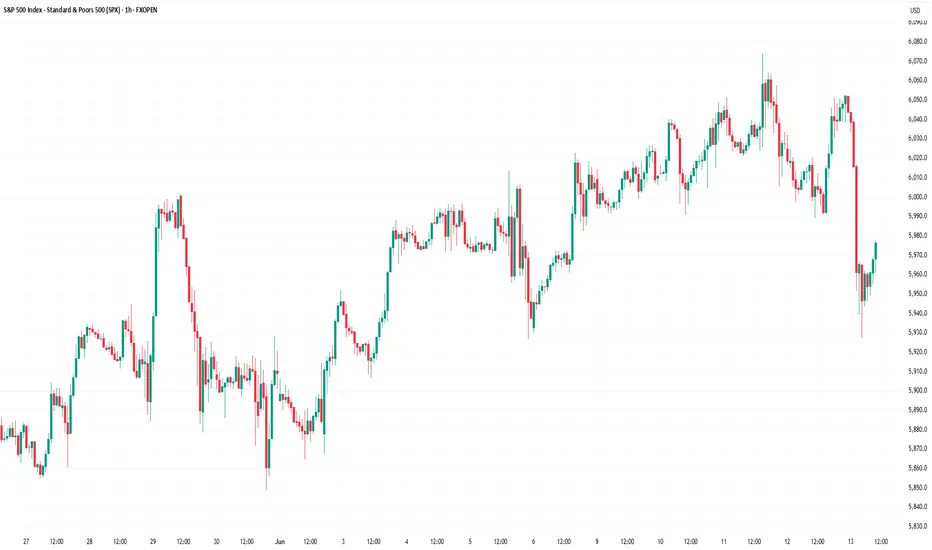
S&P 500 Breaks UptrendS&P 500 Breaks Uptrend
Only yesterday we questioned the sustainability of the stock market’s upward trend amid alarming news from the Middle East and the evacuation of the US embassy in Iraq — and today, the S&P 500 chart (US SPX 500 mini on FXOpen) shows a break below the lower boundary of the ascending trend channel.
According to media reports:
→ Steve Witkoff, US President Donald Trump’s special envoy to the Middle East, was expected to meet Iran’s Foreign Minister in Oman on Sunday.
→ Friday the 13th became the date when Israel launched strikes on Iran’s nuclear facilities, dramatically altering the outlook for a potential US-Iran nuclear agreement.
→ Secretary of State Marco Rubio stated that the US was not involved in the operation, while Israel’s state broadcaster reported that Washington had been informed ahead of the strikes.
Technical Analysis of the S&P 500 Chart
Yesterday morning, we noted that the Q-line, which divides the lower half of the channel into two quarters, had shifted from acting as support to becoming resistance. This was confirmed during the US trading session (as indicated by the arrow).
Selling pressure intensified, and the psychologically important 6,000 level — which showed signs of support earlier in June — now appears to be acting as resistance. It is in this area that the E-Mini S&P 500 (US SPX 500 mini on FXOpen) broke below the lower boundary of its uptrend channel.
In addition to ongoing discussions about potential Fed rate cuts this summer, geopolitical risk assessments are now also in focus. It remains unclear how Washington will respond if Iran retaliates.
Meanwhile, Israel’s Defence Minister has declared a state of emergency, warning of an imminent missile and drone attack — further fuelling fears of a possible escalation.
This article represents the opinion of the Companies operating under the FXOpen brand only. It is not to be construed as an offer, solicitation, or recommendation with respect to products and services provided by the Companies operating under the FXOpen brand, nor is it to be considered financial advice.
mid afternoon updateSPY looks like it's about to break down harder than usual. Gold had a flase breakdown. NG testing support. Oil looking to rally. BTC dropping to support here, but can go much farther down.

Markets Watch: Caution Ahead? U.S. stock index futures rose Monday, buoyed by easing oil prices, even as geopolitical tensions between Israel and Iran simmer in the background. All eyes are now on the upcoming Federal Reserve meeting. 👀💼
But here’s the catch on the S&P 500 👇
🔹 Price is stalling at a resistance line, tracing back to March highs
🔹 Daily RSI shows major divergence, signalling a loss of momentum
🔹 Rally is slowing just as it approaches the Feb all-time high at 6147
📉 If the index fails to hold and breaks below:
🔻 The 200-day MA at 5808
🔻 Key pivot levels at 5773 (Jan low) and 5787 (March peak)
…then we could see real downside pressure emerge.
🛑 For now, the market is showing red flags at a critical level. Stay alert — this could get interesting.
Disclaimer:
The information posted on Trading View is for informative purposes and is not intended to constitute advice in any form, including but not limited to investment, accounting, tax, legal or regulatory advice. The information therefore has no regard to the specific investment objectives, financial situation or particular needs of any specific recipient. Opinions expressed are our current opinions as of the date appearing on Trading View only. All illustrations, forecasts or hypothetical data are for illustrative purposes only. The Society of Technical Analysts Ltd does not make representation that the information provided is appropriate for use in all jurisdictions or by all Investors or other potential Investors. Parties are therefore responsible for compliance with applicable local laws and regulations. The Society of Technical Analysts will not be held liable for any loss or damage resulting directly or indirectly from the use of any information on this site.

post market ideasSPX rallied into resistance today, so far it's being held back there. Gold looks like a bounce is coming but I don't think it lasts. NG is looking more and more bullish. USOIL found support under 70 and should test the highs from Friday. BTC looks like it could come down a bit here.

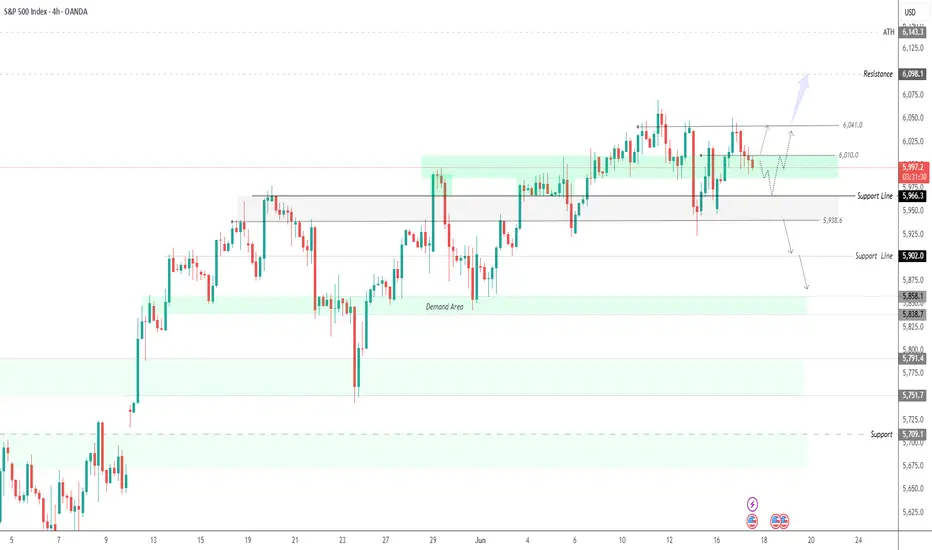
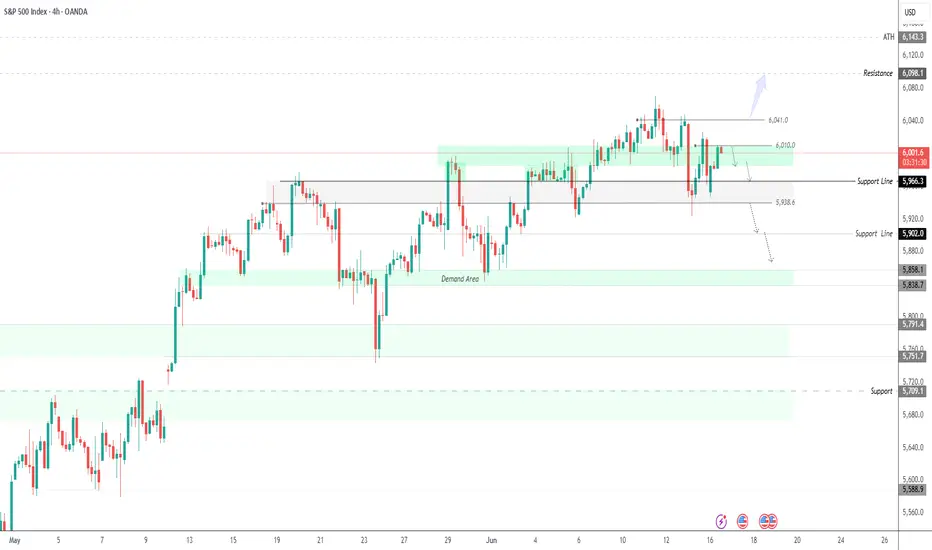
SPX500 Under Pressure Amid Renewed Israel-Iran TensionsSPX500 Overview
Israel-Iran Truce Hopes Collapse
Investor hopes for a swift de-escalation between Israel and Iran were quickly shattered as both sides resumed hostilities. The situation intensified further after U.S. President Donald Trump urged Iranian civilians to evacuate Tehran and abruptly ended his participation at the G7 summit, reportedly convening the U.S. National Security Council.
These developments have fueled broad risk-off sentiment across markets.
Technical Outlook:
SPX500 remains under bearish pressure as long as the price trades below 6010. A continued drop toward the key support at 5966 is likely, with a break below this level potentially opening the path to 5938 and 5902.
However, if the price stabilizes above 5966 without breaking it, we may see a rebound attempt toward 6010 and 6041.
Any signs of negotiation or de-escalation in the conflict could trigger a strong bullish reversal.
Support: 5966, 5938, 5902
Resistance: 6041, 6098, 6143
SPX500 – Cautious Optimism as Market Eyes Fed DecisionSPX500 – Cautious Optimism as Market Eyes Fed Decision
Futures tied to the S&P 500 are slightly higher as traders appear to be shrugging off Middle East tensions, viewing the situation as contained for now. However, geopolitical uncertainty remains a risk, and attention is shifting toward upcoming Fed commentary and policy direction.
Technical Outlook:
The index may pull back toward 5989 and 5966. A break below 5966 opens the path toward 5938, with an extended target at 5902.
However, a 1H close above 6010 would signal renewed bullish momentum toward 6041.
Key Levels:
• Resistance: 6041, 6098, 6143
• Support: 5966, 5938, 5902
Geopolitics vs. Fed: SPX500 Trading Below Key Pivot at 5966SPX500 – Overview
Geopolitical Tensions & Rate Decisions Keep Markets on Edge
Investor focus has shifted from monetary policy to geopolitics, as speculation grows over a potential U.S. military strike on Iran.
According to Bloomberg, senior U.S. officials are reportedly preparing for possible action in the coming days. This comes as global markets remain cautious ahead of key central bank meetings that are expected to provide updated guidance on growth and inflation.
Technical Outlook:
SPX500 remains under bearish pressure as long as the price trades below 5966.
A break and hold below 5966 targets 5938, with further downside toward 5902 and 5885
For a shift to bullish momentum, price must stabilize above 6010
• Support: 5938 / 5902 / 5885
• Resistance: 5989 / 6010 / 6041

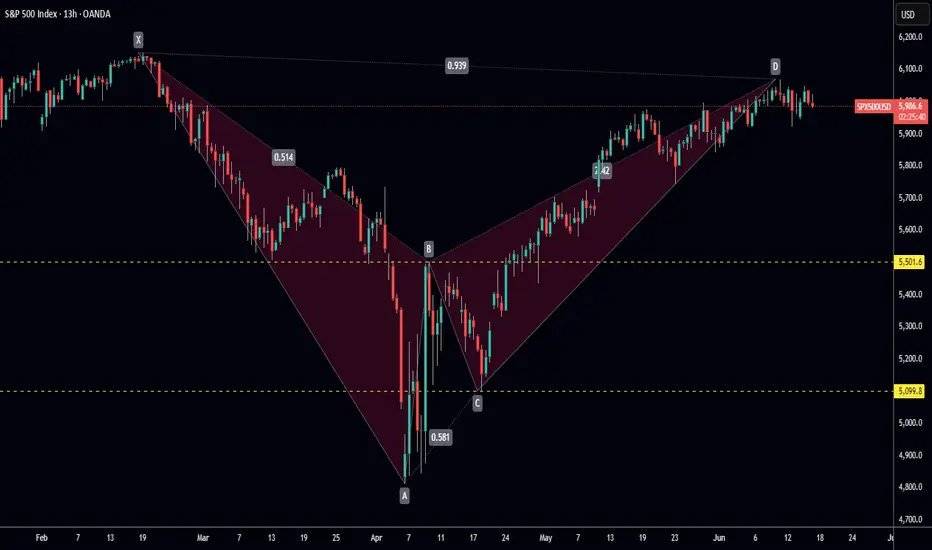
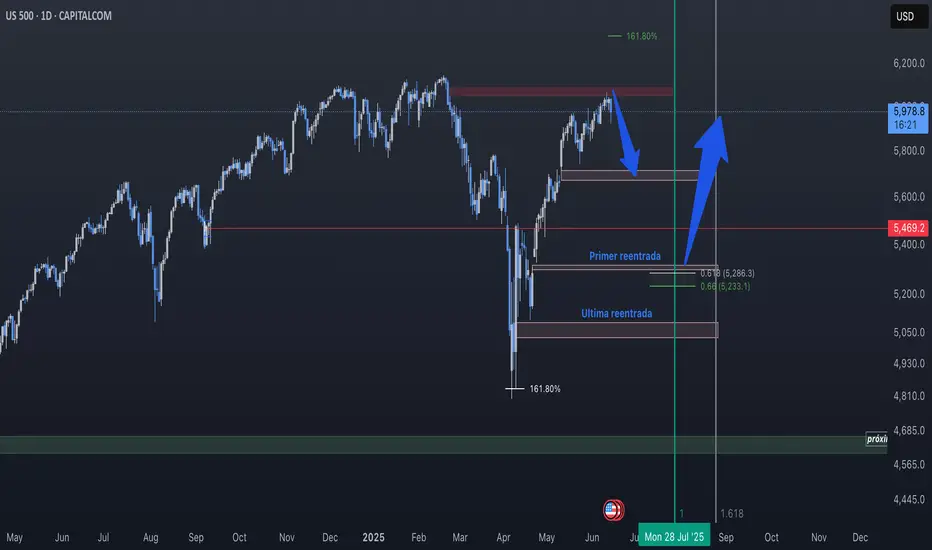
The sell moment is coming? SP500Market is greed as of now, and the chart is showing a potential reversal pattern. I expect a quick short liquidation first and a big short next. I expect the market to retrace till the 5700 level in the coming weeks.
If you are a scalp trader, check my accounts page!
S&P500 Update: Break of Lower TrendlineIn this video, I updated the wave count for S&P500 and discussed 2 different ways of counting it but ended with a bias on a stronger wave 3 down as opposed to a wave 5 of 1 down.
The stop loss is above 6016, with 2 take profit targets:
1) 5940
2) 5923
Good luck!

COMPLETED 5 of 3 or C RSI bearish Non confirmation The chart is now labeled as COMPLETED . Please also take note of The HUGE difference in QQQ to QQQE and SPY to RSP . Best of trades Wavetimer 115 % short

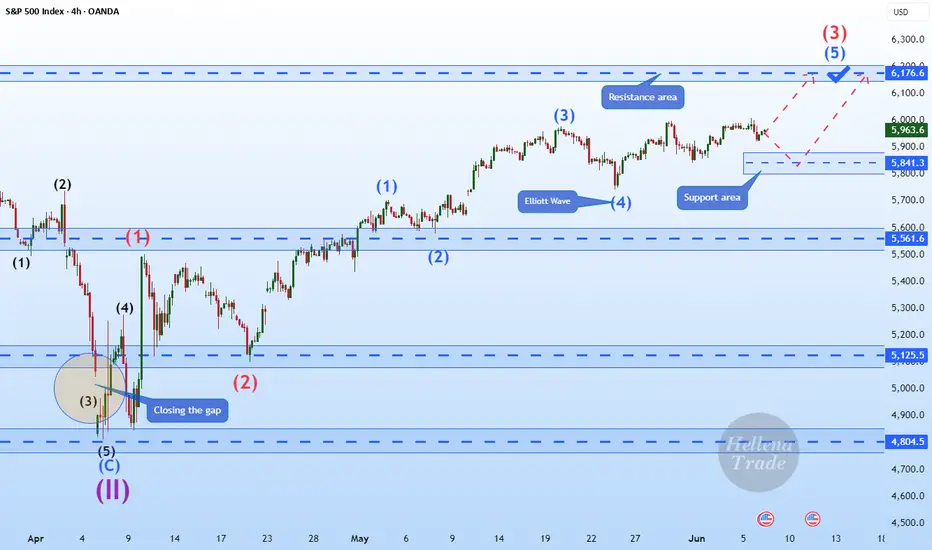
Hellena | SPX500 (4H): LONG resistance area of 6176.6.Colleagues, it appears that price has not yet completed the upward movement in a five-wave move.
At the moment I expect the continuation of wave “3” and reaching the target in the resistance area of 6176.6.
Manage your capital correctly and competently! Only enter trades based on reliable patterns!
You're all doomedEveryone has gone full bull again. The selloff is not over. The selloff is about to resume. The shorts are MIA. Down til Christmas. Starts this week.
The market still has ample room to grow!Society isn't crumbling yet.... We'll get there sure enough, but as for now, there is still plenty of spoils to be had.

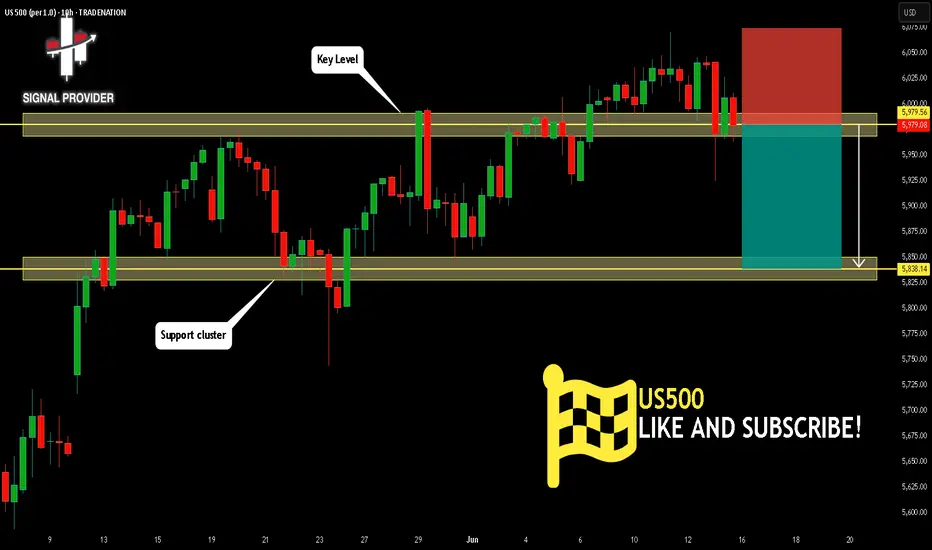
US500 Will Fall! Short!
Here is our detailed technical review for US500.
Time Frame: 10h
Current Trend: Bearish
Sentiment: Overbought (based on 7-period RSI)
Forecast: Bearish
The market is approaching a significant resistance area 5,979.56.
Due to the fact that we see a positive bearish reaction from the underlined area, I strongly believe that sellers will manage to push the price all the way down to 5,838.14 level.
P.S
Overbought describes a period of time where there has been a significant and consistent upward move in price over a period of time without much pullback.
Disclosure: I am part of Trade Nation's Influencer program and receive a monthly fee for using their TradingView charts in my analysis.
Like and subscribe and comment my ideas if you enjoy them!
sp500 shortI feel things.
War in the other side that justifies the downside.
It will be amazing to see powel saving the us stock by cutting rates on summer.
Lets chill and see what happens, liquidity is also a position.
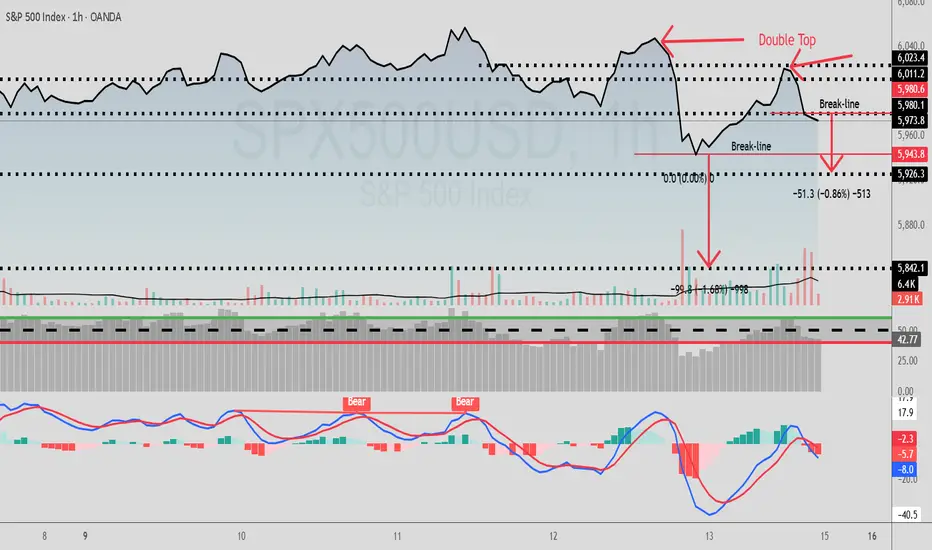
SPX/USD Has A Double Top Pattern On The 1Hr Hey Traders and following gang!
Hope all are raking in profits on all your trades.
I spotted this double top setup on the 1hr SPX/USD.
A break below 5980.6 triggers a short down to target-1 5926.3
A break below 5943.8 triggers a short down to target-2 5842.1
A little scuffle in the Mid East helps this market fall so, short the ticker .
Best of luck in all your trades my friends and stay profitable $$$
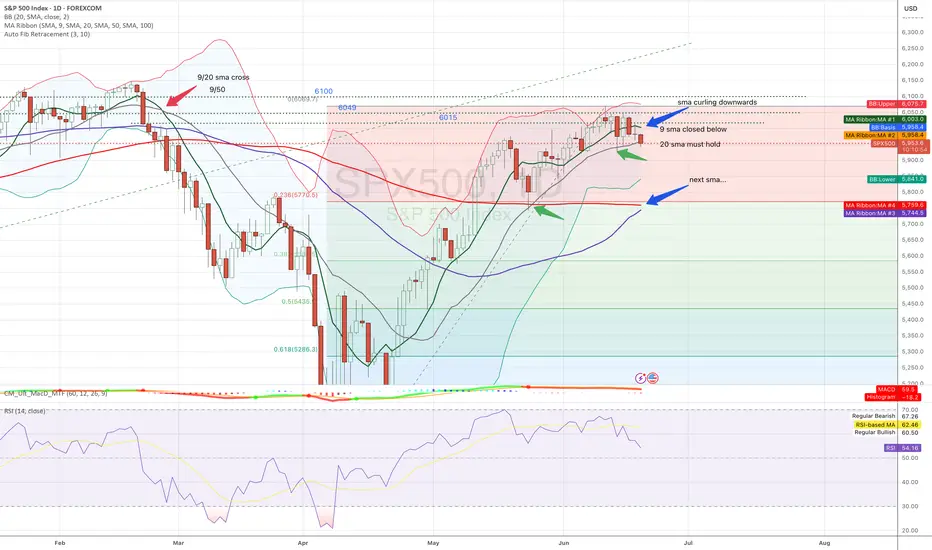
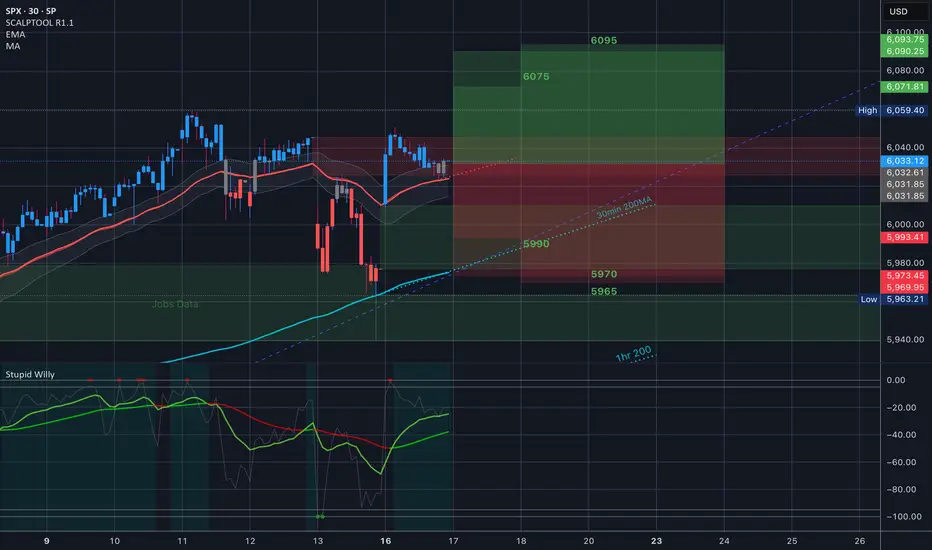
SPY where are we going into OPEX and last week of June tradingYesterday was almost an indecision candle on daily. Markets cheered the jobs data earlier in day with a nice green candle, however the pump faded going into FOMC, where AMEX:SPY and SP:SPX were around 600/ 6000 at 2pm. FOMC event mostly turned out to be a "non-event". While the no rate cut and 2 for 2025 were largely expected, Powell spooked the markets commenting that he expects higher inflation in months ahead due to tariffs. Off course this set of a set of comments from Trump which was expected as well.
While markets are closed today (Juneteenth) futures are open, and in after hours and now we have drifted downwards... as of this writing SPX is around 5950. Bulls lost the 9 sma yesterday and now are trying to defend the 20 sma. Tomorrow is OPEX so expect some volatility and movement to where big money is positioned.
Certainly bulls can show up and reclaim 9 ma at 6003 or if we lose 5950, the next level down is below 5800. Meanwhile JPM collar is intact... Do we go down from here. Tomorrow will be key as we will know if we have lost 20 sma or regained 9 sma and how this week candle looks like.
Bulls can charge but is there enough gas in tank to make meaningful upside move? Maybe possible pump to open next week (around 6060 was recent high), but bears are now lurking to take us down towards that 5800 level next week.
As I said earlier tomorrow will be telling and I will update over the weekend.
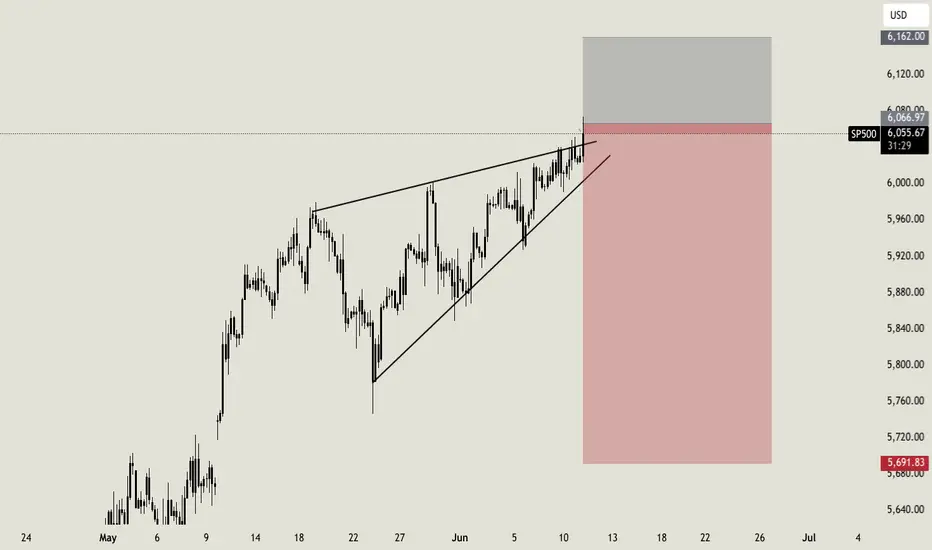
Rising wedge + Bearish divergence + GAP at 5700 + new war !!!Rising wedge + bearish divergence + GAP down at 5700.
And yes, a new war in the Middle East. Higher oil prices are coming — Iran controls the Hormuz Strait, where 20–30% of the world’s oil is transported. Yes, Iran is on the sanctions list, but other countries aren’t — they trade with Iran and resell the oil to the rest of the world. Triangle trade.
But that supply of 20–30% is about to disappear due to the war. Higher oil prices mean higher expenses. A lot of the world still relies on oil as an energy source.
We’re also out of the previous trend we had before the tariffs.
DYOR (Do Your Own Research).

$SPX // June 17 2025 // CPI Analysis & Targets for Day TradersSP:SPX // June 17 2025 // CPI Analysis & Targets for Day Traders
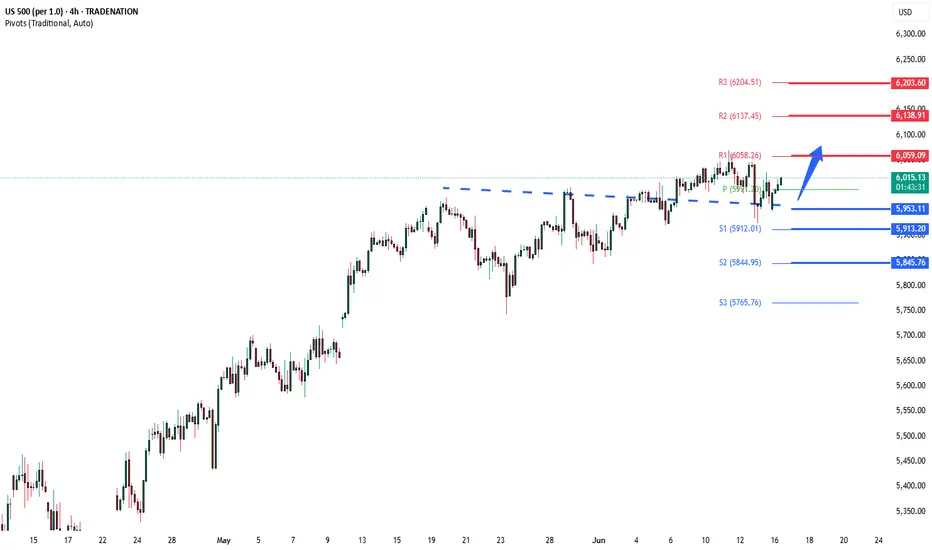
S&P500 INTRADAY support retest The Israel-Iran conflict has now entered its fourth day, with no signs of de-escalation. Iran launched more missile attacks, while Israel struck back, targeting a major gas field and a key military figure. Notably, Israeli strikes damaged Iran’s uranium facility in Isfahan, and an Iranian missile caused minor damage near the U.S. consulate in Tel Aviv.
While these developments added geopolitical stress, markets showed some resilience:
Oil prices pulled back after initial gains but remain volatile as the risk of supply disruption in the Middle East — a region supplying ~1/3 of global crude — persists.
S&P 500 futures edged higher, indicating investors are not fully in risk-off mode, but remain cautious.
On the political front, Donald Trump reportedly blocked an Israeli plan to assassinate Iran’s Supreme Leader. He mentioned the possibility of a future agreement between the two sides but said more conflict may come first. Trump is attending the G7 summit in Canada today, where leaders will discuss how to manage the Middle East crisis and navigate diplomacy with Trump.
For S&P 500 traders:
Monitor oil prices — a sharp spike on new escalation could weigh on risk sentiment.
Headlines from the G7 and any sign of U.S. involvement or de-escalation efforts could shift markets.
Geopolitical risk remains elevated, but the market is currently pricing in a contained conflict.
Key Support and Resistance Levels
Resistance Level 1: 6,058
Resistance Level 2: 6,138
Resistance Level 3: 6,200
Support Level 1: 5,953
Support Level 2: 5,913
Support Level 3: 5,845
This communication is for informational purposes only and should not be viewed as any form of recommendation as to a particular course of action or as investment advice. It is not intended as an offer or solicitation for the purchase or sale of any financial instrument or as an official confirmation of any transaction. Opinions, estimates and assumptions expressed herein are made as of the date of this communication and are subject to change without notice. This communication has been prepared based upon information, including market prices, data and other information, believed to be reliable; however, Trade Nation does not warrant its completeness or accuracy. All market prices and market data contained in or attached to this communication are indicative and subject to change without notice.
Market at 10amSome quick notes. Everything looks choppy. Gold looks promising for an upmove. Natural gas maybe breaking out.
