S&P 500 Breaks Out — Trump, Tariffs & Bullish Island PatternDonald Trump has mentioned the US stock market in every meeting he has held in the past few days, which has caused the US stock market indices , including the S&P500 Index ( SP:SPX ), to rise:
"Better go out and buy stocks now".
President Donald Trump told a crowd in Saudi Arabia on Tuesday that the markets are just getting started. “It’s going to get a lot higher,” he said, right as the S&P 500 posted its first gain since late February.
But one of the main reasons for the increase in the S&P 500 Index and US stocks is The United States has dropped its tariffs on Chinese goods to 30% , down from a brutal 145% , while China is slashing its own duties on US imports to just 10% , temporarily, for the next 90 days .
-------------------------------------------------
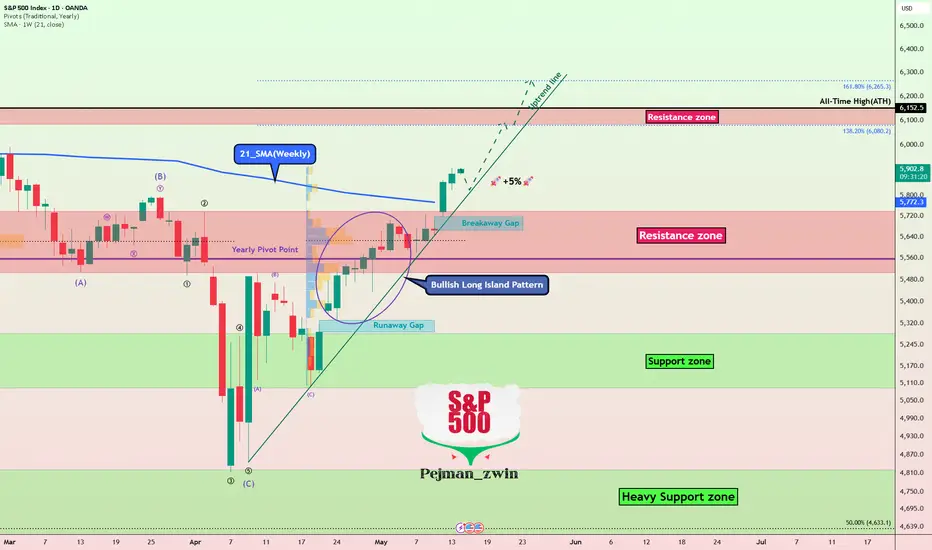
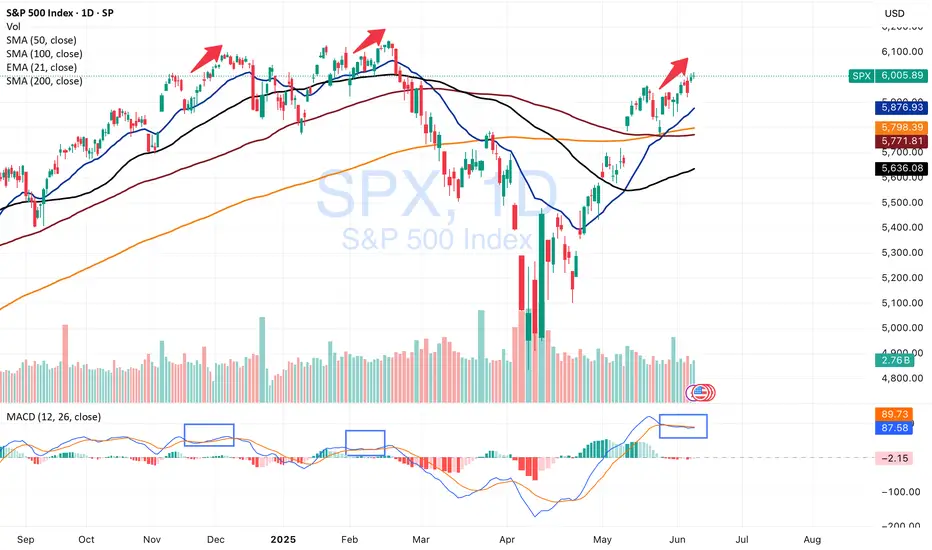
Now let's take a look at the S&P 500 Index chart on the daily time frame .
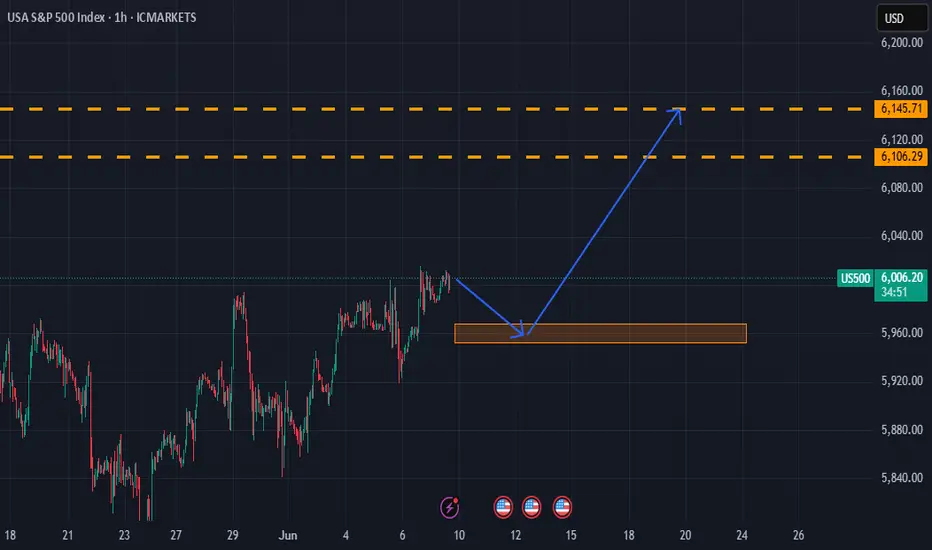
S&P500 Index managed to break the Resistance zone($5,737_$5,506) and 21_SMA(Weekly) by Breakaway Gap .
In terms of Classic Technical Analysis , the S&P500 Index has managed to form a Bullish Long Island Pattern , and this pattern is one of the continuing patterns and will be a sign of the continuation of the S&P500 Index's upward trend .
In terms of Elliott Wave theory , it seems that the S&P500 index has completed the corrective wave and is in new impulsive waves , which could cause a new All-Time High(ATH) to form.
I expect the S&P500 index to increase by at least +5% as it approaches the Uptrend line , and we will see the possibility of a new ATH .
Please respect each other's ideas and express them politely if you agree or disagree.
S&P 500 Index Analyze (SPX500USD), Daily time frame.
Be sure to follow the updated ideas.
Do not forget to put a Stop loss for your positions (For every position you want to open).
Please follow your strategy and updates; this is just my Idea, and I will gladly see your ideas in this post.
Please do not forget the ✅' like '✅ button 🙏😊 & Share it with your friends; thanks, and Trade safe.
US500.F trade ideas
Market at 10amSome quick notes. Everything looks choppy. Gold looks promising for an upmove. Natural gas maybe breaking out.

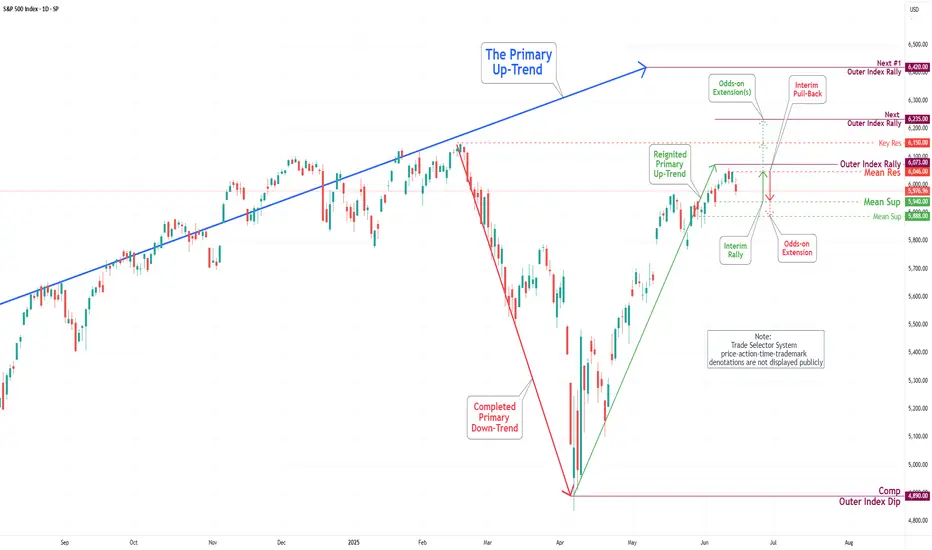
S&P 500 Daily Chart Analysis For Week of June 13, 2025Technical Analysis and Outlook:
The S&P 500 Index has displayed both upward and downward movements throughout this week's trading session, narrowly missing the targeted Outer Index Rally level of 6073. Currently, the index is characterized by a bearish trend, warranting attention towards the Mean Support level of 5940, with additional critical support identified at 5888.
Conversely, there exists a significant potential that, upon reaching the Mean Support of 5940, the index may recover and rise to the Mean Resistance level of 6046. This upward movement could facilitate an interim rally, culminating in the completion of the Outer Index Rally at 6073 and enabling the index to address the Key Resistance level positioned at 6150.
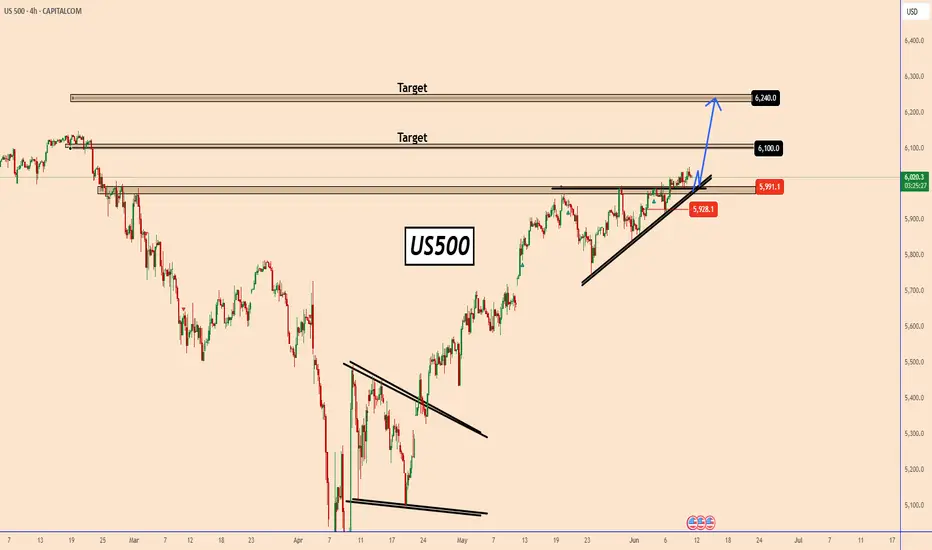
US500 Could Rise Further After U.S - China Trade FrameworkUS500 could rise further after U.S.-China Trade Framework - Bloomberg
After two days of marathon negotiations in London, the U.S. and China agreed to a “framework” for resuming a trade truce that had unraveled in recent weeks. Top economic officials from both countries are expected to present it to President Trump and Xi Jinping, China’s leader, for final approval.
This news could boost the stock market today, and the US500 could rise further after the two leaders confirm this agreement.
US500 is well-positioned for another upward wave.
The price broke out of a bullish triangle pattern, suggesting further gains.
Key upside targets are 6100 and 6240.
You may find more details in the chart!
Thank you and Good Luck!
❤️PS: Please support with a like or comment if you find this analysis useful for your trading day❤️
My favorite skitzo line in the S&P 500This is a test post, but it's also one of the single most potentially vindicating technical analysis ideas of all time: that the market really is an oracle that encodes the entirety of relevant information.
This trendline uses a logorithmic scale that intuitively "counterbalances" monetary policy and every other value-traveling dynamic like financial technologies and increasing market efficiencies, et cetera. It's a textbook trendline--Murphy says a trendline is a line that connects two highs or lows--and these highs and lows are the country's most violent economic crises: "The Great Depression" and "The Recession".

S&P 500 Short Update: Ending DiagonalEnding diagonals completed. Stop above 6040. Take profit at 5744 first.

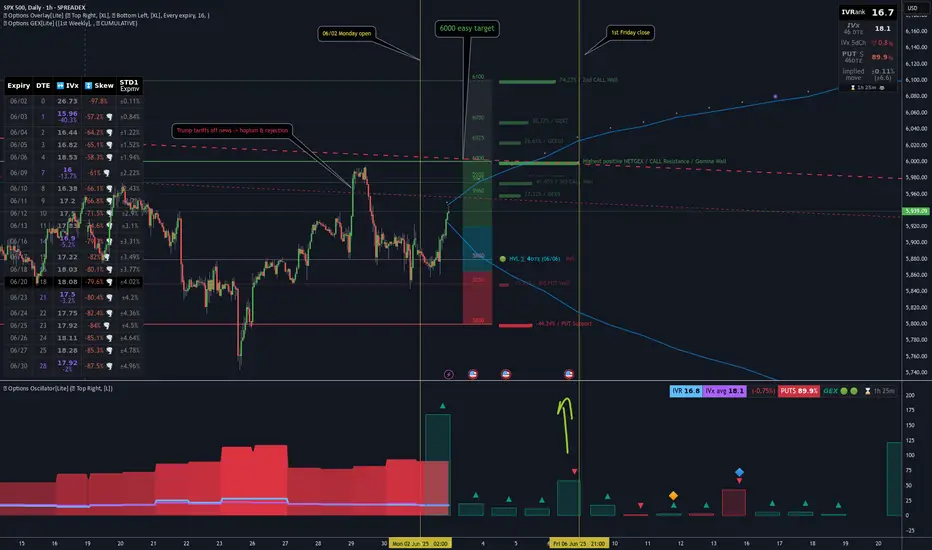
06/02 Weekly GEX Analysis - 6000 Looks EasyThe biggest event last week was undoubtedly the court ruling involving Trump. The market responded with optimism, and on Thursday premarket, SPX surged toward the 6000 level — only to get instantly rejected. That strong rejection suggests this is a firm resistance zone.
From the GEX expiry matrix, it's clear that the market is hedging upward for this week, but downward for next week. To me, this indicates that while the near-term GEX sentiment remains slightly bullish, the market may be preparing for a pullback or retest in the medium term.
This week, SPX has already entered a GEX zone surrounded by positive strikes — up to around the 6000 level. That makes 6000 an “easy target” for bulls, and we’ll likely see profit-taking here, just like we did last Thursday premarket.
⚠️ However, if we look more closely at the weekly net open interest:
...we can see a strong bullish net OI build-up starting to emerge around the 6100 level — a price zone that currently feels distant and even unreachable. But if the 6000 resistance breaks, we could see a fast gamma-driven squeeze up to 6050 and possibly 6100 before the next wave of profit-taking kicks in.
As is often the case during bullish moves, the market seems blind to the bigger picture — no one’s looking down, only up. The mood is greedy, and momentum favors the bulls... for now.
Never underestimate FOMO — but also never underestimate Trump. He’s unlikely to accept the court’s decision on tariffs quietly. Any new negative headline could shake the market, no matter where price is sitting…
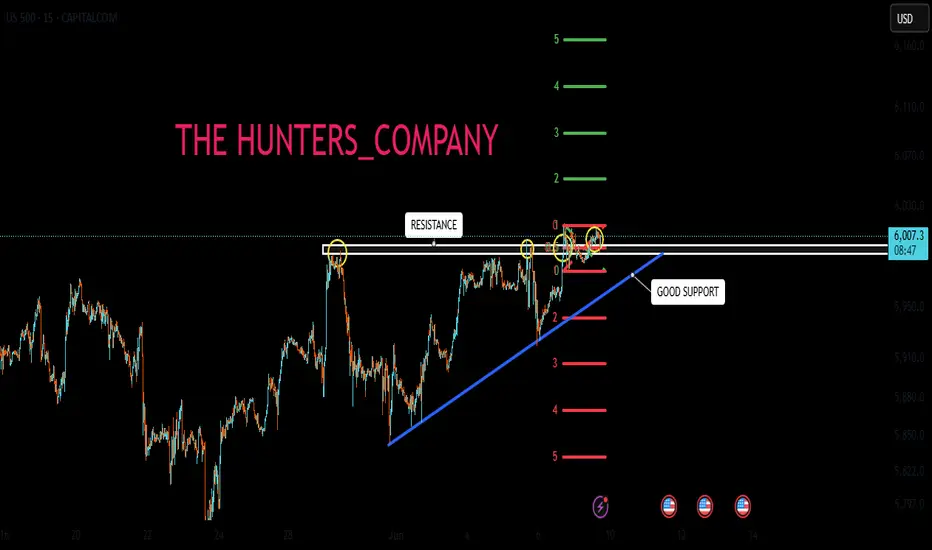
up or down...Hello friends🙌
🔊As you can see, the US500 index has been identified with several resistance encounters and the good support that the price has been able to break the resistance and turn it into support. Now, according to today's news, it seems that the price is targeting higher targets that we have identified for you.
In case of correction, it has strong support ahead of it, which we have identified with a white line, but don't forget that buyers have entered...📈
🔥Join us for more signals🔥
Trade safely with us.
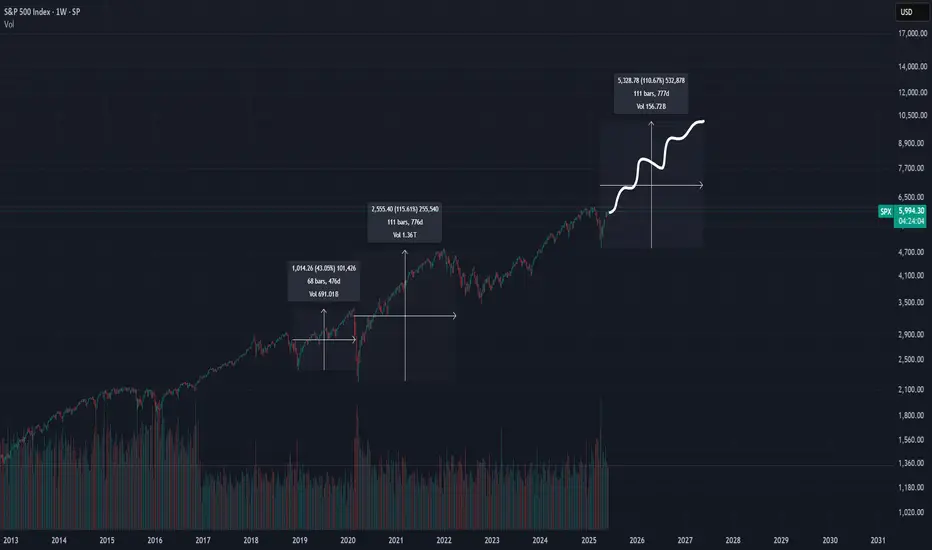
Another leg of bull market comingBeing bearish in the stock market—especially after such a big correction and a V-shaped recovery—is definitely not a good idea. Probability and past history are against you. If Trump succeeds in bringing more jobs by tarrifs and reduce government expending as he promises, it could easily keep the uptrend going for the next two years and push past the 10,000 level, just like 2018 and 2020
Elliott Wave Perspective: S&P 500 (SPX) Set to Finish Wave 3Since reaching its low on April 7, 2025, the S&P 500 (SPX) has embarked on an impulsive rally. From that bottom, the index progressed through distinct waves, as defined by Elliott Wave theory. Wave 1 concluded at 5246.57, followed by a corrective pullback in wave 2, which found support at 4910.42. Currently, wave 3 is underway, unfolding as a strong impulse with subdivisions in a lesser degree.
From the wave 2 low, the rally continued with wave ((i)) peaking at 5481.34. A brief retracement in wave ((ii)) then followed which ended at 5101.63. The index then surged higher in wave ((iii)), reaching 5968.61. A subsequent pullback in wave ((iv)) found support at 5767.41, setting the stage for further gains. The index should push to a few more highs to complete wave ((v)) of 3. This will mark the culmination of this upward phase.
Looking ahead, once wave 3 concludes, a corrective wave 4 should follow, retracing part of the rally from the April 7, 2025 low. This correction could unfold in a 3, 7, or 11-swing pattern before the index resumes its upward trajectory. In the near term, as long as the pivot low at 5765.74 holds, the S&P 500 is poised to achieve additional highs to finalize wave ((v)) of 3. However, if this critical support at 5765.74 is breached, it would signal the end of wave 3, prompting a larger wave 4 pullback, potentially in a 3, 7, or 11-swing structure.

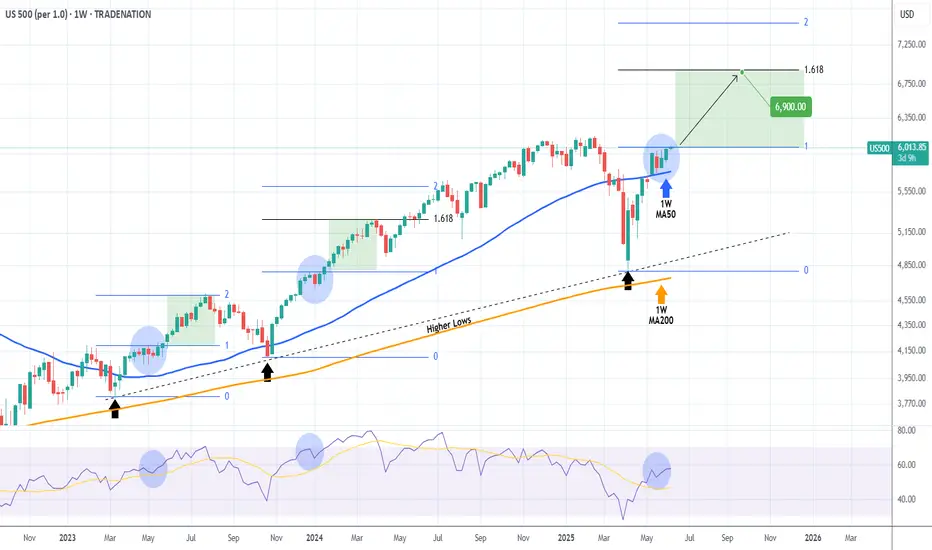
S&P500 No signs of stopping here. Can hit 6900 before years end.The S&P500 index (SPX) has turned the 1W MA50 (blue trend-line) into Support, successfully testing it and holding and is now going for the All Time High Resistance test. Based on its 1W RSI structure and candle action, it resembles the previous times since 2023 that after a quick consolidation, it broke upwards again aggressively.
As you can see, both of those Bullish Legs that started on the 2023 Higher Lows trend-line, hit at least their 1.618 Fibonacci extension before a new 3-week red pull-back. In the case of 2024, even the 2.0 Fib ext got hit a little later.
As a result, we expect to see at least 6900 (Fib 1.618) before the end of 2025, with the good case scenario (Fib 2.0) going as high as 7500.
-------------------------------------------------------------------------------
** Please LIKE 👍, FOLLOW ✅, SHARE 🙌 and COMMENT ✍ if you enjoy this idea! Also share your ideas and charts in the comments section below! This is best way to keep it relevant, support us, keep the content here free and allow the idea to reach as many people as possible. **
-------------------------------------------------------------------------------
Disclosure: I am part of Trade Nation's Influencer program and receive a monthly fee for using their TradingView charts in my analysis.
💸💸💸💸💸💸
👇 👇 👇 👇 👇 👇
SPX500 Technical Outlook: Balancing Risk and RewardPost Content:
🔍 SPX500 Analysis - 4H Timeframe
Our latest technical analysis showcases a detailed approach to the S&P 500 Index using Smart Money Concepts, Fibonacci tools, and volume dynamics. Here's the breakdown:
1️⃣ Trend Structure
The price has formed a wedge within the premium zone, indicating potential exhaustion.
BOS and ChOCH markers highlight key pivots, emphasizing a weak high and strong low.
2️⃣ Fibonacci Insights
We're observing equilibrium near 5,668.57, a critical area where price may consolidate or pivot.
Higher Fibonacci extensions suggest an upside target near 6,580.38, should momentum hold.
3️⃣ Risk-Adjusted Strategy
Short Opportunity: Bearish retracement expected toward equilibrium; target around 5,668.57.
Long Opportunity: Look for confirmations to buy at the discount zone or post-retracement breakout above the weak high.
4️⃣ Volume Dynamics
Spikes at key pivot points signal institutional activity, strengthening the validity of liquidity zones.
📊 Trade Setup Overview
Entry: Short near premium zone OR Long near equilibrium/discount zone.
Stop-Loss: Place below the strong low for longs or above weak highs for shorts.
Target: Extensions at 6,580.38 align with the broader bullish sentiment.
🎯 Key Takeaway: This model emphasizes patience, precision, and risk management. Be sure to monitor upcoming macro events and confirm entry triggers before committing to any position.
🌟 Follow WaverVanir International LLC for more actionable insights, technical breakdowns, and AI-driven strategies!
📈 Trade Safe,
Team WaverVanir International LLC

S&P 500 Short Update 2: Shifting wave degreeHi all,
As I explained in this video, the previous idea was invalidated because of an issue with "degree" of wave that a fellow watcher of my idea rightly pointed out in the comments section. I did the change on this video and explain the mistake I made in the previous idea.
In this video, I also talked about the last wave, how it can still be the peak but on the bigger picture, it is still too small compared to wave 1 and 3.
I then recommend 3 "safer" entry points:
1. One reversion trade at the top of the trendline.
2. One breakdown from the diagonal trendline.
3. One breakdown from the 4th wave support price.
Which entry point(s) you choose depends on your personal preference and opportunity. The stop will be above where you identify as the peak at your point of entry.
Good luck!

SPX500 BUYGreeting there traders this is my analysis on
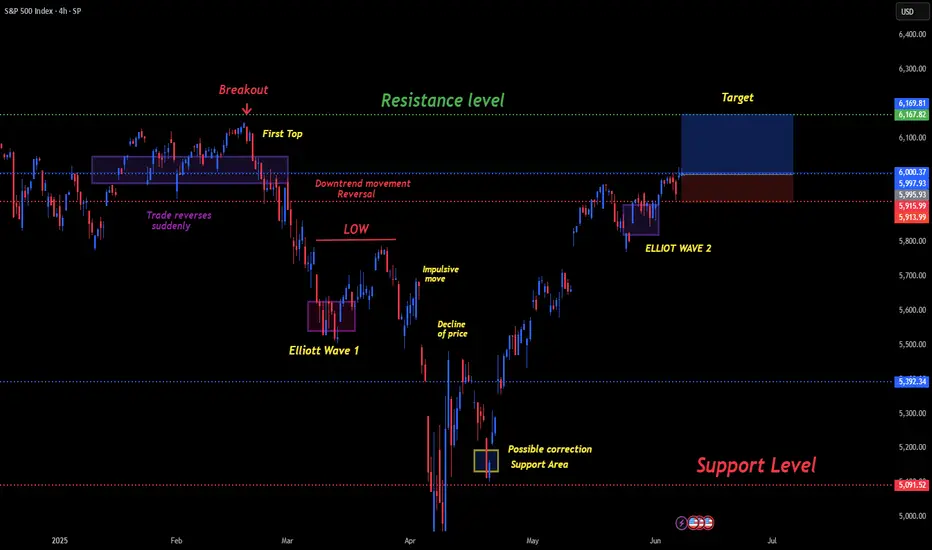
📊 S&P 500 – Potential Elliott Wave 3 Formation | Long Setup
The current 4H chart of the S&P 500 suggests a potential bullish continuation based on Elliott Wave Theory. Here's the structured breakdown:
🔹 Wave 1: Initiated after a failed breakout and sharp reversal from a previous resistance zone. This impulsive move marked a key shift in trend structure.
🔹 Wave 2: A corrective phase followed, consolidating near the support area (~5,915), respecting previous demand.
🔹 Current Price Action: Price has broken above the minor resistance at 6,000, indicating the potential beginning of Wave 3, which is typically the strongest and most extended wave in the sequence.
📈 Trade Setup:
Entry: Above 6,000 (confirmation of breakout and wave continuation)
Stop Loss: Below 5,915 (invalidates bullish structure if broken)
Target Zone: 6,167 – 6,170 (aligned with prior resistance and wave projection)
🔍 Additional Notes:
The breakout is supported by a clean structure and rejection from key support.
Ideal scenario would involve increasing volume and continuation with higher highs and higher lows.
📌 Bias: Bullish – targeting Wave 3 extension.
⚠️ Always manage risk accordingly and watch for signs of exhaustion or divergence.
Dear Traders like,comment let me know what do you think?
S&P500 INTRADAY consolidation range Boeing Crash: An Air India Boeing 787 crashed after takeoff from Ahmedabad to London, killing all 242 on board. It’s the worst accident involving this model. Boeing shares dropped on renewed safety concerns.
Trump Tariffs: Donald Trump plans to set new tariff rates within 1–2 weeks before a July 9 deadline. The EU may be last to get a trade deal. Japan is cautious about any agreement.
US-UK Trade Deal: The US and UK plan to move quickly on a trade deal. The EU is expected to face delays.
Tariff Pause: The US may extend a 90-day pause on tariffs for countries negotiating seriously.
Middle East Tensions: The US is pulling embassy staff as tensions rise. Iran warned of retaliation if nuclear talks fail. Reports say the US is preparing for a possible Israeli strike on Iran. Oil prices eased.
Key Support and Resistance Levels
Resistance Level 1: 6060
Resistance Level 2: 6120
Resistance Level 3: 6172
Support Level 1: 5960
Support Level 2: 5900
Support Level 3: 5800
This communication is for informational purposes only and should not be viewed as any form of recommendation as to a particular course of action or as investment advice. It is not intended as an offer or solicitation for the purchase or sale of any financial instrument or as an official confirmation of any transaction. Opinions, estimates and assumptions expressed herein are made as of the date of this communication and are subject to change without notice. This communication has been prepared based upon information, including market prices, data and other information, believed to be reliable; however, Trade Nation does not warrant its completeness or accuracy. All market prices and market data contained in or attached to this communication are indicative and subject to change without notice.
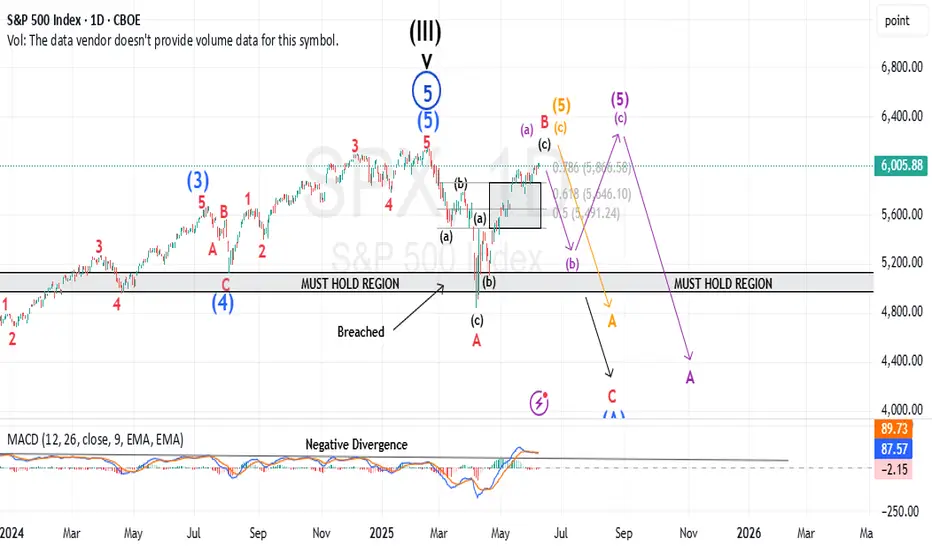
A Potentially Dangerous Pattern Takes ShapeWhile the futures market has yet to break into new all-time high territory, the previously discussed bearish micro setup has now been invalidated. In its place, we’re witnessing a complex, overlapping advance—creeping steadily toward the prior highs in the S&P 500 (ES).
At the micro level, I currently see no compelling bearish setup. However, this grinding upward move—lacking strong conviction from either buyers or sellers—is not necessarily bullish. In fact, it’s a hallmark of a potentially dangerous pattern: a primary degree ending diagonal.
If my interpretation is correct, both the “orange” and “purple” wave counts point to the same ominous conclusion. They suggest that what we're seeing could culminate in a sharp, possibly violent reversal—one that would ultimately retrace back to where this entire primary wave began. For reference, that’s just above 4,000, marked by the conclusion of Primary Wave 4 in October 2022.
This is the moment for caution—not after the damage is done.
Yes, we may push into new all-time highs. But within this fragile and overlapping structure, that outcome is far from guaranteed. Even if we get there, the looming question remains:
At what cost?
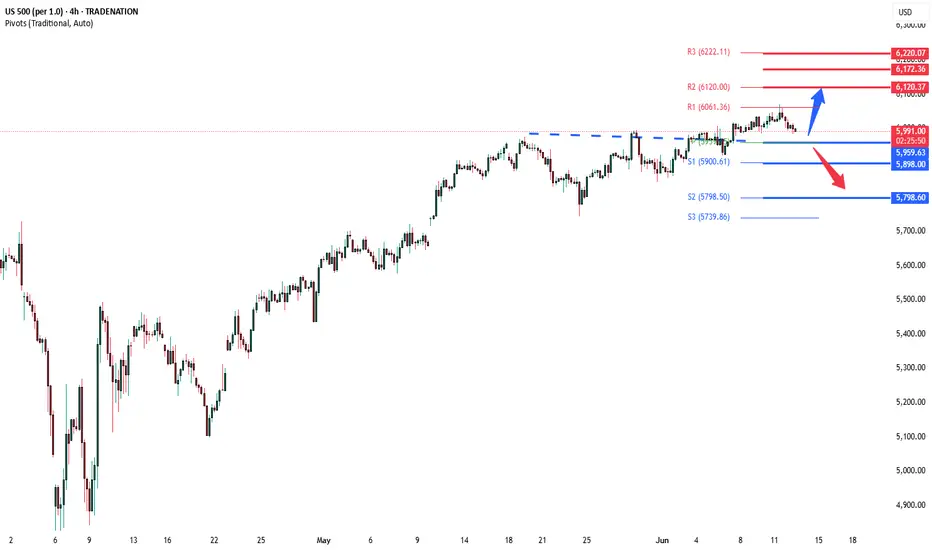
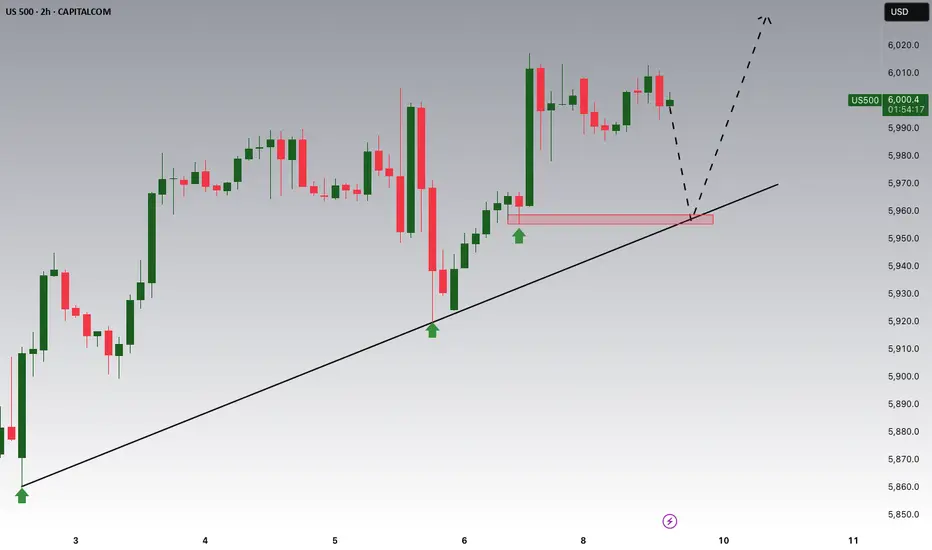
S&P500 is Nearing an Important Support of 5,960!!!Hey Traders, in today's trading session we are monitoring US500 for a buying opportunity around 5,960 zone, US500 is trading in an uptrend and currently is in a correction phase in which it is approaching the trend at 5,960 support and resistance area.
Trade safe, Joe.
SPX500 | Bearish Below 6010 Ahead of PPI – Trade Talks in FocusSPX500 | OVERVIEW
US Futures Edge Lower Ahead of PPI Report
U.S. stock futures dipped on Thursday as investors await the latest PPI data, following a softer-than-expected CPI report that eased pressure on the Federal Reserve to hike rates.
On the geopolitical front, U.S. and Chinese negotiators have reached a preliminary trade agreement during talks in London. However, the deal still requires formal approval from Presidents Trump and Xi.
📉 Technical Outlook:
The index holds a bearish momentum as long as it trades below the pivot level at 6010. If price remains under this level, it may extend the decline toward 5966, and a firm close below this support could open the path to 5938 and 5902.
📈 A bullish reversal may occur if the price breaks above 6010, with confirmation on a 1H close above 6020, targeting higher resistances.
Support Levels: 5966, 5938, 5902
Resistance Levels: 6033, 6056, 6098

usa 500 analyse*The content on this analysis is subject to change at any time without notice, and is provided for the sole purpose of assisting traders to make independent investment decisions.
Recession? Weak. Let's Do a DepressionS&P pulled a fast one — but the real show might be just warming up.
Markets tease, bounce, tempt. And then — they punish.
After a sharp rebound, S&P500 is still below 6,150, with weak volumes. The recent rally looks more like a bear trap than a new impulse.
Trading note:
Possible short entries can be considered from current levels, with 50% now, 25% near 6,000, and 25% at 6,100. Stop-loss only after 4H close above 6,150. No clean levels below that — only noise and traps.
This market isn't about fundamentals. It's about desperation. Participants are chasing returns in a shrinking pie, taking on absurd risks.
And now, buckle up:
We are entering what might be the most dramatic market weeks in decades. This is setting up to be a mega-short, folks. Get ready for turbulence. Fasten your seatbelts.
---
Important:
This is NOT a recommendation to trade. This is an extremely high-risk scenario shared for discussion purposes only. If you've already made such a mistake and entered, respect your money and risk management. Losses are much harder to recover than gains.

SPX Danger ZoneLog chart of SPX with a trendline connecting 1929 top to 2000 dot com top and up to 2024-25 top.
We already touched this trendline multiple times at the end of 2024 and the beggining of 2025, after which we saw a 20ish percent pullback.
If history rhymes, then we can expect a top at 6250-6350 area in the next few months and we might even stay around there for some time trapping retail investors and other foverever bulls. However, the crash ranging beteween 50 percent (2000 dot com bubble burst) and 86 percent (1929 Wall Street crash) might unravel over the next few years.
With the amount of leverage in the market this house of cards can tumble down even quicker.
Take care.

Lack of momentum on Macd indicator on SPX Price action making new HIGH But MACD lines show slow momentum . Last 3 times this Happened and we saw a quick retest on 50 EMA .
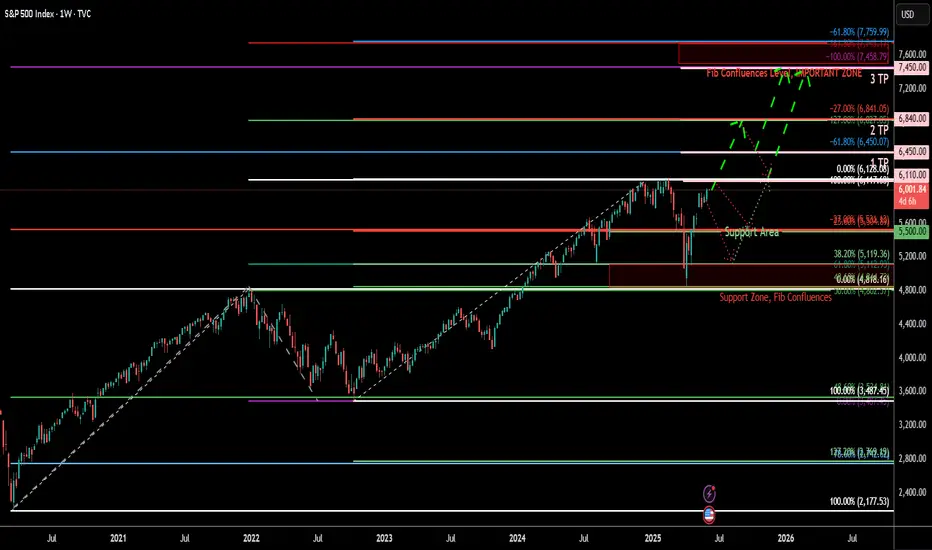
S&P 500 Index (SPX) Weekly TF – 2025
Chart Context:
Tools Used: 3 Fibonacci Tools:
1. One **Fibonacci retracement** (from ATH to bottom)
2. Two **Trend-Based Fibonacci Extensions**
* Key Levels and Zones:
* **Support Zone** (Fib Confluence): \~4,820–5,100
* **Support Area (shallow pullback)**: \~5,500–5,600
* **Resistance & TP Zones:**
* TP1: **6,450** (Fib confluence & -61.8%)
* TP2: **6,840** (-27%)
* TP3: **7,450–7,760** (Major Confluence)
Technical Observations:
* SPX is approaching a **critical resistance** near previous ATH (\~6,128) with projected upward trajectory.
* The **green dashed path** suggests a rally continuation from current \~6,000 levels to TP1 (\~6,450), TP2 (\~6,840), and eventually TP3 (\~7,450–7,760), IF no major macro shock hits.
* The **purple dotted path** suggests a potential retracement first to \~5,600 (shallow correction) or deeper into \~5,120 or even 4,820 zone before continuing the bullish rally.
* The major support zone around **4,820–5,120** includes key Fib retracement levels (38.2% and 61.8%) from both extensions and historical breakout levels.
Fundamental Context:
* US economy shows **resilience** amid soft-landing narrative, though inflation remains sticky.
* The **Federal Reserve** is expected to cut rates in **Q3–Q4 2025**, boosting equity valuations.
* Liquidity expansion and dovish outlook support risk assets, including **equities and crypto**.
* However, **AI-driven tech rally** may be overstretched; a correction could follow earnings disappointments or macro surprises (e.g., jobs or CPI shocks).
Narrative Bias & Scenarios:
**Scenario 1 – Correction Before Rally (Purple Path)**
* If SPX faces macro pushback (e.g., high CPI, hawkish Fed), expect retracement to:
* 5,600 = Fib -23.6% zone
* 5,120–4,820 = Major Fib Confluence Zone
* These would act as **accumulation zones**, setting up next leg up toward TP1 and beyond.
* **Effect on Gold**: May rise temporarily due to risk-off move.
* **Effect on Crypto**: Could stall or correct, especially altcoins.
**Scenario 2 – Straight Rally (Green Path)**
* If Fed confirms cuts and macro remains soft:
* SPX breaks ATH (\~6,128)
* Hits TP1 (\~6,450), TP2 (\~6,840)
* Eventually reaches confluence at **TP3 (7,450–7,760)**
* **Effect on Gold**: May struggle; investor preference for equities.
* **Effect on Crypto**: Strong risk-on appetite, altseason continuation.
Indicators Used:
* 3 Fibonacci levels (retracement + 2 extensions)
* Trendlines (macro and local)
* Confluence mapping
Philosophical/Narrative Layer:
This phase of the market resembles a test of collective confidence. Equity markets nearing ATHs while monetary easing begins reflect a fragile optimism. The Fibonacci levels act as narrative checkpoints — psychological as much as mathematical. Will we rally on faith or fall for rebalancing?
Bias & Strategy Implication:
Bias: Bullish with caution
* Strategy:
* Await **confirmation breakout >6,128** for fresh long entries
* Accumulate on dips in the **5,100–5,500** zone if correction unfolds
* Use **TP1, TP2, TP3** as staged exits
Related Reference Charts:
* BTC.D Analysis – Bearish Bias:
* TOTAL:Bullish Bias
*TOTAL3 – Bullish Bias:
* US10Y Yield – Falling Bias Impact:https://tradingview.sweetlogin.com/chart/US10Y/45w6qkWl-US10Y-10-Year-Treasury-Yield-Weekly-TF-2025/