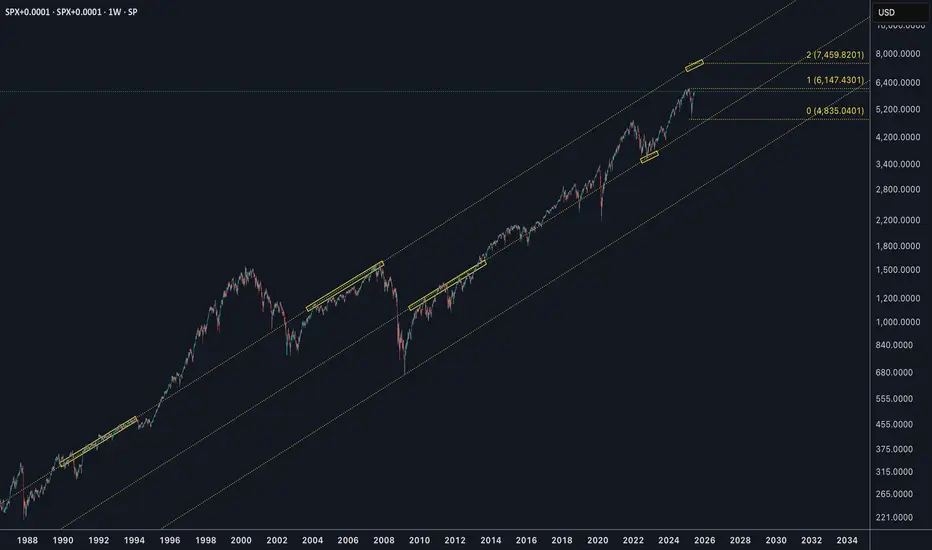
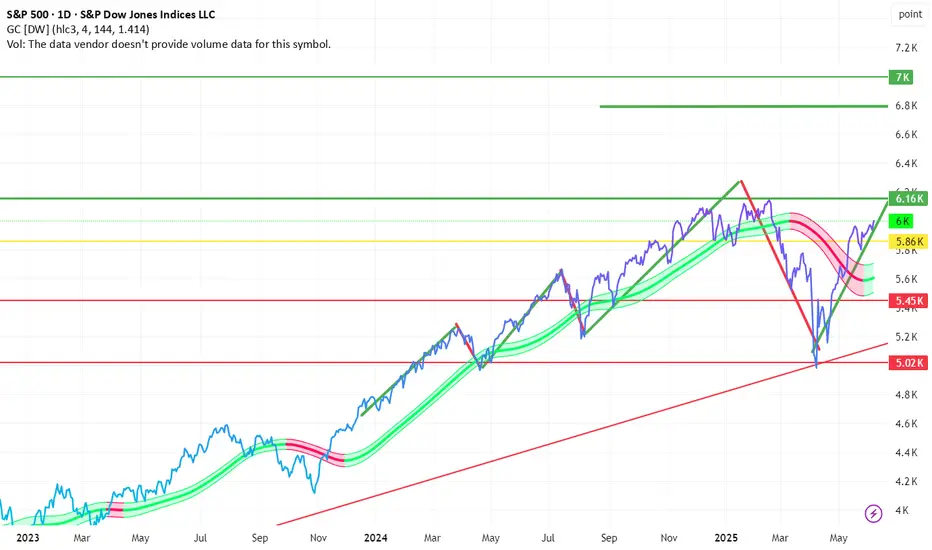
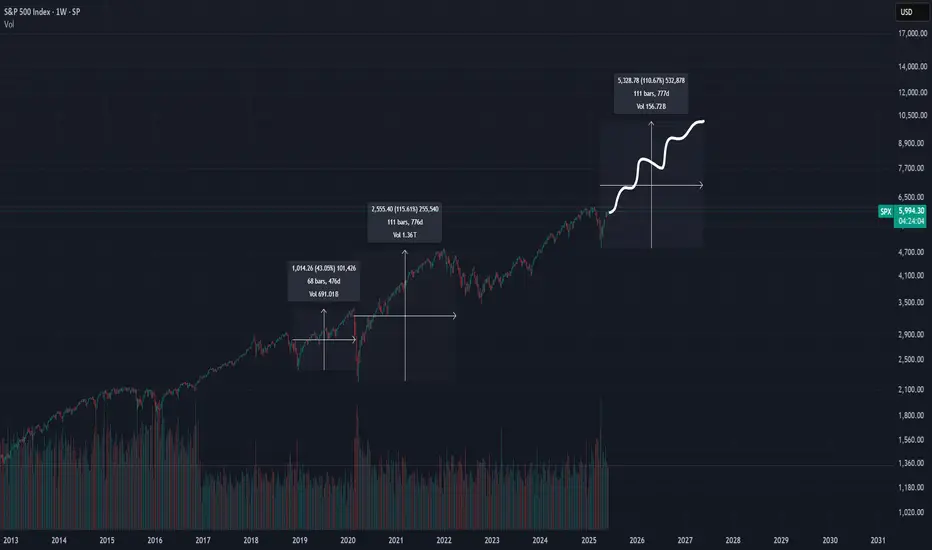
SPX 500 to 17,000 in 7 years.This chart represents the S&P 500, showcasing its performance over time, including quarterly data.
It captures everything.
Every recession.
Every war.
Every president.
Every variation of the monetary base as superpowers rise and fall.
Whenever I hear a bear in the stock market declare that THE TOP has been reached, and we are about to CRASH -50% to -90%
I find myself drawn to these comprehensive long term charts.
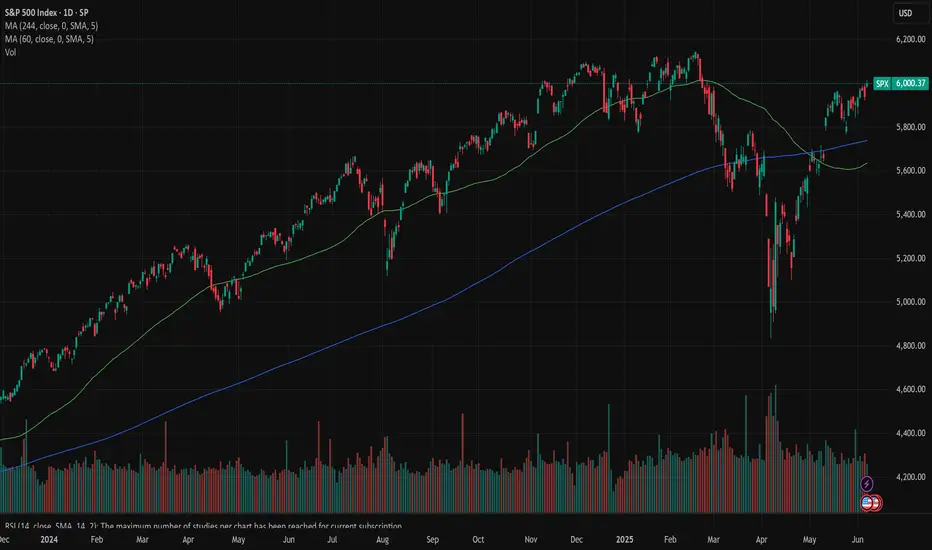
If the bulls are genuinely in control and we have merely undergone an intermediate-term correction, then the long-term bull market that commenced at the 2009 low remains robust, with many more years ahead.
The chart also illustrates that the three significant bull market phases typically last around 18-20 years following a major breakout.
And they yield a comparable number of X's.
It's all quite fascinating, if you ask me.
See you in the future!
US500.F trade ideas

SPX500 – Volatile Week Ahead as Trade Talks and CPI LoomSPX500 | Overview
Fundamental Insight:
S&P 500 futures edged lower early Monday as traders brace for a high-impact week.
Key events include:
- US-China trade talks in London (Monday)
- U.S. inflation data (CPI) expected midweek (Wednesday)
Markets are cautious, awaiting clarity from both geopolitical developments and macroeconomic indicators, which could trigger strong directional moves.
Technical Outlook:
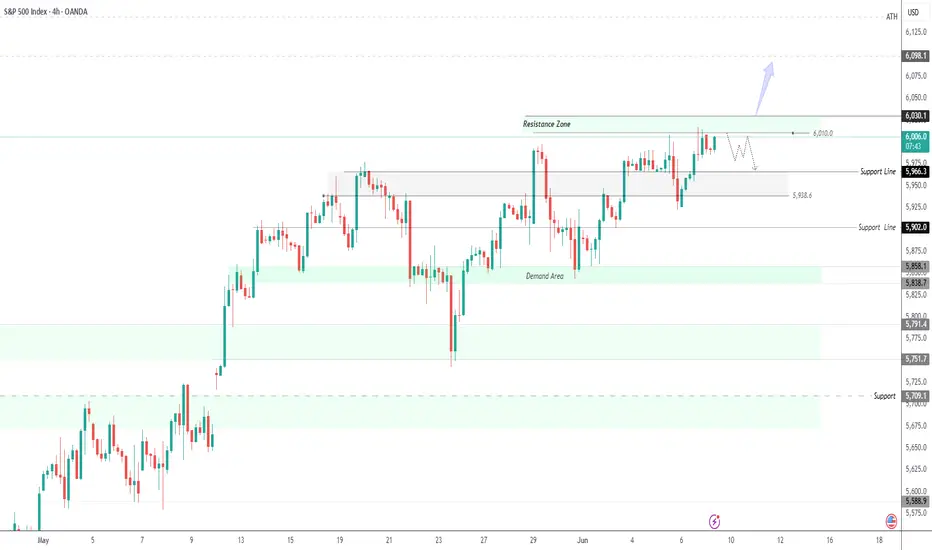
The price appears to be entering a correction phase, with the potential to drop toward 5966.
A confirmed break below 5966 may extend the bearish trend toward 5938 and 5902.
However, a break above 6030 would invalidate the bearish scenario and could trigger a bullish continuation toward 6098 and potentially a new all-time high (ATH).
Pivot Line: 6010
Support Levels: 5966, 5938, 5902
Resistance Levels: 6030, 6098
Premarket update - SPX USOIL GOLD NAT GAS BTCSPX sold off more overnight, but nothing dramatic yet. I do believe we will have a negative day today. Gold looks good for more upside and possibly to all time highs eventually. NAT GAS looks like a short and so does OIL. BTC probably a bit lower to 105k.

SPX - way to ATH in June SPX with a gap just below last season, having all its SMAs aligned and head funds heavily short, I am sure we are on our way to new ATHs. A little shake out to find support on sma50 could be expected, but for now the strategy would be BTD! - no financial advice.
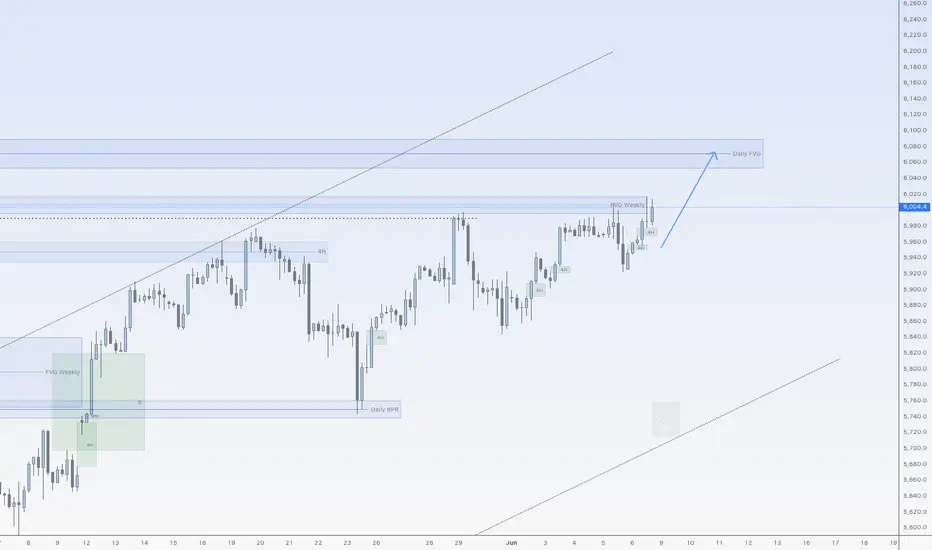
A little more upside for SPX500USDHi traders,
And again my previous outlook of SPX500USD played out as I've said. After a small correction we saw the continuation of the upmove to the Daily FVG.
Next week we could see price come into the Daily FVG and reject from there for a correction down.
Let's see what the market does and react.
Trade idea: Wait for a small correction down on a lower timeframe to trade short term longs into the Daily FVG.
If you want to learn more about trading FVG's & liquidity sweeps with Wave analysis, then please make sure to follow me.
This shared post is only my point of view on what could be the next move in this pair based on my technical analysis.
Don't be emotional, just trade your plan!
Eduwave
**** Market Trading Strategy Idea SP500 ***Key Chart & Economic Insights:
- Current Market Position
- The S&P 500 is around $6000, showing positive momentum (+1.03%).
- Upward trend visible, indicating strong buying interest.
- Economic tailwinds support continued growth.
- Projected Price Movements
- 6800 USD: Key resistance level where selling pressure could emerge.
- Market pullback: A correction after 6800 may create a buyback opportunity.
- Recovery phase: Expected rebound toward 7000-7500 USD, another selling position.
- Economic Context: U.S. Manufacturing Boom & GDP Growth
- The United States is ramping up domestic production, boosting industrial output and reshoring manufacturing.
- This shift is fueling GDP growth, strengthening economic fundamentals and potentially sustaining bullish market momentum.
- Strong consumer spending & investment could drive stocks higher, aligning with the planned trade strategy.
Risk Management & Optimization:
- Entry & Exit Precision: Define stop-loss and take-profit levels.
- Momentum Confirmation: Ensure price action validates expected moves.
- Economic Indicators: Watch manufacturing & GDP data for trend validation.
If you want to refine this analysis or explore other scenarios, I'm here to dive deeper into key points! 🚀 Subscribe! TSXGanG
I hold a CCVM and MNC (Certificate of Competence to become a securities broker anywhere in Canada) and have been working as a trader for five years.
It’s a pleasure for me to help people optimize their trading strategies and make informed financial market decisions.
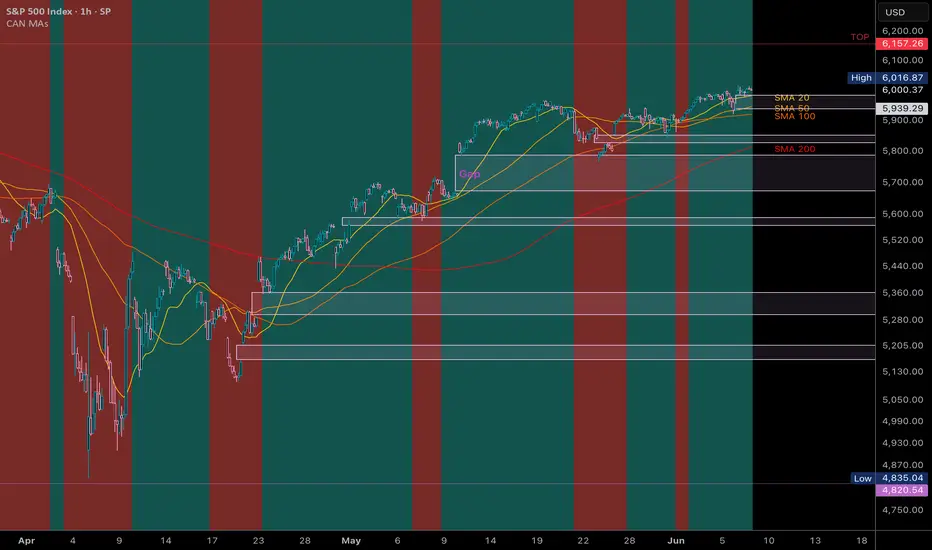
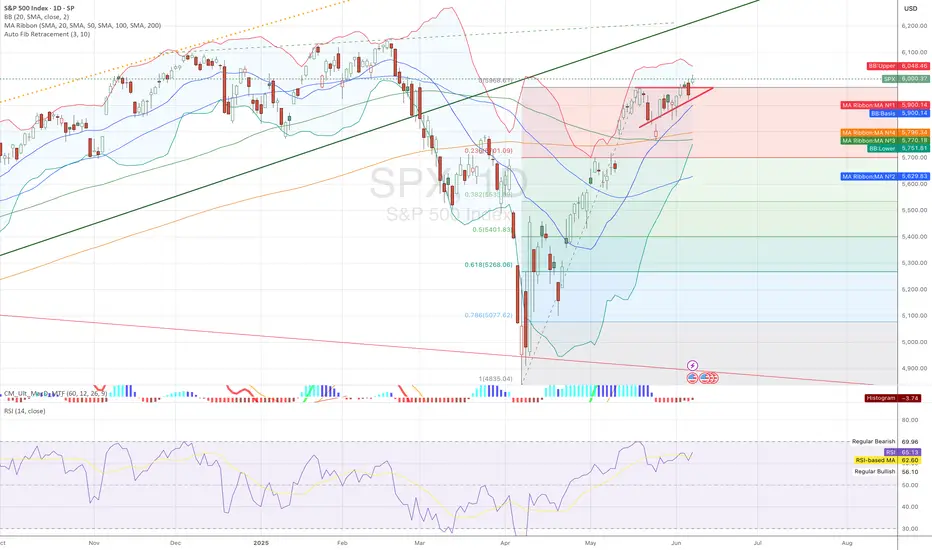
Remaining bullish on SPX and how I think through my chartsVideo Recap: The Zoomed Out View
Weekly moving averages are reordering and turning up
The weekly chart shows that the 10EMA and 20EMA have now crossed the 50SMA and are turning up. That reordering adds strength to the broader trend. This past week, the index reclaimed 6,000, which is a key psychological level. And we also saw price bounce off the uptrend line drawn from the April low, showing buyers are still defending key areas of support.
Daily pullback found support
The daily chart gave us a pullback the Friday before last, but it held right at a confluence of support (the 20EMA and 200SMA), along with a horizontal level drawn from the weekly timeframe.
Digestion periods can shake you out if you’re too zoomed in
The last few weeks have been a reminder that chop can test your patience and your plan. We didn’t break trend, we just pulled back to support. But if you’re too zoomed in, it can feel like everything is shifting. That’s when stops get hit early, trades get closed prematurely, and new positions get put on for the wrong reasons. In reality, this was just a normal digestion after a strong move. And when in doubt, zooming out brings the clarity back.
Trendlines and levels are guides, not absolutes
There were a few moments in my chart review this week where I caught myself trying to make lines matter more than they do. But these tools (trendlines, moving averages, support and resistance) only matter in the context of what price is doing around them. Structure tells the real story. One line getting hit or crossed doesn’t mean the whole thesis breaks down. What matters is whether buyers step in, whether trend resumes, and whether your trade idea still fits your system.
So what now? Here’s what I’ll be watching this week:
We’re holding above all major MAs.
If we push through the February all-time high, that can shift sentiment, especially for retail traders who may see that as a signal that “we’re in the clear.”
If we stall below the ATH, that wouldn’t be a problem by itself, but I’d watch how price behaves...ie are we pulling back constructively or losing key levels?
I’m not leaning bearish and won't be unless we start closing below 5,800 (200SMA) and definitely if we can't hold the rising 50SMA. (My second scenario after my bullish one is sideways, so bearish for me is out for now.)
When the market starts moving, the best thing you can do is trust your prep, lean into your plan, and zoom out when things get noisy. The bigger picture hasn’t changed.

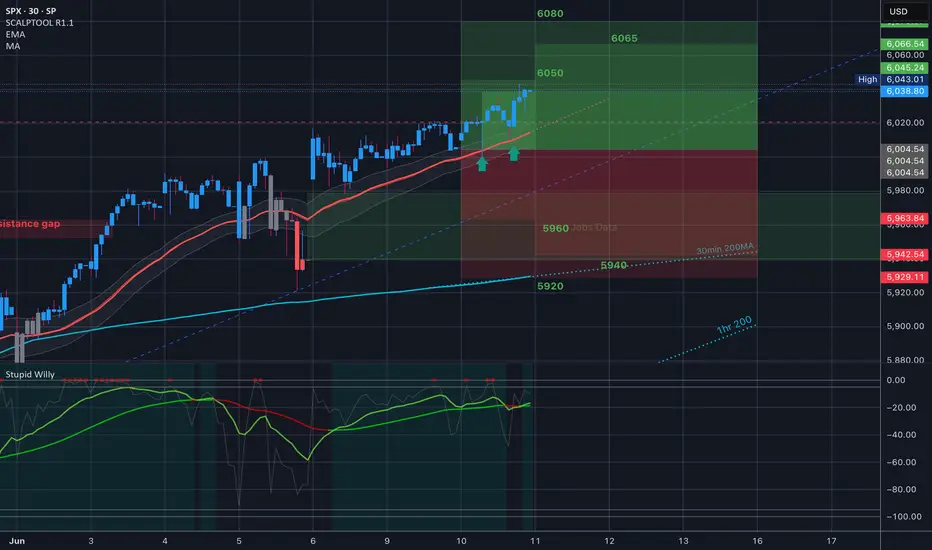
$SPX // June 10 2025 // Analysis & Targets for Day TradersWow!!! What a day!! This is the chart from premarket, and you can see that 35EMA catching us all day. The setup was there. Good Game!!
My 6050/6065 bear call spreads paid today!!
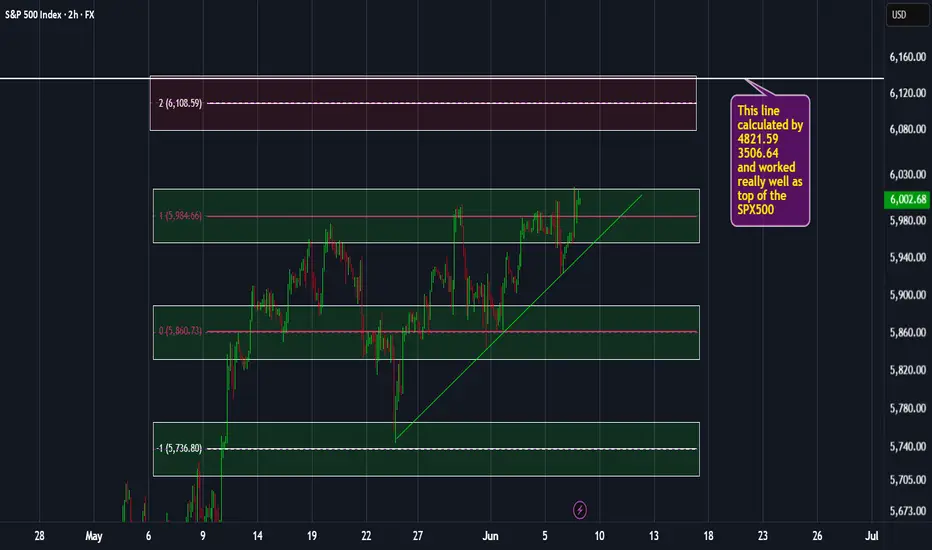
SPX500 weekly overviewThis 6,136.54 calculated by 4821.59 and 3506.64 and worked really well as top of the SPX500!
Expect the zone around that line! All zones could be chosen to long the instrument.
4821.59 * 2 - 3506.64 = 6,136.54
The indicated levels are determined based on the most reaction points and the assumption of approximately equal distance between the zones.
Some of these points can also be confirmed by the mathematical intervals of Murray.
You can enter with/without confirmation. IF you want to take confirmation you can use LTF analysis, Spike move confirmation, Trend Strength confirmation and ETC.
SL could be placed below the zone or regarding the LTF swings.
TP is the next zone or the nearest moving S&R, which are median and borders of the drawn channels.
*******************************************************************
Role of different zones:
GREEN: Just long trades allowed on them.
RED: Just Short trades allowed on them.
BLUE: both long and short trades allowed on them.
WHITE: No trades allowed on them! just use them as TP points
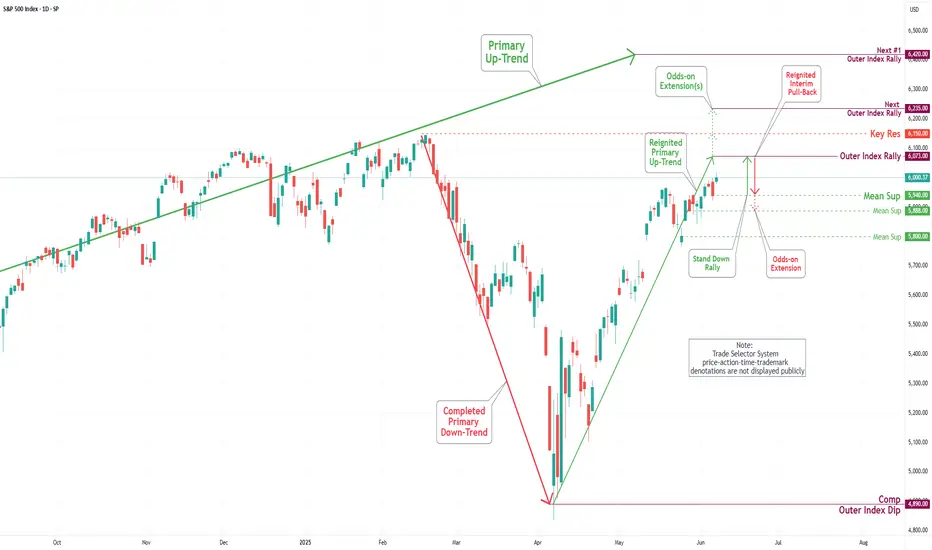
S&P 500 Daily Chart Analysis For Week of June 6, 2025Technical Analysis and Outlook:
The S&P 500 Index has demonstrated an upward trajectory during this week's trading session, surpassing the established Outer Index Rally level of 5955 and the Key Resistance level of 5965. Currently, the index is exhibiting a bullish trend, with a focus on the Outer Index Dip target, set at 6073. Furthermore, additional critical levels have been identified, including Key Resistance at 6150 and the Next Outer Index Rally at 6235. Conversely, there is a potential decline in index prices from the current level or upon completion of the Outer Index Dip 6073, which may lead to a retest of the Mean Support at 5940, with the possibility of extending the pullback to the Mean Support at 5888.
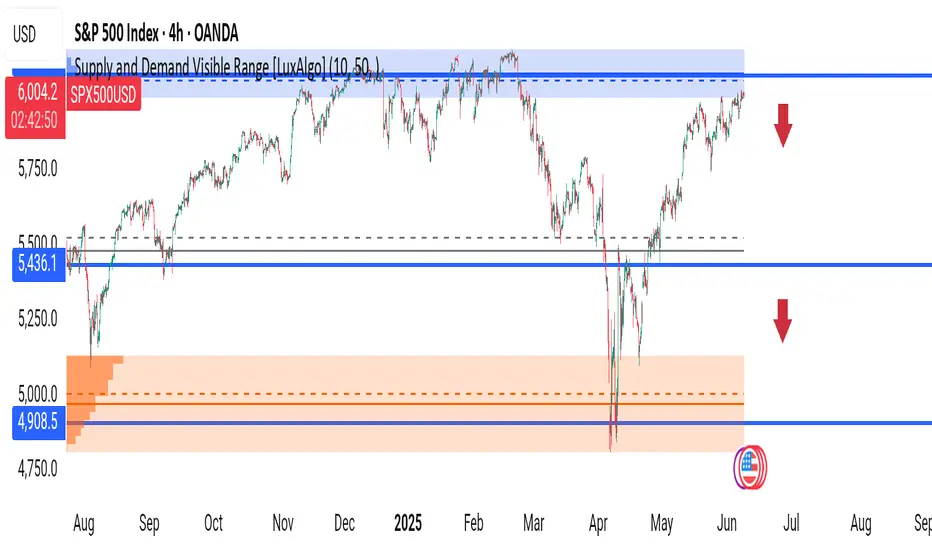
Smart Money Levels Spotted on SPX500USD – Massive Sell Zone Major Supply Zone (Resistance): 🔵 6,000 – 6,050
Price is currently sitting right inside a well-defined supply zone, where smart money previously sold off heavily back in December.
Intermediate Support: 🔵 5,436
A clear structural level where price previously broke down from and retested in April.
Major Demand Zone (Support): 🟠 4,900 – 5,000
Price reacted aggressively from this zone during the massive April sell-off, suggesting strong institutional interest.
---
🧭 Current Price Action:
SPX500USD is currently trading at 6,004, right at the supply zone marked by the blue shaded area. Price has aggressively rallied from the 4,900 demand zone in April and is now testing this critical resistance level for the first time since the major drop.
📌 Notice the tight consolidation and rejection wicks from this area in the past. This could signal a potential reversal or a breakout trap!
---
⚠️ Bearish Signals to Consider:
🔻 Risk of Rejection: With price inside a supply zone and momentum slowing, there’s a high probability of a rejection.
🔻 Double Top Structure: Previous highs around 6,050 could form a double top, making this a textbook reversal opportunity.
🔻 Downside Targets:
📍 First target: 5,436 (previous support & breakout level)
📍 Second target: 4,900–4,950 (major demand zone & value area)
---
🧠 Smart Money Perspective:
This setup aligns perfectly with institutional trading logic:
Sell high in supply zones
Buy low in demand zones
Volume Profile and LuxAlgo’s visible range confirm these key levels where institutions are most likely to act.
---
🧨 Trading Plan:
🚫 No buying in the supply zone
📉 Short entries if rejection confirms (look for bearish engulfing / lower high on lower timeframes)
🎯 Target 1: 5,436
🎯 Target 2: 4,900–4,950
🛡️ Stop Loss: Above 6,050 (fake breakout zone)
---
📊 Bonus Tip:
Watch how price behaves around FOMC and CPI news – liquidity grabs often happen right before key macro data, especially near supply zones. Be patient!
---
💬 Let’s Discuss:
Do you see a breakout or a rejection from here?
Comment below if you're bullish or bearish on SPX500USD! 👇
Don't forget to like & follow if you find this breakdown helpful 💡
#SP500 #SPX500USD #SmartMoney #SupplyAndDemand #TechnicalAnalysis #PriceAction #LuxAlgo #TradingSetup #SwingTrade #BearishReversal
The Second Blow-Offanyone casually looking at long-term charts can see in recent history on the monthly scale one of the most violent blow-off tops started In 1995-2000, running those 5 years up 240%. interestingly, my target and the number of years it takes to reach since the post-covid lows is almost the same

S&P500 Short: Ending DiagonalHi all, over here, I presented a cleaned-up chart of the EW counts for S&P500 and gave 2 entry points for shorting. The most important points are here:
1. 5th wave completion (or completing)
2. Ending Diagonal: will follow a sharp move down.
Alternatively, you can wait for a breakdown of the lower trendline to short.
Good luck!

Another leg of bull market comingBeing bearish in the stock market—especially after such a big correction and a V-shaped recovery—is definitely not a good idea. Probability and past history are against you. If Trump succeeds in bringing more jobs by tarrifs and reduce government expending as he promises, it could easily keep the uptrend going for the next two years and push past the 10,000 level, just like 2018 and 2020
SPX showing break from ascending triangleSPX500 futures daily chart showing break from ascending triangle. Expecting upside move towards 6100 in coming days
SPX: chasing the 6KThe jobs data were in the spotlight of markets during the previous week. The Non-farm payrolls in May with 139K new jobs came as better than market anticipated, which supported the optimistic mood of investors. The S&P 500 managed to return to the levels modestly above the 6K level. Tech companies were again in the spotlight of investors. In this sense, the magnificent 7 drove the market to the higher grounds. In the Friday trading session, NVDA gained 1,2%, AMZN was up by 2,7%, while Tesla gained 3,7%. It should be noted that Tesla had quite a turbulent week. Its shares first dropped by 14% at the beginning of the week, after its CEO commented negatively on a current policy of the US President Trump. Certainly, this came as a surprise for markets, considering Musk's strong support for President Trump, both during the electoral campaign and his presidency.
Current optimism might be slowed down with forthcoming inflation data. Namely, a large number of economists are pointing to potential for the economic slowdown and higher inflation induced by implemented trade tariffs by the US Administration. In this sense, there is a probability that higher volatility of the index might continue in the coming period, as markets will try to understand what impact future growth and earnings will have on any new news on trade tariffs. It has been announced that further talks between China and US officials on trade tariffs will be held next week in London. This event will be closely monitored by investors.
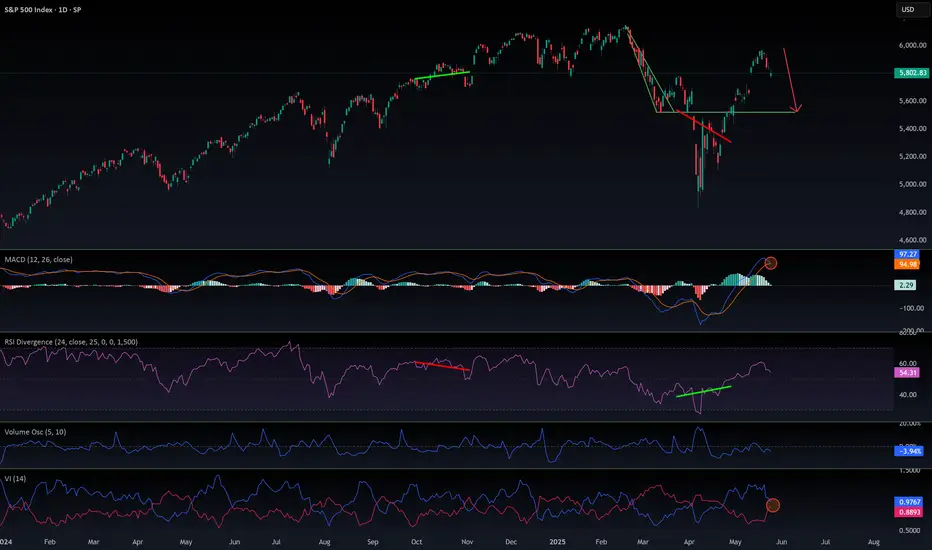
SPX is overheated, a correction is necessary📉 Market Update: No, It Has Nothing to Do with Trump
This move has nothing to do with Trump’s dramatic announcements. The reality is simple: the MACD on the daily chart is overheated, and a healthy correction is needed — likely down to the 5,520 level — before resuming the uptrend.
Now, does it surprise anyone that Trump acts like a PR agent for his investors? He always seems to drop “bad news” at the exact moment the charts call for a pullback. My guess? They're shorting right now.
🪙 Bitcoin Stalling
CRYPTOCAP:BTC is also losing momentum, and looks like it’s in need of a short-term correction as well. This suggests a week of consolidation ahead for the whole crypto market.
But let’s be clear:
🚀 The Bull Market Is Not Over
The weekly charts remain very bullish, and this trend could last another 4–6 months. The macro bullish structure for crypto remains intact.
However, in TradFi, there are cracks:
🔻 20-year bonds sold at 5.1% — a major recession red flag
💸 Tariffs are putting pressure on global trade
📉 The entire traditional market is starting to de-risk
🔮 What to Expect
Short-term correction to ~5,518 (first bottom target)
A possible rebound after healthy consolidation
A continued uptrend in crypto unless key support breaks
I’ll publish a new update when conditions change.
📌 Follow me to stay ahead of the market. And as always: DYOR.
#CryptoMarket #Bitcoin #MACD #TechnicalAnalysis #CryptoCorrection #BullishTrend #RecessionWarning #TradFi #Altcoins #BTC #MarketUpdate #TrumpEffect #DYOR
Possible bearish outlook After algorithm took out the previous liquidities, I would be expecting a downward move to see price taking out the bullish liquidity below, into the bullish gap, possibly filling it up

US & Global Market Breakdown | Profits, Losses & Bearish TradesIn this video, I break down the current state of the US and global economy, and why I believe we’re heading into a bearish phase.
📉 Fundamentals:
I cover the key macroeconomic factors influencing the markets — including Trump’s proposed new tariffs, slowing GDP growth, and ongoing supply chain constraints. These all point toward increasing pressure on the global economy.
📊 Technical Analysis:
I go over the major indexes and highlight their recent behavior. We’ve seen reactions from resistance levels, contraction patterns forming, and a significant volume dry-up — followed by today’s spike in volume, which occurred right at resistance. These are potential signs that the market may be shifting toward a bearish trend.
That said, we could still just be witnessing a deeper pullback within a longer-term uptrend. Markets are unpredictable, and no one knows for sure — which is why it’s important to always do your due diligence.
💰 I also review the profits and losses I’ve taken on recent bullish trades, and why I’ve now positioned myself in select short opportunities based on what I’m seeing.
If I’m sharing this, it’s because I’m personally investing my capital based on my conviction — so always use your own judgment and risk management when making decisions.
If you found value in the breakdown, leave a like, comment, and subscribe for more timely updates.

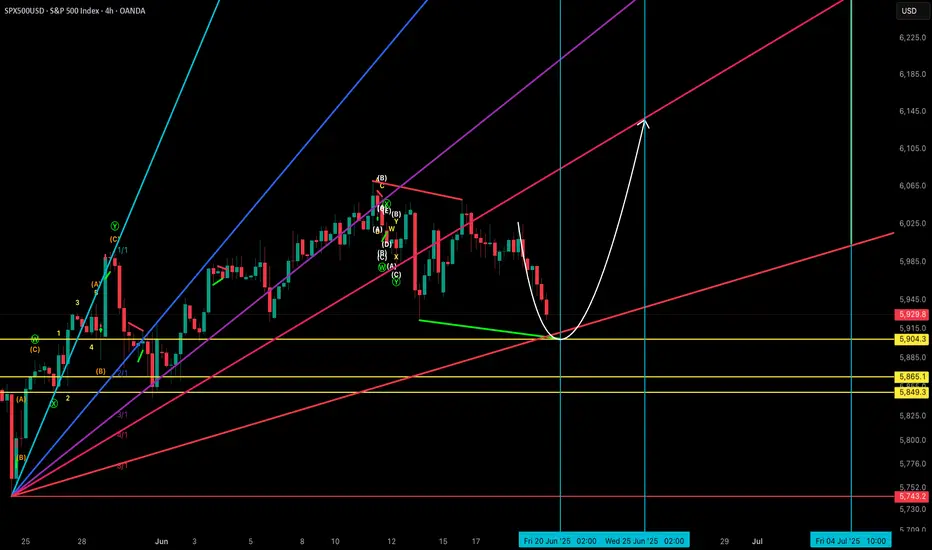
SPX500 Market Outlook!We remain bullish on the SPX500.
🔍 Short-Term Expectation:
A potential bottom could form around 2 AM London time on the 4H chart.
📉 Key Support Levels:
• 5904.3
• 5865.1
• 5849.3
📅 Top Projection Dates:
• 25th June
• 4th July
Stay sharp. Structure still favours the bulls. 🐂📊
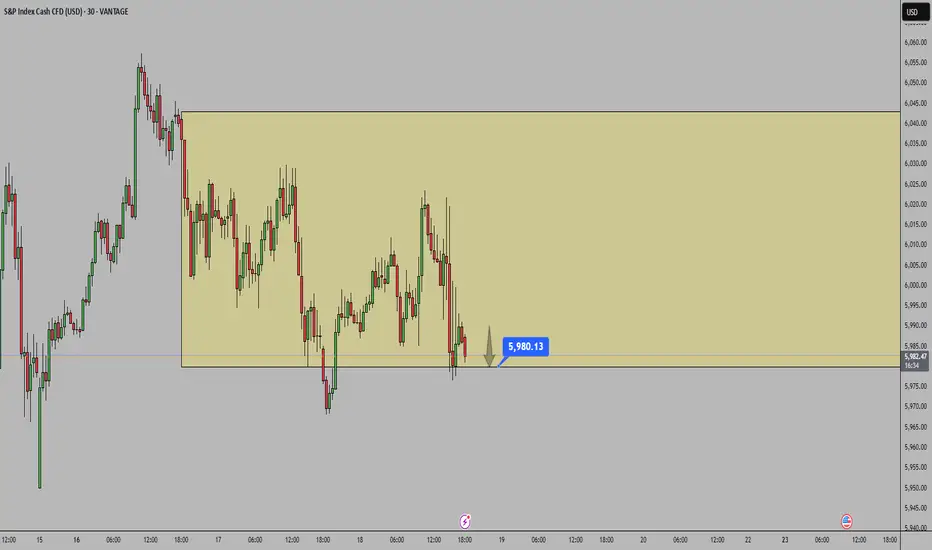
SPX: Elliott Wave indicating corrective phase nearly doneMy Elliott Wave count suggests the S&P 500 ( SP:SPX ) is nearing the completion of its current corrective phase. Price action has been consolidating around the 5980 area, last closing at 5980 on Wednesday.
From an Elliott Wave perspective, this setup implies an uptrend continuation is likely coming in the upcoming days.
Key levels I'm watching:
Immediate Support: 5840-5900 zone. A hold here would confirm strength.
Stronger Support: 5767-5840. A break below this would challenge the immediate bullish count.
Resistance: 6000 (psychological) and the all-time high of 6147.43. A clear break above these levels will validate the next impulse wave.
Volume and market breadth will be crucial confirmations. Let's see how the market reacts!
What are your thoughts on the current SPX wave count? Share below!
Disclaimer: This content is for informational and educational purposes only, and should not be considered financial advice. Trading involves substantial risk and may result in the loss of your capital. Always conduct your own thorough research and consult with a qualified financial professional before making any investment decisions.

S&P500Net shorts increased by 58,668 contracts, which is a massive bearish shift from institutions and hedge funds.
This signals that large speculators are aggressively betting against the S&P 500.
It’s one of the largest bearish positions in recent months — often tied to expectations of a market pullback, economic concern, or interest rate risk.
Bearish bias intensifies — short positions rising fast.