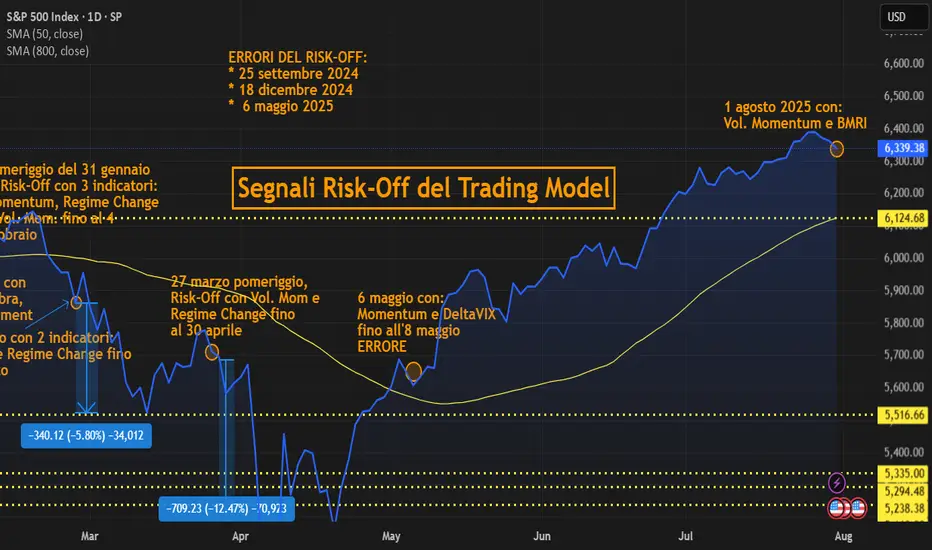
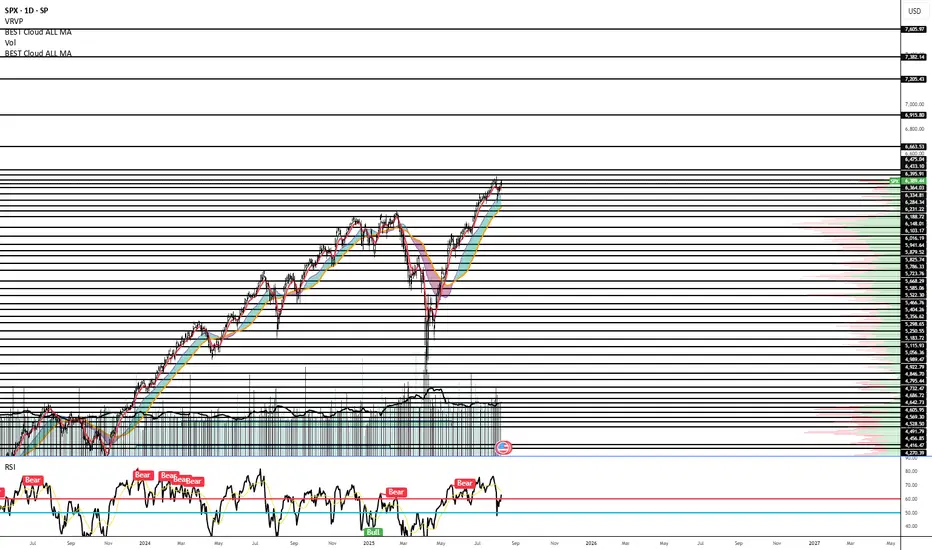
Risk-Off SignalsRisk-Off: 1 August with 2 indicators:
Voil. Momentum and Bear Market Risk Indicators (BMRI)
US500 trade ideas
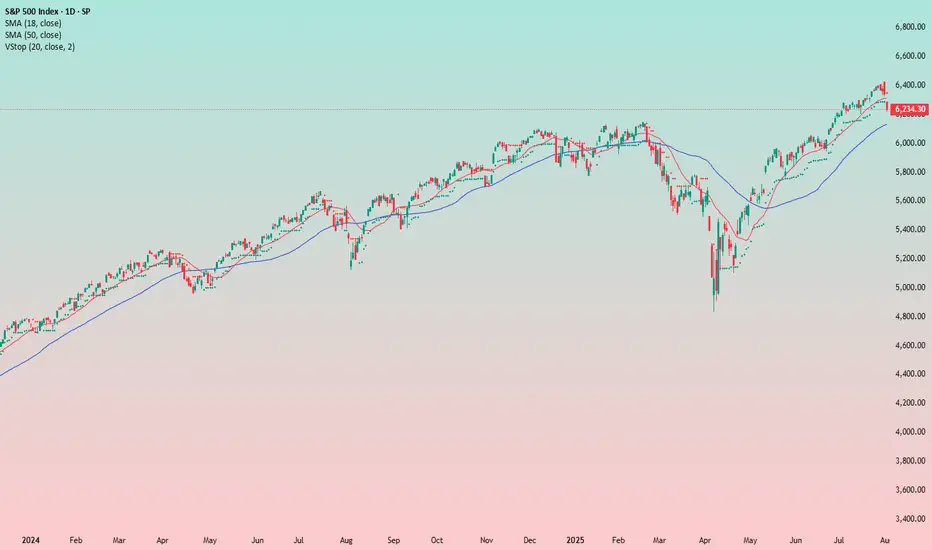
Is This the Start of a Market Drop?So, is the drop beginning? It kind of looks that way, but there’s still no solid setup for entering a short position — and there hasn’t been so far.
The trend is still upward for now, and this current pullback might just be temporary.
What I like about the short idea is that August is traditionally a weak month for stocks .
Could this be the start of a big correction on the market? Yes, it’s possible.
It’s just a pity there’s no clean setup for a short. I’d like to enter, but I’d prefer to see a bit more confirmation on the chart itself.
In general, trading the index off of chart setups isn’t easy — perfect entries are rare. That’s exactly the case now. I’m watching and wondering how and when to catch the downside. Maybe I’ll end up sitting through the entire drop without a position :)
Overall, I’m in favor of the short — but for now, I just don’t see a clear entry point.
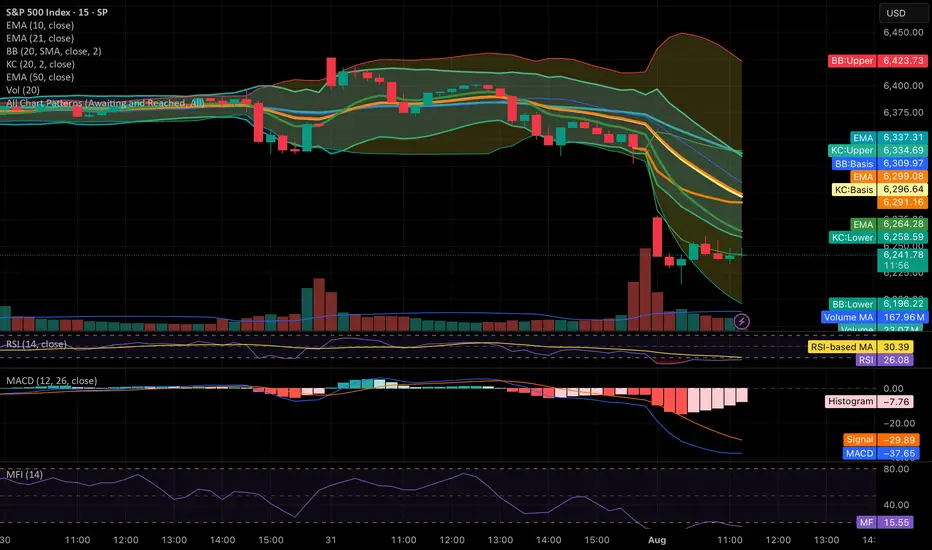
Price breakout below Keltner bandThe price has shown a breakout after the squeeze below the keltner band and may signal a more bullish trend.
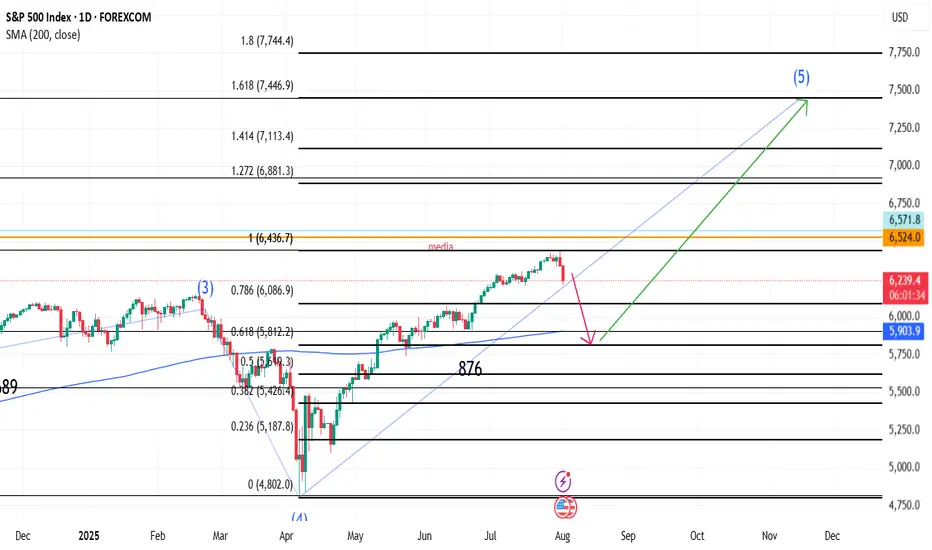
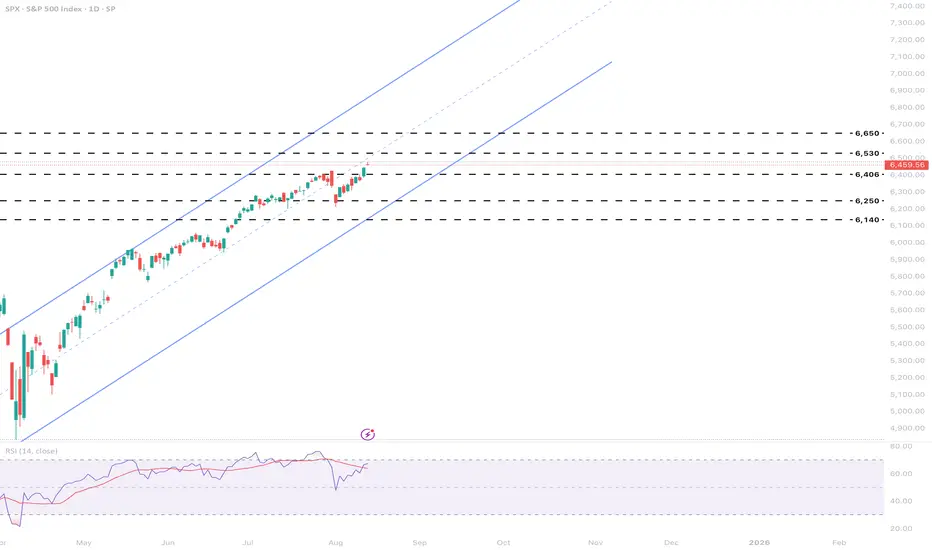
SPX correction to 5800 then 7445In my view current correction could stop in 5800 area where bullish trend could resume to target 7445 area in November
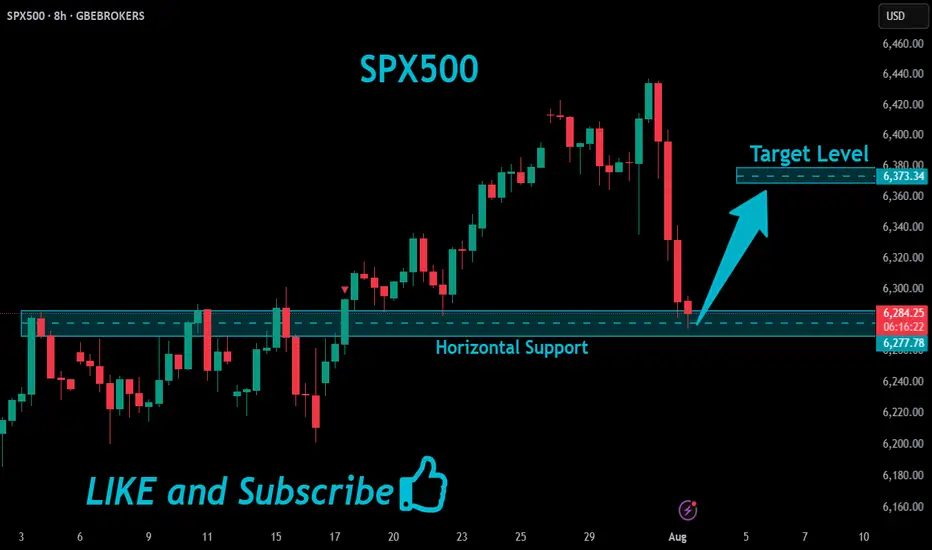
SPX500 Will Go UP!
HI,Traders !
#SPX500 made a retest
Of the horizontal support
Level of 6277.78 and we
Are already seeing a
Bullish rebound so we are
Locally bullish biased and
We will be expecting a
Further bullish move up !
Comment and subscribe to help us grow !
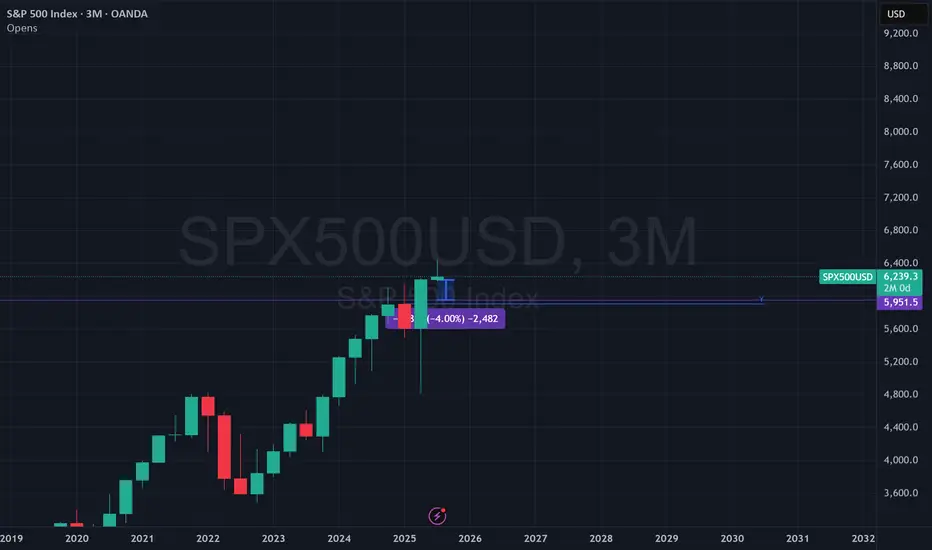
Bearish Engulfing on Risk. Average quarterly downside since 2023 open is 4.07%. Is a retest of near the yearly open on order over the month of August? Markets are no longer pricing in a Fed rate cut in September. Will that be the near term bearish fuel?
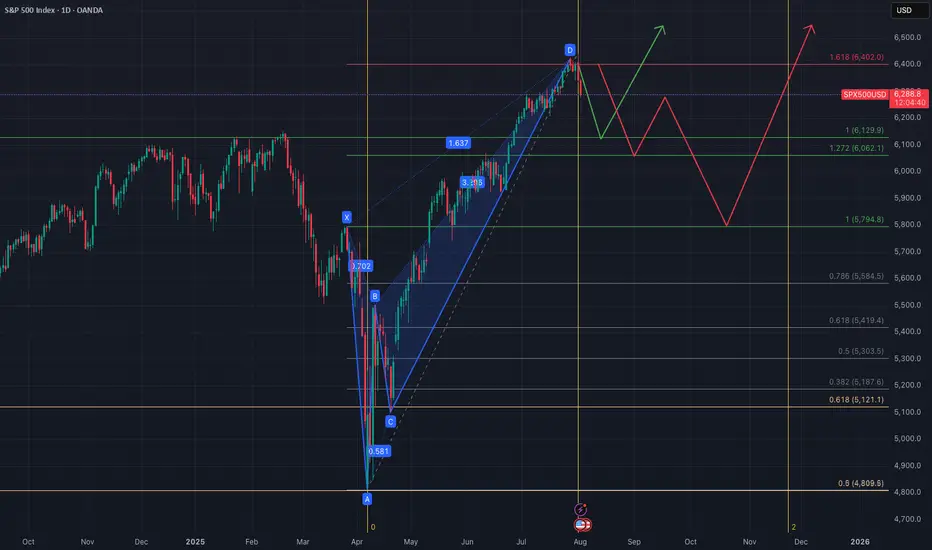
SPX500 - Bearish Crab Pattern- Price completed a perfect Crab Pattern, yet we all got to August 1st (second) liberation day
- If bad mood continues, we can expect a correction:
A. (positive) down to 6150-6000
B. (negative) down to 5800
Just my humble opinion
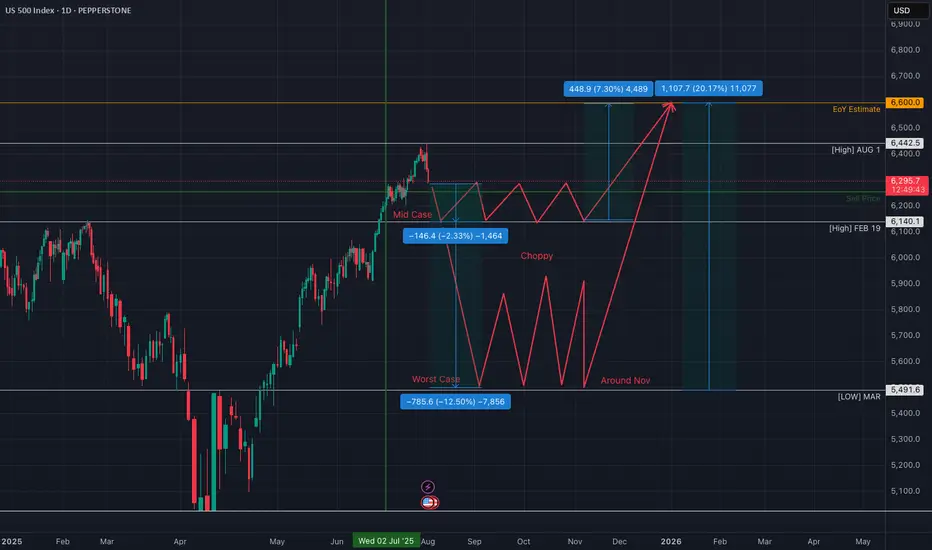
S&P500 for the rest of 2026I am not a professional and this is based on nothing more than blind speculation and feelings.
Probably wrong
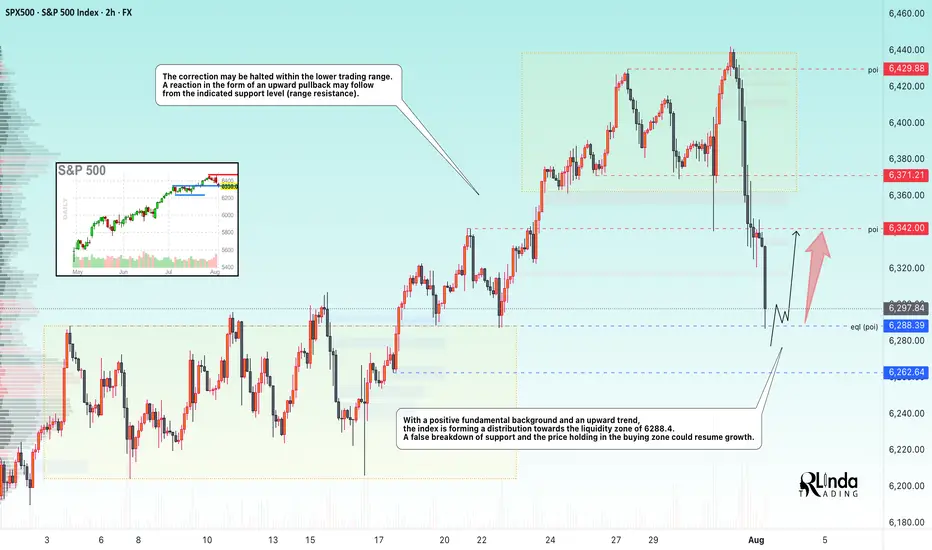
SP500 → Countertrend correction before growthFX:SPX500 is correcting against an upward trend. In the second half of the week, the market received fairly positive fundamentals during the reporting period.
S&P 500 futures found support after strong reports from Meta and Microsoft, which exceeded earnings expectations and forecasts thanks to AI. The rise in futures supported demand for the “Magnificent Seven” despite Powell's hawkish comments. The focus is on Apple and Amazon reports in the evening, which could strengthen the tech rally. On Friday, we are seeing a countertrend correction in which the market is testing the 6288 zone of interest.
Support levels: 6288.4, 6262.6
Resistance levels: 6342, 6371
Most likely, the market will form a false breakout of support during the correction. If the bulls keep the index above the key level, we can expect continued growth in the short and medium term.
Best regards, R. Linda!
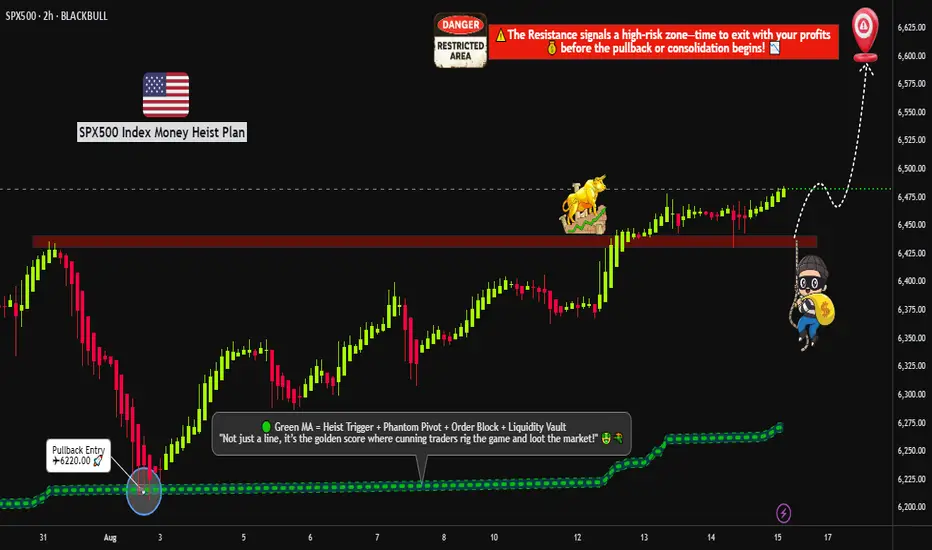
"US500 BREAKOUT – TIME TO LOAD LIMIT ORDERS FOR THE PUMP?"🔥🦹♂️ "SPX500 BANK HEIST – LAYERED BULL RAID IN PROGRESS!" 💰📈
(Thief Trader’s Multi-Limit Order Bullish Ambush – No Weak Hands Allowed)
📍 ASSET: US500 / SPX500 (S&P 500 INDEX)
🎯 HEIST PLAN: BULLISH BREAKOUT
💣 ENTRY: ANY PRICE LEVEL (Thieves use Layered Limit Orders – adapt like a pro!)
🔫 SAMPLE LAYERS: (Scale in like a boss!)
BUY LIMIT LAYER 1: 6475.00
BUY LIMIT LAYER 2: 6460.00
BUY LIMIT LAYER 3: 6440.00
(Add more layers if needed – flexibility is key!)
🛑 STOP LOSS: 6400.00 (Thief’s Emergency Exit – adjust based on your risk!)
🎯 TARGET: 6600.00 (First profit zone – trail or take gains!)
🦹♂️ THIEF TRADER’S MASTER PLAN:
"We don’t ask for permission – we take profits."
🔹 ENTRY TACTICS:
Use multiple limit orders (LAYERED STRATEGY) – like planting timed explosives at key levels.
No panic entries – thieves strike with precision, not emotion.
DCA if needed – but keep bullets for the real move.
🔹 STOP LOSS RULES:
6400 = Danger Zone – if price breaks, abort mission & regroup.
SL too tight? You’ll get stopped out by market noise. SL too wide? You’ll bleed. Find balance.
🔹 TAKE PROFIT STRATEGY:
First TP @ 6600 – secure partial profits.
Let runners ride with trailing stop – or full exit if momentum fades.
🚨 THIEF’S GOLDEN RULES:
✅ Only LONG – no revenge shorts, no greed traps.
✅ Trade in SILENCE – avoid high-impact news (CPI, NFP, Fed).
✅ Risk management = Survival – don’t blow your account on one play.
✅ BOOST & SHARE – if this plan helps, spread the word!
📢 FINAL WARNING:
"This is not financial advice – it’s a thief’s blueprint.
Plan your escape before entry. Market heists require discipline."
💬 COMMENT "ROBBING SPX" if you’re in!
🔥 LIKE & BOOST if you ride with the Thief Trader crew!
🦹♂️ THIEF TRADER OUT.
💸 STEAL SMART. GET RICH. REPEAT.
Summer RALLY-2025: What’s Driving #SP500 and #NQ100 Higher?Dear readers, earlier on June 25, 2025, in our article “Unexpected Surges and Drops in the Indices” we noted the U.S. economy’s readiness for bullish sentiment.
On August 12, 2025 #SP500 climbed above 6,400, and #NQ100 hit a new high above 23,800 as U.S. inflation came in softer than expected, prompting the market to believe in an imminent Fed rate cut — money became “cheaper,” making stocks more attractive. Tech giants and all things AI — chips and cloud — are in high demand and lead the gains. Many companies have reported earnings above forecasts, and buybacks are underway, supporting prices. A weaker dollar is also boosting the revenues of multinational corporations. As a result, investors are buying more aggressively, pushing indices to new records.
5 Reasons Why #S&P500 and #NQ100 Could Hold Their Ground Until the End of 2025:
Dovish Fed. Rate cuts → cheaper money → higher valuations.
AI and data center boom. Growing demand for chips, cloud, and software lifts the tech sector.
Profits + buybacks. Companies beat forecasts and repurchase shares → EPS growth and price support.
Low yields and weaker dollar. Stocks look more attractive than bonds; exporters earn more easily.
Domestic investment in the U.S. Localized production and infrastructure fuel demand for tech and industry.
The foundation of #SP500 and #NQ100 growth is profit. The earnings season added confidence: market participants liked the “breadth” of earnings beats and the resilience of margins among major issuers — the third pillar of the current rally. According to FreshForex, soft inflation and expectations of a Fed rate cut create a window of opportunity for long positions in #SP500 and #NQ100.
S&P500 bullish on rate cut betsS&P 500 hits new high on rate cut bets – The index rose +0.32% to another record as markets priced in further Fed easing. Gains were broad-based, with 421 constituents higher, while small-caps outperformed sharply (Russell 2000 +1.98%, best two-day run since April). The Magnificent 7 lagged (-0.31%), easing from Tuesday’s record.
Macro backdrop – Optimism was supported by rate cut expectations despite geopolitical tensions. Trump warned of “very severe consequences” for Russia without a ceasefire, while US Treasury Secretary Bessent urged Europe to toughen energy sanctions.
Risk appetite – Bitcoin hit a fresh record above $124,500, underscoring investor appetite for risk assets.
Takeaway for traders – Breadth-driven rally suggests underlying market strength beyond mega-caps, with small-cap momentum potentially spilling over into the broader index.
Key Support and Resistance Levels
Resistance Level 1: 6520
Resistance Level 2: 6580
Resistance Level 3: 6637
Support Level 1: 6400
Support Level 2: 6372
Support Level 3: 6340
This communication is for informational purposes only and should not be viewed as any form of recommendation as to a particular course of action or as investment advice. It is not intended as an offer or solicitation for the purchase or sale of any financial instrument or as an official confirmation of any transaction. Opinions, estimates and assumptions expressed herein are made as of the date of this communication and are subject to change without notice. This communication has been prepared based upon information, including market prices, data and other information, believed to be reliable; however, Trade Nation does not warrant its completeness or accuracy. All market prices and market data contained in or attached to this communication are indicative and subject to change without notice.
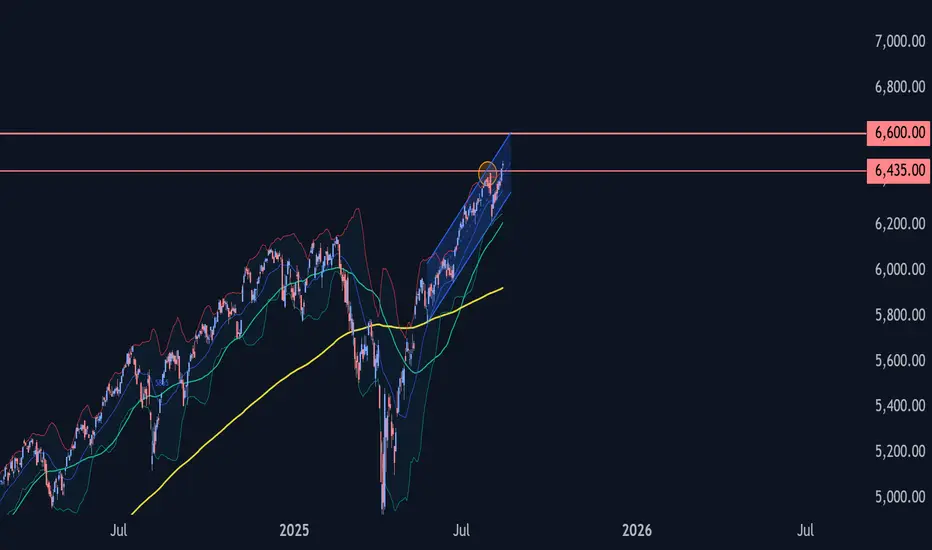
S&P 500 Wave Analysis – 13 August 2025
- S&P 500 broke key resistance level 6435.00
- Likely to rise to resistance level 6600.00
S&P 500 index recently broke above the key resistance level 6435.00, which stopped the previous intermediate impulse wave (3) in July.
The breakout of the resistance level 6435.00 continues the active intermediate impulse wave (5) from the start of August.
Given the overriding daily uptrend, S&P 500 index can be expected to rise to the next resistance level 6600.00, coinciding with the daily up channel from May.
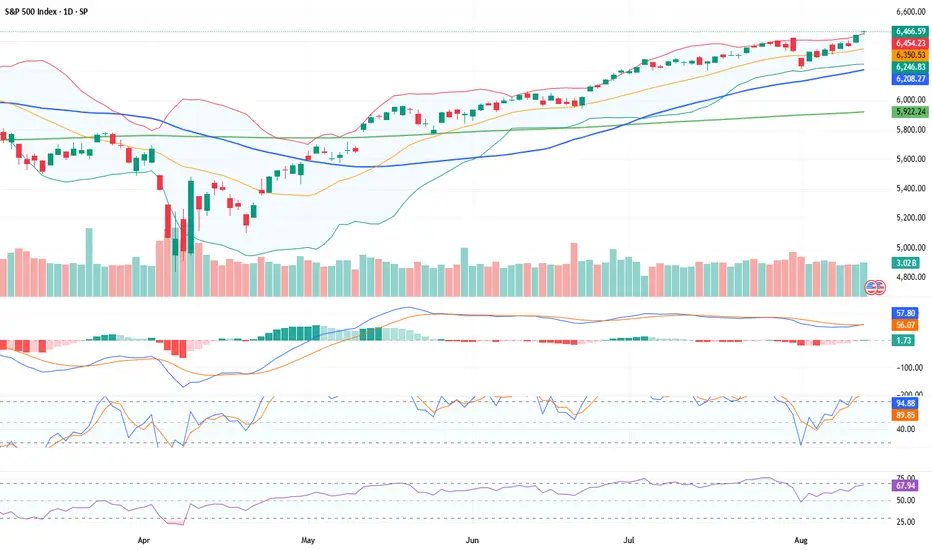
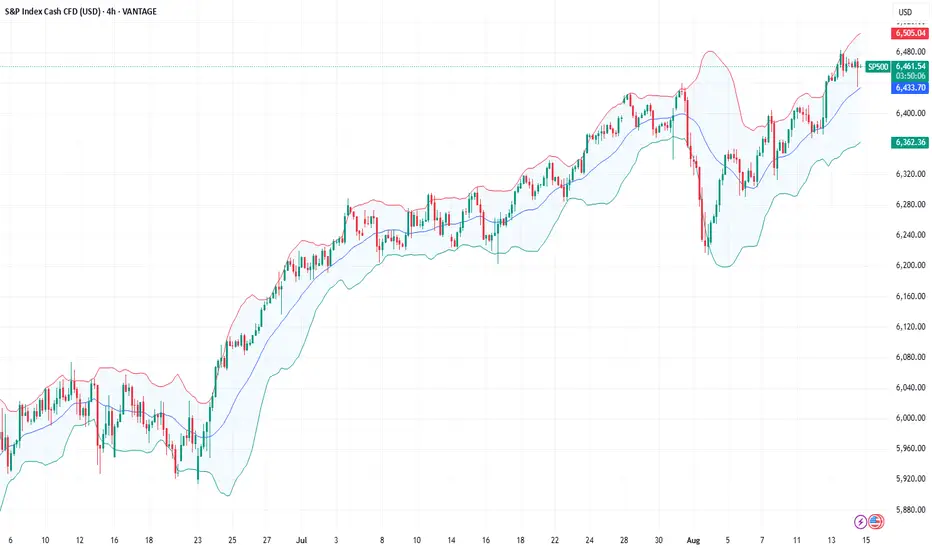
US500 All Time Highs & Strong Bullish MomentumThe US 500 is in a strong bullish phase with record highs, supportive monetary policy, and robust macroeconomic and earnings backdrop. Technical conditions support the trend, but traders should be aware of potential short-term corrections due to overbought signals.The risk to reward profile favours buying dips rather than chasing highs, with strong support at 6,406–6,440 levels and upside targets above 6,500 if positive news persists. Traders should remain vigilant for volatility surges and sector rotations as August & September may bring more erratic price swings, but the fundamental and technical backdrop for the US 500 remains decisively positive.
Fundamental Analysis
Macro Drivers
Inflation & Fed Policy:
The latest July CPI showed headline inflation rising 0.2% MoM and 2.7% yoy, both below consensus forecasts. This has supercharged expectations for a Fed rate cut at the September meeting. CME FedWatch now shows a 94% chance of a rate cut, up sharply in recent weeks. This dovish monetary outlook is a primary tailwind driving new highs in equities.
Earnings:
Strong quarterly earnings, especially from tech and “mega cap” stocks, continue to buoy overall sentiment with all 11 index sectors ending yesterday in positive territory, with growth in technology (+1.6%), communication services (+1.9%), and financials (+1.2%).
Economic Growth & Sentiment:
Despite lingering macro and geopolitical risks notably tariffs and the ongoing global trade worries, recent economic data suggests resilience in consumer demand, supported by moderating inflation, soft labor market data, and improved business confidence. Defensive positioning earlier this year is giving way to more aggressive risk-taking.
Technical Analysis
Price Action & Levels
The US500 closed at fresh record highs of 6,445.76 yesterday, and during today’s intraday trading session it has pushed above 6,460 for the first time ever. Early trading today remains calm to bullish, with potential for further upside.
Breakout , recent action broke above key resistance at 6,406 and 6,440; these now form strong support zones for any pullbacks.
Channel & Trend , the US500 is trading in the upper half of a well-defined ascending channel. Short-term momentum is strongly positive, yet the RSI is nearing overbought territory, suggesting the risk of minor corrections or consolidation.
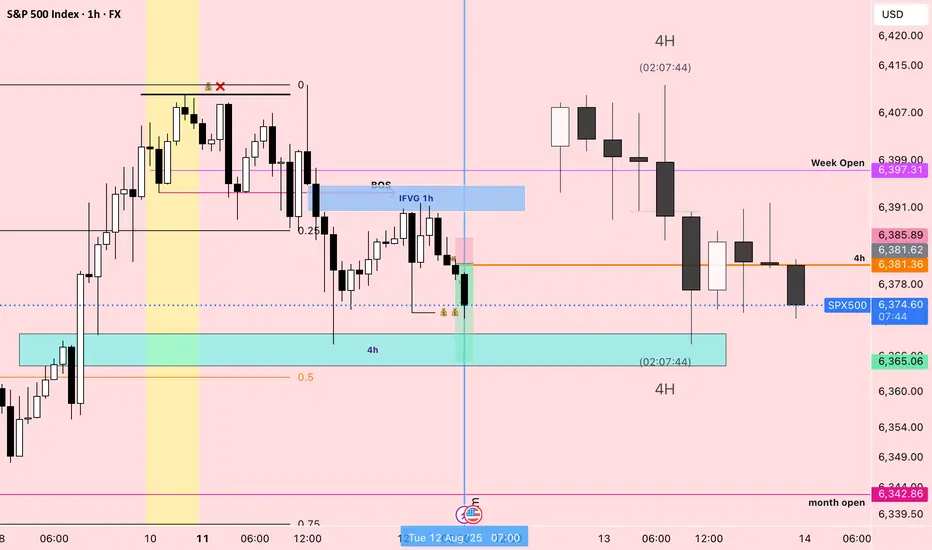
SPX Sells 8/12Sells on SPX made sense because both 4h and 1h candles are currently Bearish, smaller timeframe structure was making LLs and LHs. Liquidity built right before 7am. The 1h hour actually showed the Unicorn setup, which is why I wait until Tuesdays to enter the market. The long upside wick ran the stops and closed below, Price broke structure and left imbalance. It did not fill it all the way.
I am getting better at watching the Liquidity set up first and then sweep. Also need to train my eyes to see the Bullish or Bearish orderflow.
SPX500 TECHNICAL ANALYSISSPX500 has broken above the recent range, reclaiming the 6,351.41 resistance. Price is now pushing into the 6,380.00 zone, with buyers showing control after a strong recovery from the 6,222.46 low.
Support at: 6,351.41 🔽 | 6,324.08 | 6,296.93
Resistance at: 6,380.00 🔼 | 6,409.21 | 6,438.44
🔎 Bias:
🔼 Bullish: Sustained trading above 6,351.41 opens the door toward 6,409.21 and higher.
🔽 Bearish: A close back below 6,351.41 may trigger a retest of 6,324.08 and 6,296.93.
📛 Disclaimer: This is not financial advice. Trade at your own risk.

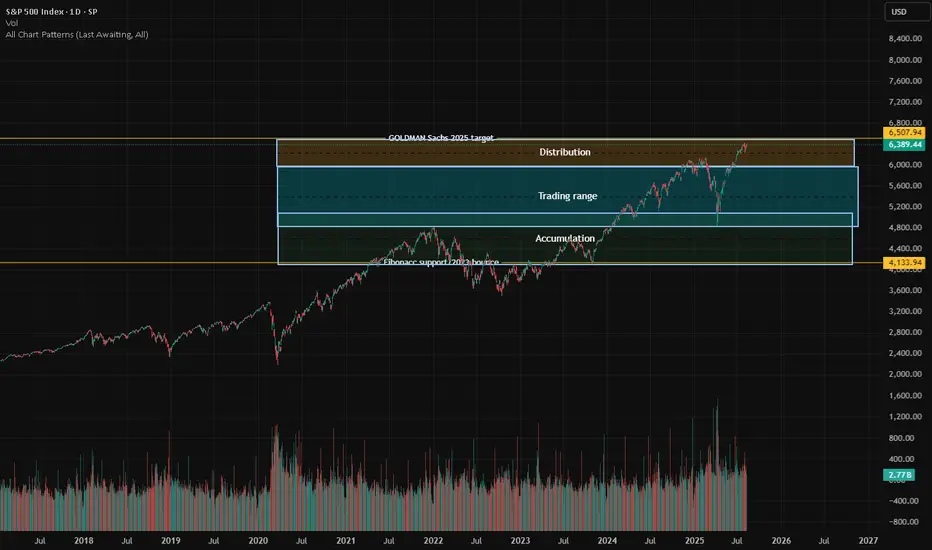
S&P Fibonacci based Accumulation/Distribution rangesFibonacci-Based Zones: The chart is structured around support and resistance zones derived from Fibonacci analysis, providing natural levels for market reaction.
Accumulation Zone: Lower price area (~4,133.94 and above) where buyers show interest and trend reversal is often seeded.
Trading Range: The broad mid-section where price is expected to oscillate, indicating indecision or equilibrium among buyers and sellers.
Distribution Zone: Upper price band near the Goldman Sachs 2025 target, as marked, where profit-taking and seller interest increases.
Potential for Parabolic Move: If price decisively breaks out above the distribution/resistance zone, it could trigger rapid, euphoric buying—a classic market melt-up.
Risk of Downside: Falling below the key Fibonacci support level could prompt a sharp correction,.
Historical Validation: Past price movements respect these zones.
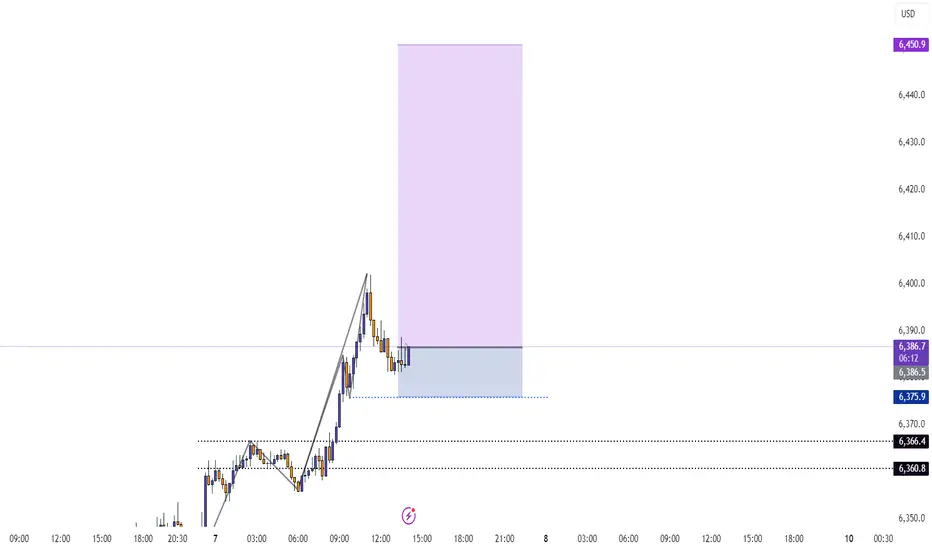
Bulls and Bears zone for 08-08-2025ETH session has rallied to 61.8 Fibonacci level of yesterday's RTH session. Any test of ETH session High could provide direction for the day.
Level to watch: 6384 --- 6386

This V-Pattern on SPX500 Is Stupid CleanHey, it’s Skeptic.
In this video, I’m breaking down a clean V-pattern setup on SPX500 — right in line with what I taught in yesterday’s educational post.
We’re starting from the Daily time frame and walking through the logic behind my long trigger, why the previous fakeout was actually useful, and how to set your stop-loss depending on your trading style (H4 vs 15min).
This isn’t just chart talk — it’s about reading the story behind the candles.
If it helped you see things clearer, give it a boost and drop your thoughts below.
Let’s keep learning — one trap at a time.
Until next time, peace out.
📌 Disclaimer: This video is for educational purposes only and does not constitute financial advice. Always do your own research and manage your risk.

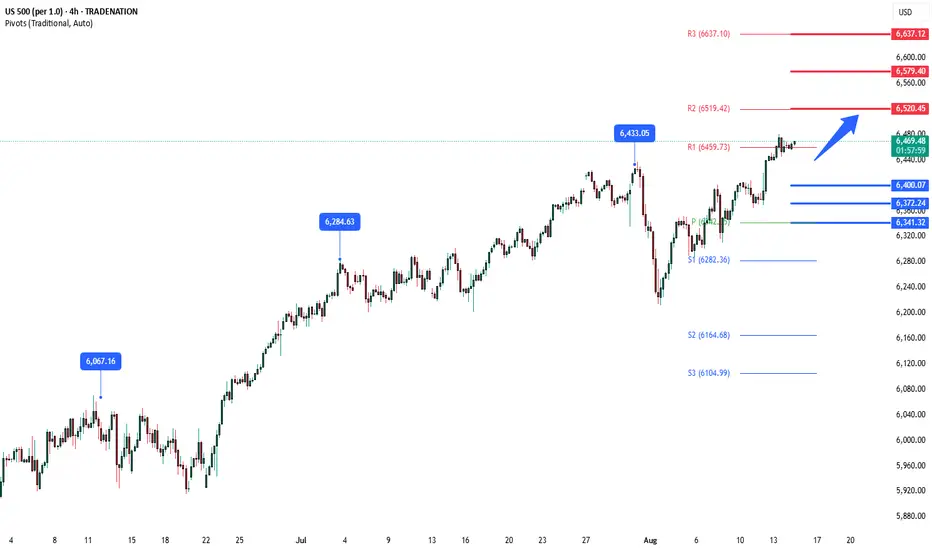
S&P bullish continuation supported at 6340Tariff Turmoil and Geopolitical Shifts – Implications for S&P 500 Trading
Donald Trump's sweeping new tariffs officially took effect, hitting nearly all U.S. trading partners. Switzerland, facing the steepest rates among developed nations, may retaliate by cancelling a major fighter jet purchase, signaling potential defense-sector implications.
Key developments:
Semiconductor imports to face 100% tariffs, unless production is moved onshore – a bullish signal for domestic chipmakers (e.g., Intel, GlobalFoundries) but negative for firms reliant on overseas fabs.
Additional tariffs floated on China over purchases of Russian oil, echoing similar penalties on India – suggesting growing fragmentation in global trade.
Market impact:
S&P 500 sectors likely affected:
Tech (Semis): Tariff pressure may weigh on multinationals like Nvidia or AMD short term, but benefit domestic fabs and U.S.-based supply chains.
Industrials/Defense: Swiss retaliation could ripple through defense contractors if deals are halted.
Energy/Commodities: Any China-Russia oil tensions could lead to energy volatility, affecting names like ExxonMobil or ConocoPhillips.
Meanwhile, China’s exports unexpectedly rose, softening the blow from the U.S. tariff crackdown. Chinese equity gains could calm broader EM sentiment, helping mitigate global risk-off contagion.
Finally, Trump signaled potential peace talks with Putin and Zelenskiy, with the Kremlin confirming a Putin meeting soon. A diplomatic breakthrough could ease geopolitical risk, supporting investor sentiment and equities globally.
Bottom Line for S&P 500:
Expect sector rotation as traders digest tariff fallout. Watch for:
Strength in domestically focused tech and defense stocks
Caution around globally exposed industrials and semis
Short-term volatility tied to trade rhetoric and geopolitical headlines
Key Support and Resistance Levels
Resistance Level 1: 6437
Resistance Level 2: 6480
Resistance Level 3: 6520
Support Level 1: 6340
Support Level 2: 6295
Support Level 3: 6256
This communication is for informational purposes only and should not be viewed as any form of recommendation as to a particular course of action or as investment advice. It is not intended as an offer or solicitation for the purchase or sale of any financial instrument or as an official confirmation of any transaction. Opinions, estimates and assumptions expressed herein are made as of the date of this communication and are subject to change without notice. This communication has been prepared based upon information, including market prices, data and other information, believed to be reliable; however, Trade Nation does not warrant its completeness or accuracy. All market prices and market data contained in or attached to this communication are indicative and subject to change without notice.
