US500 Will Go Down From Resistance! Short!
Take a look at our analysis for US500.
Time Frame: 9h
Current Trend: Bearish
Sentiment: Overbought (based on 7-period RSI)
Forecast: Bearish
The market is on a crucial zone of supply 5,525.49.
The above-mentioned technicals clearly indicate the dominance of sellers on the market. I recommend shorting the instrument, aiming at 5,306.14 level.
P.S
We determine oversold/overbought condition with RSI indicator.
When it drops below 30 - the market is considered to be oversold.
When it bounces above 70 - the market is considered to be overbought.
Disclosure: I am part of Trade Nation's Influencer program and receive a monthly fee for using their TradingView charts in my analysis.
Like and subscribe and comment my ideas if you enjoy them!
US500AUD trade ideas

S&P 500: What’s Happening?S&P 500 Market Update
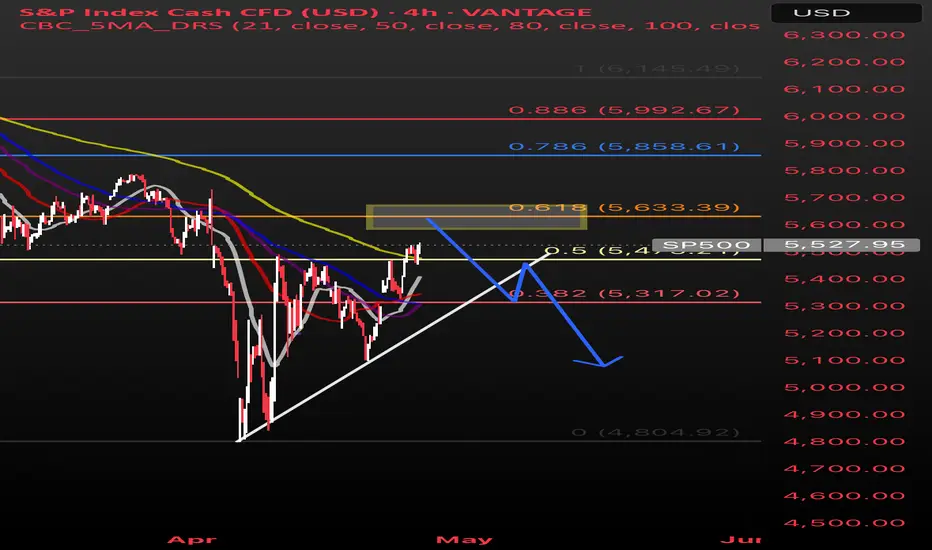
Recent changes to tariffs have made investors feel more confident, and because of that, the S&P 500 has broken out of a downward trend it had been stuck in. This breakout suggests prices could continue rising for now.
However, technical analysis shows that many investors might still be cautious. A lot of them may plan to sell if the market climbs back near $5,650 (faded yellow rectangle box on chart), trying to limit losses compared to when prices dropped to around $4,800 a few weeks ago.
If the market struggles to get past $5,650 (faded yellow rectangle box on chart), we could see prices fall again, possibly down to around $5,300, before the market settles for a bit and decides on its next big move.
• Blue line: shows the path I expect the market to take based on investor behavior and technical patterns.
• White line: shows the general trend where buyers typically step in. If the price falls through this line, it could signal more downside ahead.
SPX / SPY / ESM5 - Resistance levels aheadSPX is looking healthier above its shorter term MAs, particular with two closes above the 21 and downward trend line. There are still plenty of resistance areas ahead, including key fib levels, a gap fill, 100 and 200 down-sloping EMAs, and a swing symmetry level.

What the S&P did and what to look forward to this coming week. A walkthrough different levels on the S&P for the short term (1-2 weeks).
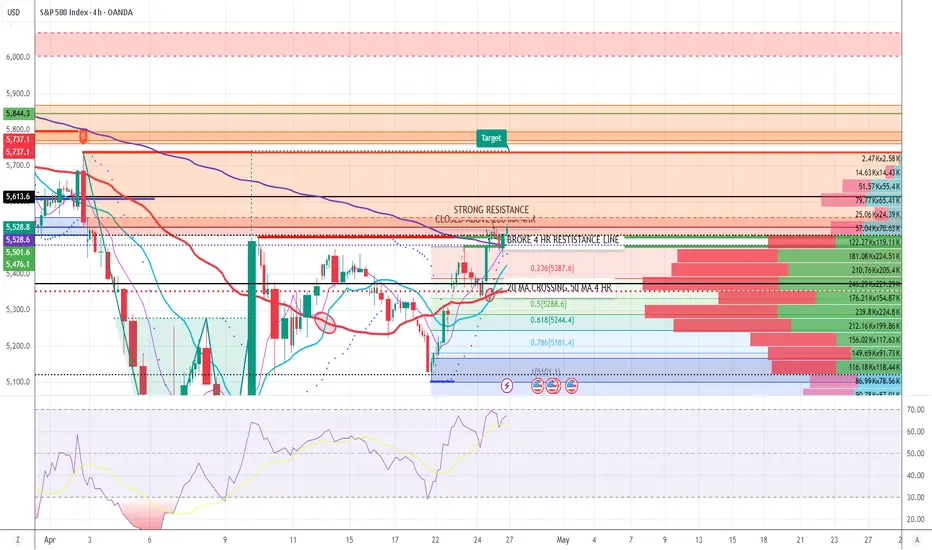
The S&P broke above a key weekly downtrend line this past week, shifting the structure slightly more bullish in the short term. We’re now testing an important resistance zone with multiple possible scenarios ahead.
Scenarios for the Week Ahead:
Bullish:
If the S&P holds above the breakout zone (5484) and continues climbing, we could see a move toward 5,650 (near the declining 50SMA). Some minor pauses or consolidations could occur at moving averages, but overall momentum would remain constructive if buyers stay active.
Bearish:
If the S&P fails to hold above 5,484 and breaks back below the uptrend line, we could see a pullback toward (in this order) 10 and 20 EMAs, recent uptrend line, or at most the key level around 5,264. A deeper breakdown seems less likely unless broader selling pressure returns.
Neutral: Think this would be a chop between where it is at now and 5650.

S&P 500 Daily Chart Analysis For Week of April 25, 2025Technical Analysis and Outlook:
In this week's trading session, the Index did steady to higher prices, distancing itself from the rendered obsolete Mean Resistance level of 5455 and targeting the next significant mark identified as Outer Index Rally 5550. This trend lays the groundwork for a continued upward movement; however, there is also a considerable risk of a sharp pullback to the Mean Support level of 5370 after reaching the Outer Index Rally at 5550.
Contrariwise, it is essential to acknowledge the possibility of upward momentum continuation resulting in meeting the primary target Outer Index Rally 5550 by challenging the Mean Resistance of 5672 and extending toward additional levels: Mean Resistance 5778 and Outer Index Rally 5945.

Another move down for SPX500USD?Hi traders,
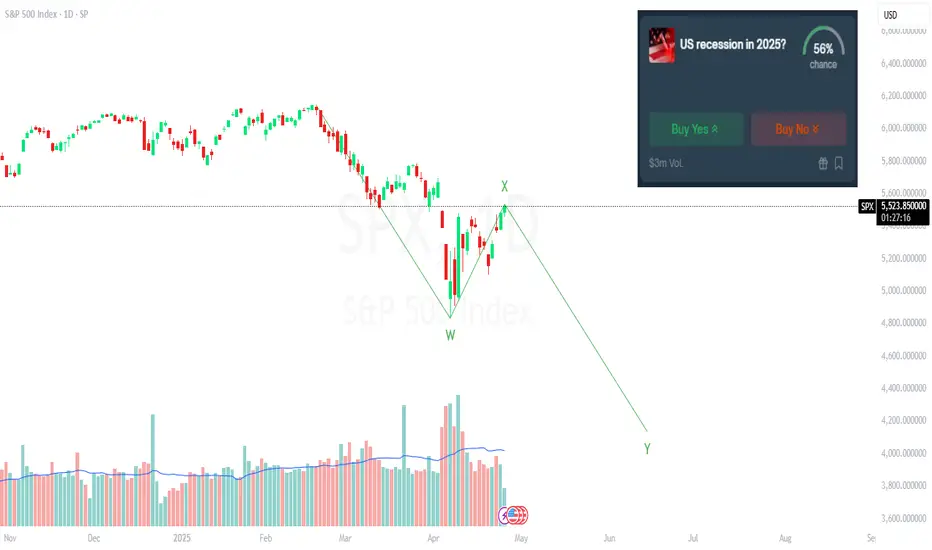
SPX500USD made a bigger orange X-wave last week into the Daily FVG.
So next week we could see the start of the last impulse wave down to finish the bigger (red) WXY correction. But it first has to close below the Daily FVG.
Let's see what the market does and react.
Trade idea: Wait for a change in orderflow to bearish, a small impulse wave down and a small correction up on a lower timeframe to trade shorts.
If you want to learn more about trading FVG's & liquidity sweeps with Wave analysis, then please make sure to follow me.
This shared post is only my point of view on what could be the next move in this pair based on my technical analysis.
Don't be emotional, just trade your plan!
Eduwave

Trading Notes - April 26th
I’m struggling to stay bearish on US stocks-bearish in the short-term as the sentiment is now mainstream. The negative news dominating the headlines could create a lot of potential for a surprise upside move in the near term.
Yesterday’s steady SPX rally, despite no news, was impressive. We could easily rally another 2-4% in the short term. The sharp downside move over the last couple months does leave potential for a local lower high which would be concerning.
If there are trades to be made, intraday ranges is where I’d put my focus on stocks (and not be tooo greedy). Bitcoin has the potential the put in a macro reversal if it closes the week strong. A swing trade entry at the 200 daily MA on BTC is still in play.
SPX Technicals
Volume profile:
POC: $5609
Upside interest: $5750
Downside interest: $5303
The line in the sand over the next 2 months is the 5120 level - the August 2024 low. If we close June there, 6M bearish divergence on the RSI leaves potential for a prolonged bear market. But that’s enough long-term analysis at a news-driven time when technicals have little bearing on price action.
What I’m focusing on this week:
- Sizing down
- Taking quick profits
- Watching trump’s tweets

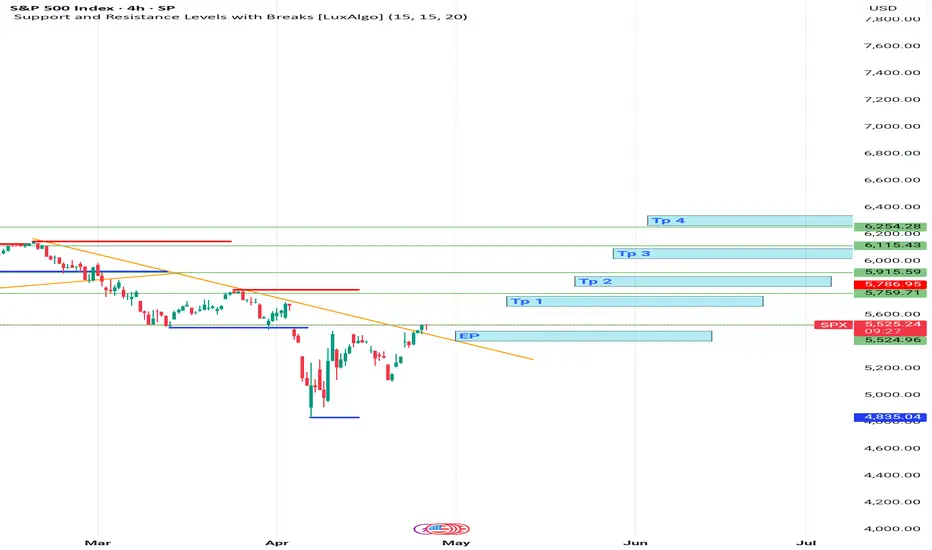
S&P 500 Rockets Past Resistance-Is 5,728 Next?The S&P 500 (SPX) formed a double bottom pattern on Monday, April 7, and Wednesday, April 9, on the 4-hour timeframe, signaling a potential reversal from recent lows. Later on April 9, the index broke above resistance, confirming short-term bullish momentum. On April 24, the 20-period moving average crossed above the 50-period moving average, reinforcing the strength of the emerging uptrend. By April 25, a 4-hour candle closed above the 200-period moving average, providing further confirmation of a strong bullish trend. That same day, the SPX broke through the significant resistance level at 5,501, with a candle closing above this level, which supports the view of continued upward movement. Based on my technical setup, the next potential target is projected at 5,728.
S&P 500 - Key Levels and Measurements (Bonds vs Yields vs Homes)Happy Friday!!!
Starting with a BLANK chart, here are my key levels and measurements for the S&P 500
Earnings season is stable, more MAG 7 next week with AAPL, AMZN, META, MSFT
Trump and Company are softening the trade war narrative quickly and the market
is taking notice. Prices recovered nicely this week
5500 SPX is a key level for the bulls to push above - if done look for open space
melt-up into 5700-5800 resistance
If SPX rejects 5500 early next week we will be dealing with some more noise
and intermediate levels
4830 lows will be absolutely critical to maintaining a long-term bull market. You will
see why with this analysis.
Last piece is talking about bonds vs yields and the current housing market in the US
My belief is that yields stay sticky and home prices MUST drop to see any improvements
in affordability
Thanks for watching - have a great weekend!!!

Spy putsHello friends.
We just bought some 5/16 $550 SPY puts. It's looking like the low for this crash is not anywhere near being in. Retail is still in a buying frenzy because they expect that this will be another V shaped recovery like we're used to. Meanwhile the smart money is selling everything they have and expecting more blood. The fed hasn't come in to save this market, and they aren't going to be able to. Their hands will be tied by artifical inflation caused by tariffs and there won't be an intervention until it's already too late.
Could The Stock Market Crash? - WARNING 🚨MartyBoots here , I have been trading for 17 years and sharing my thoughts on SPX .🚨
🚨 SP:SPX Could It Crash?🚨
Lets look into it deeper, very interesting chart but also a dangerous one. Need to see buyers soon or this is could be worse than people expect. 5-10% drop minimum and extreme bear could drop 40% total🚨
Watch video for more details

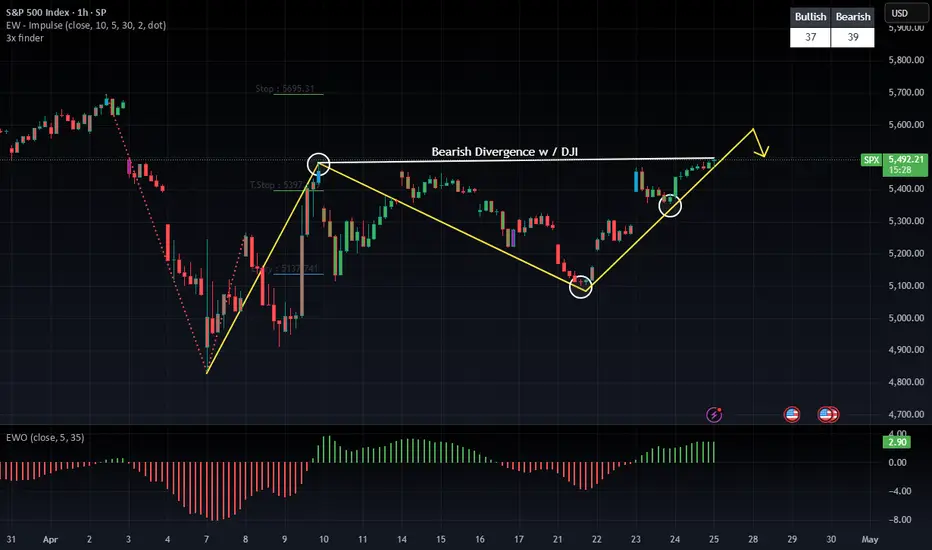
Bearish WXY Model Forming at Key Resistance – Caution at the TopSP:SPX just crossed the Monthly High, but the structure resembles a bearish WXY correction, and we’re now approaching critical levels.
🔍 Key Levels to Watch:
5481–5572: Weekly FVG resistance + 61.8% Fib Extension – potential top of the rally.
5293: The 50% retracement from the Apr 20 low – a break below confirms the bearish WXY and opens the door to new lows.
📌 Scenario Outlook:
✅ Bullish case: Room for upside toward 5685–5750, but only if we close above 5572 Weekly to invalidate the FVG.
⚠️ Bearish case: Current price action aligns with divergence (as seen with DJI) + WXY model. Caution advised — rallies may be fading.
💬 Chart attached shows the WXY structure forming with key divergences.
the 2 gapsOverview of the market and it's possible direction. We are over the 18ma so the bias is up, but we haven't broken the range yet.

S&P 500 tests key resistance as trade uncertainty continuesTrump continues to say positive things - just now suggesting that they are very close to a deal with Japan on tariffs. But it is China where the bulk of uncertainty lies. He has been quite upbeat this week, but China continues to push back against the optimism.
European indices extended their gains, buoyed by the previous day’s upbeat mood, while US futures have given up their earlier gains. The shift likely linked to an interesting interview US President Donald Trump gave to Time Magazine.
While Trump claimed Chinese President Xi had personally rung him — and insisted that negotiations with Beijing were progressing — it was his remark that he’d consider “50% tariffs a year from now” to be a success that seemed to spook investors. Unsurprisingly, that struck a more hawkish tone, nudging some traders to lock in profits.
Earlier in the session, risk appetite had been given a lift after reports surfaced that China was weighing tariff exemptions for select US imports. This, combined with upbeat comments from Trump the day before and a solid set of earnings from Alphabet, helped extend the rally in equities.
Gold, meanwhile, gave back some ground — dipping below the $3,300 mark — as safe haven demand cooled in response to the renewed optimism. Yet, beneath the surface, caution remains palpable. Trump’s off-the-cuff comment about 50% tariffs a year from now served as a stark reminder that nothing is set in stone, and that the trade saga is far from over.
As such, while some of the worst risk-off flows may be behind us, it’s far too soon to declare an end to the market turmoil. A period of consolidation — both in equities and gold — may now be on the cards.
Meanwhile the S&P 500 has entered a key area of resistance between 5490 to 5550 area. A bearish trend line also comes into play. A clean break should be positive from a short-term point of view, while a sharp rejection is what the bears would be looking for.
By Fawad Razaqzada, market analyst with FOREX.com

Bitcoin is correlated to the stock market.Bitcoin is correlated to the stock market.
What do you think is most likely gonna happen once we get a Dotcom or GFC type of bust?
Narratives and storylines change, the chart analysis remains the same.
