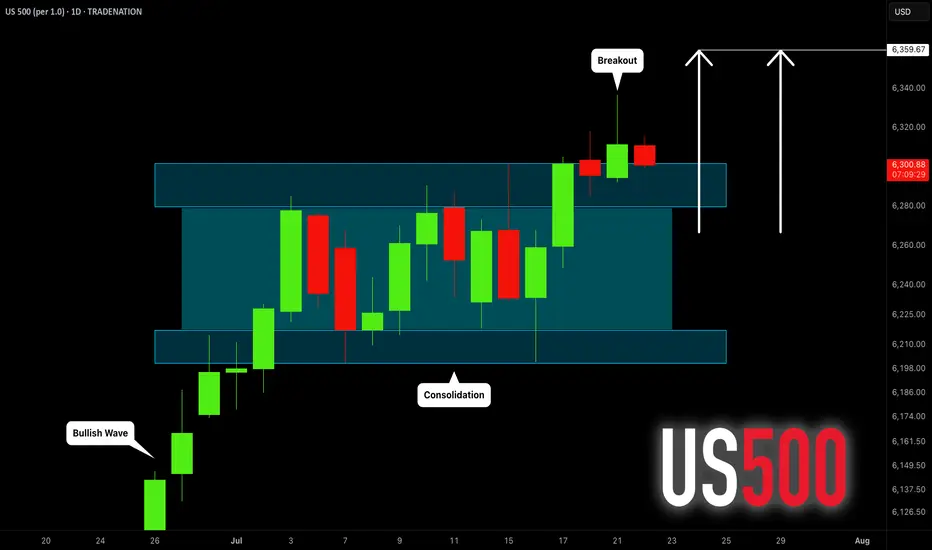
S&P500 INDEX (US500): Bullish Trend Continues
US500 updated a higher high this week, breaking a resistance
of a bullish flag pattern on a daily time frame.
I think that the market will rise even more.
Next goal for the bulls - 6359
❤️Please, support my work with like, thank you!❤️
I am part of Trade Nation's Influencer program and receive a monthly fee for using their TradingView charts in my analysis.
US500AUD trade ideas
S&P500 sideways consolidation breakoutKey Developments:
Fed Politics: Treasury Secretary Scott Bessent called for a review of the Fed’s $2.5B HQ renovation, continuing political pressure on Jerome Powell. This adds to the uncertainty around Fed independence and rate path.
Meme Stock Surge:
Opendoor soared 121% amid a retail-driven frenzy.
Major institutional investors are also chasing the rally, pushing broader equities to record highs.
However, upcoming Alphabet and Tesla earnings could be a turning point for momentum.
Corporate News:
Hewlett Packard Enterprise suffered a $985M loss in the Autonomy case—corporate governance and M&A risks in spotlight.
Sarepta paused drug shipments amid backlash—biotech volatility rising.
LA Times plans IPO—media valuations may resurface.
Crypto Moves:
Trump Media bought $2B in Bitcoin and related assets, aiming to become a crypto treasury.
JPMorgan may lend against crypto, signaling broader institutional adoption.
Tech & AI:
MIT’s Andrew Lo predicts AI will make real investment decisions in 5 years.
OpenAI–Oracle to expand US data center capacity by 4.5 GW—significant tech infrastructure tailwind.
Conclusion for S&P 500 Trading:
The S&P 500 remains supported by strong risk appetite, AI optimism, and crypto momentum, but faces near-term tests from key tech earnings (Alphabet, Tesla). Political noise around the Fed and signs of speculative froth (meme stocks) could introduce volatility. Stay bullish with caution—watch earnings and Fed commentary closely for market direction.
Key Support and Resistance Levels
Resistance Level 1: 6340
Resistance Level 2: 6390
Resistance Level 3: 6457
Support Level 1: 6270
Support Level 2: 6224
Support Level 3: 6156
This communication is for informational purposes only and should not be viewed as any form of recommendation as to a particular course of action or as investment advice. It is not intended as an offer or solicitation for the purchase or sale of any financial instrument or as an official confirmation of any transaction. Opinions, estimates and assumptions expressed herein are made as of the date of this communication and are subject to change without notice. This communication has been prepared based upon information, including market prices, data and other information, believed to be reliable; however, Trade Nation does not warrant its completeness or accuracy. All market prices and market data contained in or attached to this communication are indicative and subject to change without notice.

S&P 500 H1 | Swing-low support at 38.2% Fibonacci retracementThe S&P 500 (SPX500) is falling towards a swing-low support and could potentially bounce off this level to climb higher.
Buy entry is at 6,291.07 which is a swing-low support that aligns with the 38.2% Fibonacci retracement.
Stop loss is at 6,270.00 which is a level that lies underneath a pullback support and the 50% Fibonacci retracement.
Take profit is at 6,338.29 which is a swing-high resistance.
High Risk Investment Warning
Trading Forex/CFDs on margin carries a high level of risk and may not be suitable for all investors. Leverage can work against you.
Stratos Markets Limited (tradu.com ):
CFDs are complex instruments and come with a high risk of losing money rapidly due to leverage. 66% of retail investor accounts lose money when trading CFDs with this provider. You should consider whether you understand how CFDs work and whether you can afford to take the high risk of losing your money.
Stratos Europe Ltd (tradu.com ):
CFDs are complex instruments and come with a high risk of losing money rapidly due to leverage. 66% of retail investor accounts lose money when trading CFDs with this provider. You should consider whether you understand how CFDs work and whether you can afford to take the high risk of losing your money.
Stratos Global LLC (tradu.com ):
Losses can exceed deposits.
Please be advised that the information presented on TradingView is provided to Tradu (‘Company’, ‘we’) by a third-party provider (‘TFA Global Pte Ltd’). Please be reminded that you are solely responsible for the trading decisions on your account. There is a very high degree of risk involved in trading. Any information and/or content is intended entirely for research, educational and informational purposes only and does not constitute investment or consultation advice or investment strategy. The information is not tailored to the investment needs of any specific person and therefore does not involve a consideration of any of the investment objectives, financial situation or needs of any viewer that may receive it. Kindly also note that past performance is not a reliable indicator of future results. Actual results may differ materially from those anticipated in forward-looking or past performance statements. We assume no liability as to the accuracy or completeness of any of the information and/or content provided herein and the Company cannot be held responsible for any omission, mistake nor for any loss or damage including without limitation to any loss of profit which may arise from reliance on any information supplied by TFA Global Pte Ltd.
The speaker(s) is neither an employee, agent nor representative of Tradu and is therefore acting independently. The opinions given are their own, constitute general market commentary, and do not constitute the opinion or advice of Tradu or any form of personal or investment advice. Tradu neither endorses nor guarantees offerings of third-party speakers, nor is Tradu responsible for the content, veracity or opinions of third-party speakers, presenters or participants.

Waiting for a Clear Signal: Too Early to Short the IndexNothing interesting is forming on the index so far.
My outlook remains neutral.
I previously attempted to short it, but those attempts were unsuccessful. Now I need to wait for a more reliable entry point — the chart will show the way.
For now, I’m staying on the sidelines.
Historically, the start of the Fed’s rate-cutting cycle has always coincided with the beginning of a decline in the stock market. I believe this time won’t be an exception — but for now, it’s too early to short.
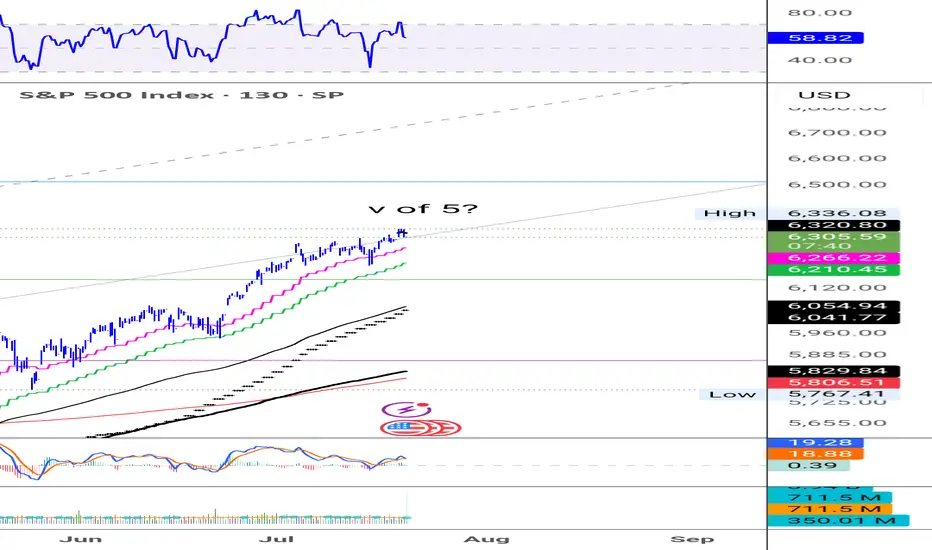
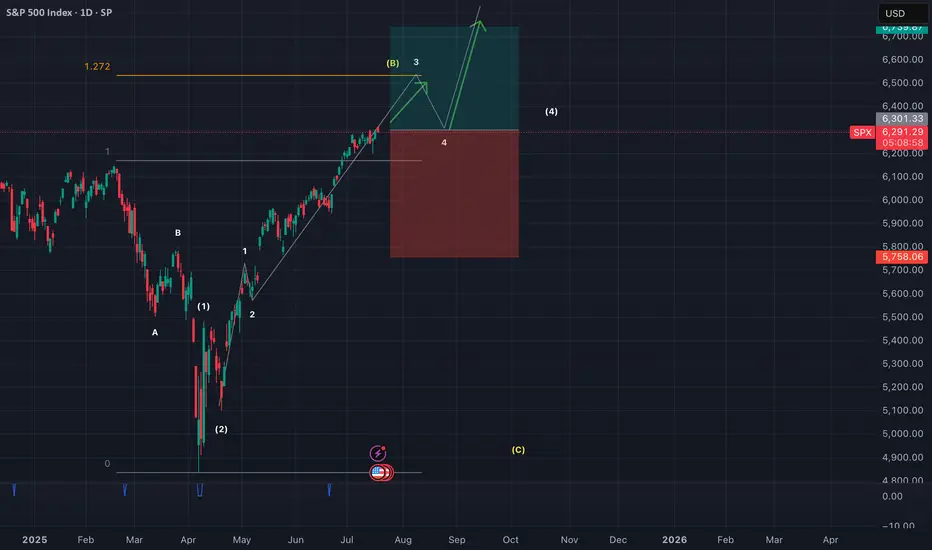
SPX - Time for a correction? To make it very simple,
Prices have been going up very nicely those last few weeks and months.
Everyone is happy but as we know that can't last.
NASDAQ:OPEN seems to be the latest pump and dump and it's just another sign of a coming correction imho.
Most stocks I've been following have reached resistance zone, levels where profit taking is very likely.
$S&P500 seems to have made a fifth wave, RSI divergence is present and confirming that.
It's difficult to pinpoint the exact top of course so I'm giving myself some leeway and use a small 1% stop loss in this case.
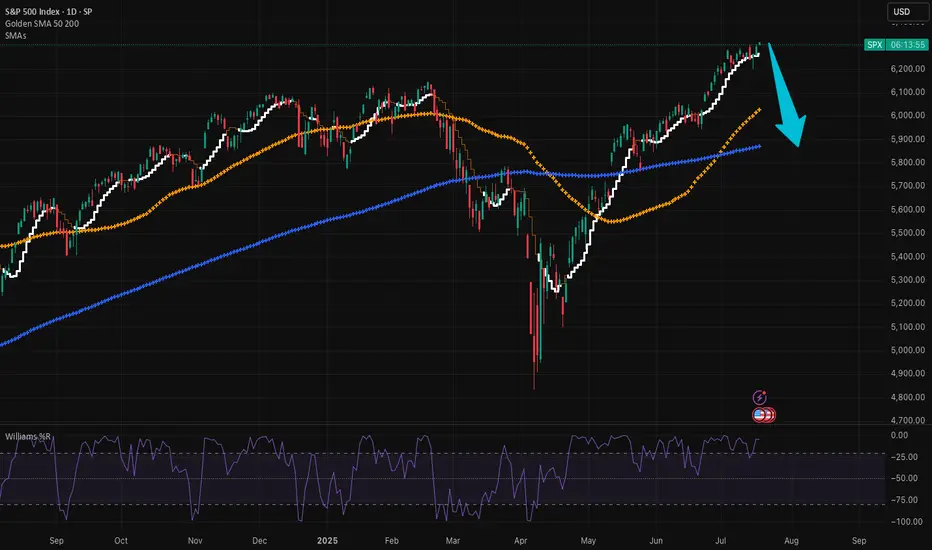
S&P bearish div on the dailySuspiciously... the market is correcting today before Powell has opened his mouth.
Bearish div on the daily chart above ATH's
Big correction coming?

US500 Swing short tradeUS500 index is on the verge of major drop. I expect the price to sink in the coming weeks, that's why this will be a swing trade. I expect to reach my main target of $6000 around mid/end of August, with a second short entry once we will start to drop and retrace till my key level.

LAST WEEK TO GET BIDSSo as earnings push higher, it is expected that indices will try to push as there are no major news events however as this overbought Sp500 is due for correction if it taps the 6330 threshold to get to 6400.

$SPX Trading Range for 7.21.25 and everything in itToday’s Trading range and everything in it. How are you playing it?
SPX: Banks beat, stocks peakThe US equity markets remained relatively resilient this week, despite ongoing concerns about trade policy developments. After last week’s slight retreat from its all-time high, the S&P 500 resumed its upward momentum early in the week, continuing to hover near record levels. The index reached a new highest level of 6,315 on Friday before pulling back slightly, closing the week at 6.296.
Bank earrings were in focus of investors during the previous week. Overall, Q2 reports from major U.S. banks showed resilience — better-than-expected earnings, strong interest income, and robust capital actions. So far, the finance sector has seen Q2 earnings rise around 13% y/y and 3,4% revenue growth. In addition, a stress test posted by Fed underpin confidence as all major banks, including JPMorgan and Citi showing resilience also under potential stress conditions. However, both bankers and investors held a cautious tone on macro/public policy risk.
Investors' confidence was additionally boosted by better than expected US macro data posted during the previous week. The inflation rate in June was 0,3% for the month and 2,7% on a yearly basis. At the same time, retail sales beat market expectations with an increase of 0,6% in June. As per analysts reports, currently 27 stocks included in the S&P 500 are trading at the all time highest levels. The ADM company, which is well known for producing Coca Cola, had a drop in the value of shares of 2% after the US President requested from the company to use real cane sugar in their popular drink.
From July 23st a composition of companies included in the S&P 500 index will be changed. A crypto company Block will be included, while the company Hess will be excluded from the index. Shares of the Blok surged by 10% on Friday, after the release of the news.
US stocks hold near record highs on strong 2Q earnings
Despite elevated valuation pressures, US equities remain near all-time highs. While tariff concerns persist, resilient US economic data continues to support the market's upward momentum.
United Airlines reported a 1.7% YoY increase in 2Q revenue, citing easing geopolitical and macroeconomic uncertainties and a double-digit rebound in corporate demand. Meanwhile, earnings and share performance among mega-cap stocks have also been strong.
Netflix (NFLX) beat market expectations with 2Q revenue of $11.08 billion and EPS of $7.19. At the same time, Nvidia (NVDA) reached a fresh all-time high on renewed optimism over a potential resumption of exports to China.
After testing the support at 6285, US500 rebounded and approached its previous high again. The index holds above EMA21, suggesting the continuation of bullish momentum. If US500 remains above both EMA21 and the support at 6285, the index could breach the 6320 high. Conversely, if the US500 breaks below the support at 6285, the index could retreat further toward 6200.

Things are about to get wild. Just for fun... Hey, it can happen... right? 🤔😉
85% drop then.. hyper inflation.

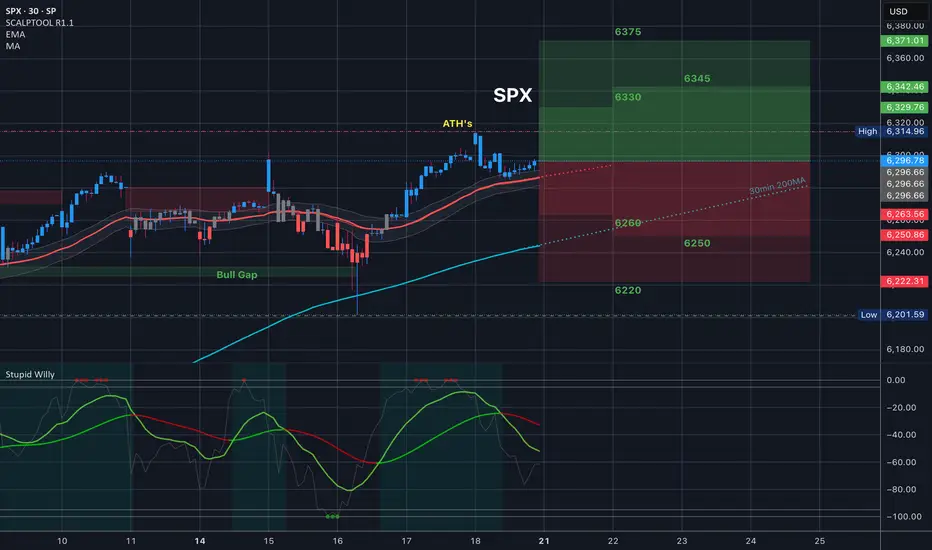
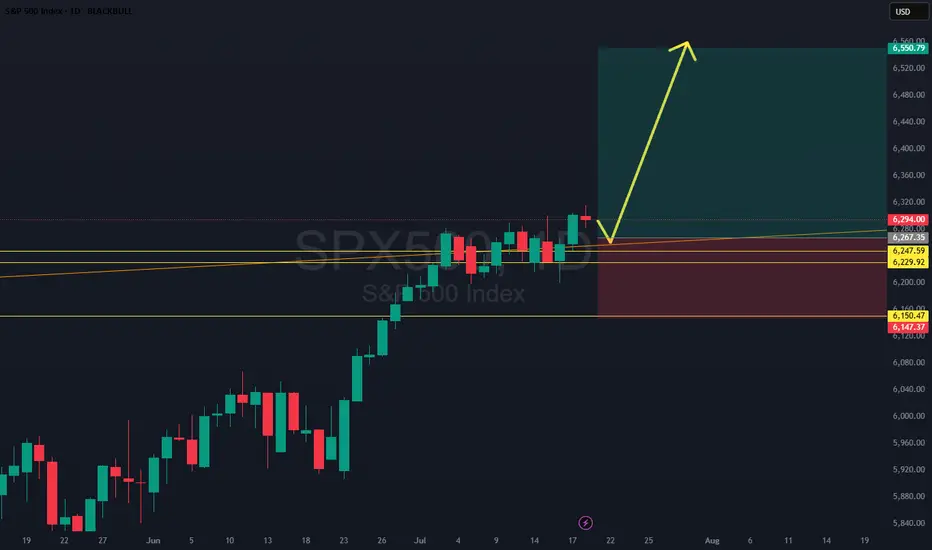
SPX500: Clean Breakout Setup - Trade of the Week?SPX500 just broke and closed above a key daily level, confirming strength after a bull flag formed off a skinny leg up. The plan? Wait for a retest of that flag structure, then ride momentum higher. We’ve got a conservative stop below solid support, making this one of the cleanest, most technically sound setups of the week. Only watch-out: price may not give the retest and could continue running. Either way, structure favors the bulls.
SPX 500 TO CONTINUE HIGHER Week of July 20, 2025 SPX500 will continue going higher as we don't have any reversal setup yet on the higher time frames, although there is a lot of hesitation on the chart as the past week's new high was not supported. The trend on 4 hours to weekly is still up and has no break of major moving averages yet. I am looking forward to either a capitulation new high candle or a bullish new high candle that breakout of the weekly consolidation zone as we enter another trading week. I hope my thought process and analysis is helpful for making your own trading or investment decisions.
Thank you for listening and wish everyone a great trading week.
Cheers

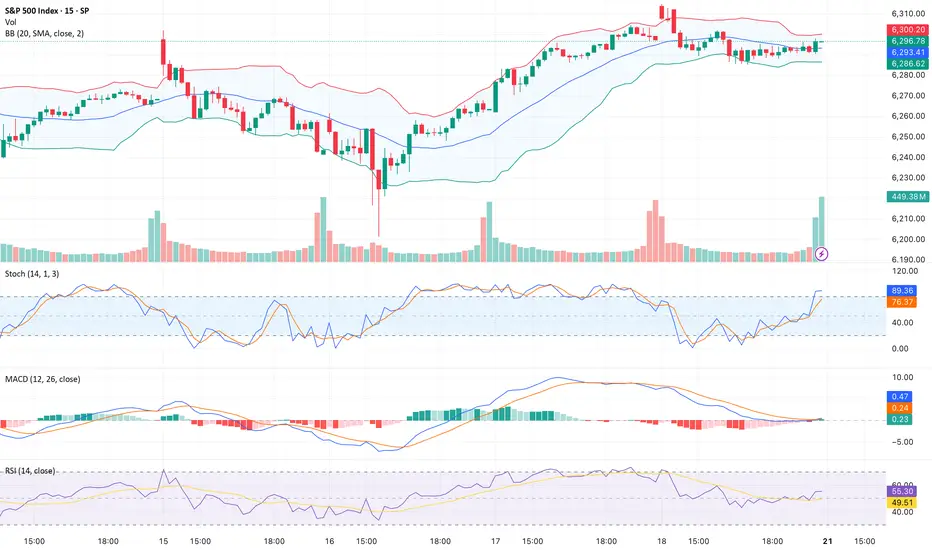
15_MinThis is a 15-minute timeframe chart, where each candlestick represents 15 minutes of trading activity. It is primarily used by intraday traders and scalpers to identify short-term trends, breakout zones, and momentum plays.
This chart of the S&P 500 (SPX) reflects intraday movements with real-time tracking of support/resistance zones, volume spikes, and short-term patterns.
Weekly Review: The S&P and NASDAQ once again hit all time highs during the week starting Monday 14 July. Which is a sign of confidence despite the ongoing external threats (tariffs / Middle East). I've noticed the current earnings season wasn't approached with as much trepidation as recent earnings seasons have been. Of course, that could come crashing down as companies continue to report over the next couple of weeks.
Once again, the currencies didn't quite react in accordance with the overall 'positive risk environment'. As each of the 'risk off currencies' offers their own separate challenges:
Ever since the recent NFP data, the USD had been strong, the FED continues to maintain a view for a 'slow pace of rate cuts' and US data backs up that view. Particularly this week's retail sales data, even CPI, although relatively benign, wasn't soft enough to warrant a 'FED pivot' towards a more dovish stance. The USD spent most of the week on the front foot, although the 'higher for longer' narrative was put to the test when the president once again offered his views on Mr Powell. Also FED board member WALLER chipped in with some dovish comments. Currently, it's up in the air as to how many more rate cut the FED will implement before year end (if any). The narrative at the July FOMC meeting could go a long way to determine the dollar's direction for the rest of the summer. But ultimately, it'll be the data that decides.
Recently, I've been encouraged by the re-emergence of JPY weakness. This past week, I put any periods of JPY strength down to profit taking before this weekends election. I need to do some reading regarding the implications of the result. But I'm 'hopeful' that over the coming weeks and months the 'old fashioned, JPY short 'risk on trade', will be prevalent.
The CHF continues to have a mind of it's own. It could be tracking EUR strength, it could be the article I read about gold, it could be SNB intervention, It could be random, or something I'm not aware of. Ultimately, until I'm comfortable the CHF is back in correlation with the risk environment, my preference is to short the JPY instead.
In other news, disappointing AUD data took the shine off the hawkish RBA. But I still view the AUD as a good 'risk on' long.
I'll begin the new week with an open mind. My preference remains for 'risk on' trades. But it's a case of keeping up to date with all of the narratives, if momentum aligns with logic and a narrative. And you feel comfortable with a stop loss and profit target, place the trade. But, be aware that the narrative the market is focused on can change from day to day.
On a personal note, it was a week of two trades. A post US CPI 'risk on' AUD JPY long. The trade stopped out. And as discussed during the week, it was one of those situations where if I would have been at the charts and hour later, I would have traded a different pair. That's life.
The second trade was AUD USD long. Post WALLER'S dovish comments, I felt the USD short momentum could continue. On my account the trade hit profit by the skin of its teeth before reversing. Again, that's life. Sometimes you get good luck, sometimes you get bad luck. I feel it's important to acknowledge good luck, as we often only focus on the bad luck we have.
The USD is finely poised and I'm intrigued to see where the data and rate cut narrative takes it over the coming weeks.
Results:
Trade 1: AUD JPY -1
Trade 2: AUD USD +1.2
Total = +0.2%
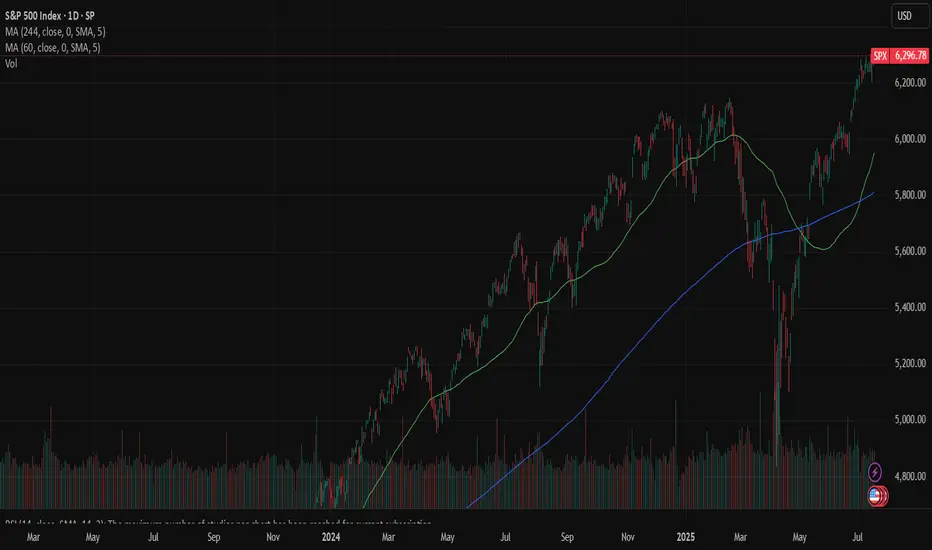
1_Day_ChartThis chart represents the 1-day (Daily timeframe) price action of the S&P 500 Index (SPX), offering a focused view of market sentiment, key levels, and trend momentum as of . Each candlestick reflects a full trading day.
📊 Chart Parameters:
Instrument: S&P 500 Index (SPX)
Timeframe: 1D (1-Day)
Exchange: NYSE / NASDAQ Composite (tracked as index)
Date Range Displayed: Past 3–6 months (approx.)
Miss This Watchlist, Miss Next Week’s OpportunitiesHey friends,it’s Skeptic 🩵 hope you’re having a great weekend!I know it’s the weekend, so a lot of you are probably chilling away from the charts, but for some, trading’s such an addiction that even weekends can’t keep you away. In this video, I’m gonna break down my weekly watchlist for you. Knowing it will help you miss fewer good opportunities, avoid FOMO, and have a plan ready for different scenarios and events.
Don’t forget money management , and stay clear of FOMO. & if it helped smash that boost bottom and follow for more !

More upside for SPX500USDHi traders,
Last week SPX500USD made a small correction down (grey wave 4) and after it swept the dotted trendline it went up again. This could be the next impulse wave 5 (grey).
If this is true, then next week we could see more upside for this pair.
Let's see what the market does and react.
Trade idea: Wait for a small pullback and a change in orderflow to bullish on a lower timeframe to trade longs.
If you want to learn more about trading FVG's & liquidity sweeps with Wave analysis, then please make sure to follow me.
This shared post is only my point of view on what could be the next move in this pair based on my technical analysis.
Don't be emotional, just trade your plan!
Eduwave
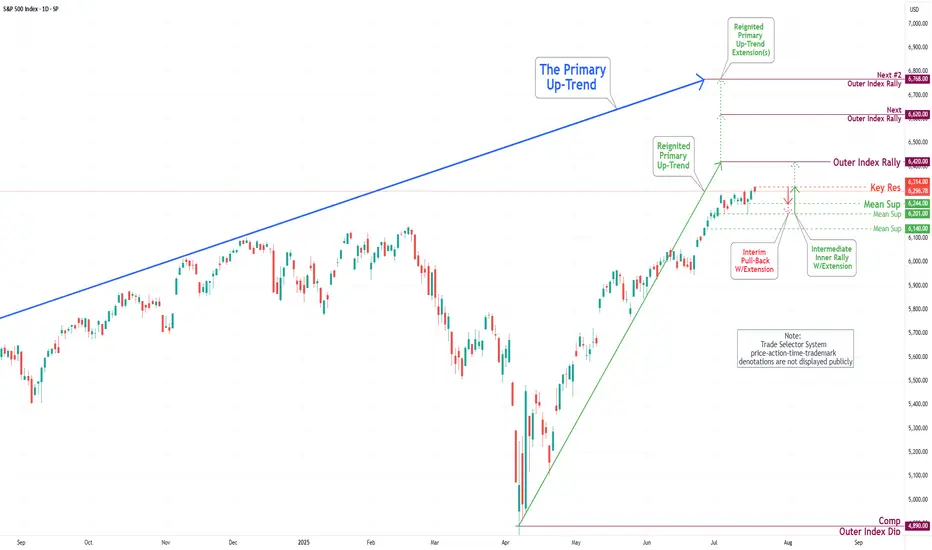
S&P 500 Daily Chart Analysis For Week of July 18, 2025Technical Analysis and Outlook:
During the current trading week, the S&P 500 Index has demonstrated a predominantly upward trajectory. It has successfully retested the Mean Support level at 6200 and established a new Key Resistance level at 6314. Currently, the index displays a bullish sentiment, with the objective for the Outer Index Rally set at 6420.
Nevertheless, it is essential to recognize that the current price action may result in a decline, potentially leading to a retest of the Mean Support at 6244 and extending to the Mean Support at 6201. Following this potential downward movement, it is anticipated that the index will resume its upward trend, driving the price action towards the Key Resistance level at 6314 and ultimately achieving the Outer Index Rally target of 6420.
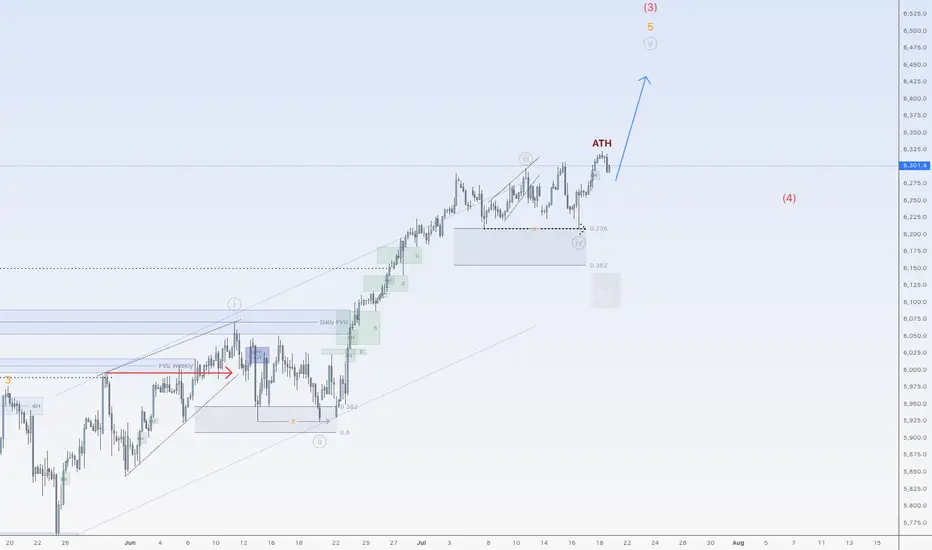
SPX500 in bullish impulseSPX500 currently at 3rd wave of wave (3) (both 2.618% extended). Expecting a retrace at 6517 region for wave 4.
3 month rally just not sustainable SPXThe economy is not doing horribly, but many are citing lagging indicators and there's signs of that this level is just not sustainable. Current levels abouve 9, 50, 200 SMAs! Seriously, what's great that isn't artificially propped up. Highest bankruptcies, highest level of housing unaffordability, dollar losing over 10% of value YTY, unemployment #s but that's bc people are giving up and it's a lagging indicator, hardship withdrawals up, defaults across the board up at over 10 year levels, banks with historic unrealized losses on their books (how much did Wells Fargo drop the other day!), yields going up up up. The Champage effect will end and many will get wiped out, unfortunately. Not being a dooms day person, but this economy is overheated and it's mostly driven by tech, which is over represented in the S&P. VIX is pretty low right now, would be an interesting play when it starts spiking (and it will!) when the deck starts falling apart.
Best of luck and always do your own due diligence.
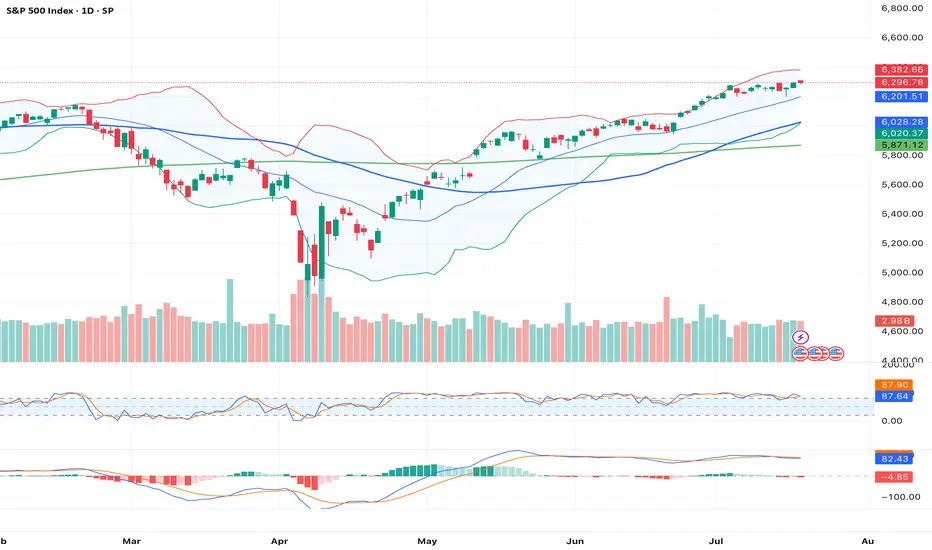
S&P overbought sideways consolidation supported at 6207 Fed Signals Rate Cut Ahead
US Federal Reserve Governor Christopher Waller called for a quarter-point interest rate cut this month, citing cooling inflation and minimal upside price risks. His dovish stance diverges from the broader FOMC consensus, which still views the labor market as resilient.
UK-Germany Defense Pact
UK PM Keir Starmer signaled potential alignment with Germany to purchase US weapons for Ukraine, following the signing of the “Kensington Treaty.” The accord emphasizes mutual defense cooperation, raising expectations of deeper UK involvement in European security initiatives.
Intel Concerns with Spain
US lawmakers raised concerns over intelligence sharing with Spain, due to the country's reliance on Huawei for its wiretap infrastructure, highlighting geopolitical tech tensions.
Trump Authorizes Epstein Testimony Release
President Donald Trump has authorized the release of grand jury testimony from the Epstein case, yielding to public and political pressure for greater transparency.
S&P 500 Outlook:
Waller’s call for a rate cut adds bullish momentum for equities, especially rate-sensitive sectors like tech and real estate. While geopolitical tensions and defense headlines introduce headline risk, the dovish Fed signal is likely to dominate sentiment in the near term. Expect S&P 500 support near 6207 with upside potential if more Fed officials echo Waller’s stance.
Key Support and Resistance Levels
Resistance Level 1: 6336
Resistance Level 2: 6383
Resistance Level 3: 6420
Support Level 1: 6207
Support Level 2: 6160
Support Level 3: 6113
This communication is for informational purposes only and should not be viewed as any form of recommendation as to a particular course of action or as investment advice. It is not intended as an offer or solicitation for the purchase or sale of any financial instrument or as an official confirmation of any transaction. Opinions, estimates and assumptions expressed herein are made as of the date of this communication and are subject to change without notice. This communication has been prepared based upon information, including market prices, data and other information, believed to be reliable; however, Trade Nation does not warrant its completeness or accuracy. All market prices and market data contained in or attached to this communication are indicative and subject to change without notice.
