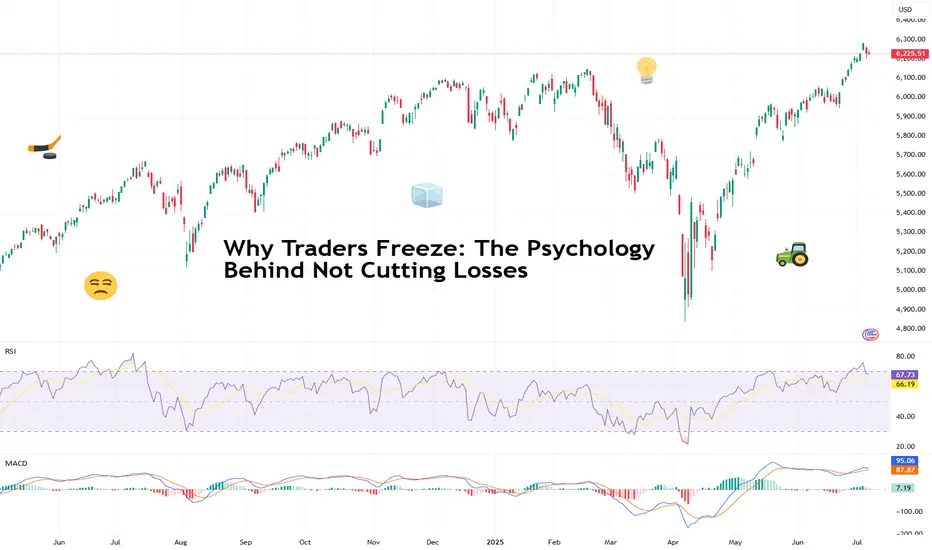
Why Traders Freeze: The Psychology Behind Not Cutting LossesFirst up: let’s address the elephant in the room. Loss aversion — that great human flaw. From the moment your ancient ancestor decided to poke a saber-toothed tiger to see what happens, the brain has been hard-coded to avoid pain at all costs.
Loss aversion is literally in your DNA — studies show people feel the sting of a loss twice as intensely as the pleasure of an equivalent gain.
When you see that trade slip into the red, your rational brain may say, “Cut it, the setup is invalid, live to trade another day.” But your emotional brain — the one still grunting in a cave — is screaming, “It might come back! Hold! HOOOLD!” So you sit, frozen.
🌱 Hope: The Most Expensive Four-Letter Word
Hope is the silent killer of trading accounts. You think you’re being patient as you decide to give the trade “room to breathe.”
But what you’re really doing is outsourcing your exit strategy to technical tools, news headlines, and anything that’s not your own choice, hoping something will rescue your losing position.
This is how tiny losses can turn into portfolio ruin. Just ask anyone who’s held a small-cap memecoin down 90% because the “team has potential.”
🧊 Analysis Paralysis: When the Chart Becomes a Maze
Another reason traders freeze? Overanalysis. One bad candle and suddenly you’re toggling between the 1-minute, 5-minute, and daily chart like you’re hacking into the Pentagon. And your trendlines? You’re probably drawing them wrong .
More data rarely leads to more decisive action. It just feeds your brain conflicting signals until you’re convinced you see a bounce that isn’t there. Meanwhile, the loss grows. And grows. And then you’re back to hope. Rinse, repeat.
😬 The Ego Monster: Admitting You’re Wrong
Here’s the harsh truth: cutting a loss means admitting you were wrong. For traders, whose entire identity can hinge on being “smart money,” that feels like public humiliation. The ego monster wants you to be right more than it wants you to be profitable.
So instead of taking the small L, you’ll cling to the trade because closing it out would force you to look in the mirror and say, “I was wrong and I need to do better.”
🏴☠️ From Risk Management to Revenge Trading
Once you’ve frozen long enough, you reach the next stage of the bad-losing cycle: revenge trading . Now you’re not just trying to recover your loss; you’re out to punish the market for “taking” your money.
Spoiler alert: the market doesn’t know you exist, and it certainly doesn’t care. Maybe this is the gambler’s mindset disguised as a “strategy?”
📉 Blame the Tools? Not So Fast
Some traders love to blame outside factors like the Economic calendar or their indicators when they freeze. “My RSI didn’t signal this! The MACD betrayed me!” Indicators are just tools — they don’t make decisions for you. You do.
Hiding behind tools means you refuse to take accountability. It’s a convenient excuse that can keep you stuck in the same losing habits. Better to master the one tool that matters: your discipline .
✂️ The Beauty of the Hard Stop
All hail the hard stop — the trader’s seatbelt. It’s not attractive, it’s mechanical, but it’s often the only thing standing between you and a potentially blown-up account.
The reason some traders can survive the market for decades isn’t because they’re never wrong — it’s because they’ve learned to make their stops non-negotiable.
A stop-loss is you telling your brain, “Hey, I’m not smarter than the market, so I’ll automate the decision before I get emotional.” It takes the agony out of cutting a loss because you’ve already decided on the outcome before your lizard brain can intervene.
⚖️ Small Losses Are the Cost of Doing Business
Want to feel better about cutting that loss? Think of it as your tuition fee. Every trader pays a certain cost to the market — it’s the cost of playing the game. No one gets every trade right. The pros just get better at losing small.
Those big-shot money spinners you look up to? They didn’t build their empire by never losing. They’re pros at getting out when they’re wrong. The difference between a pro and a blow-up isn’t the winning trade — it’s the ruthless discipline on the losing ones.
🧘♂️ Finding Comfort in Discomfort
There’s no magic trick to make loss-cutting feel good. It always stings. But you can train your brain to see a small loss as a win for your long-term survival. Write it down. Journal the trade . Log the emotion. Over time you’ll realize that the trades you exit early rarely haunt you.
🏁 Face the Fear, Keep the Account
And finally, freezing in front of a loss doesn’t protect you — it likely means you’ll pay more than you should. Next time your gut says, “Maybe it’ll come back…” ask yourself: “Do I want to be right, or do I want to trade another day?”
Your job is to trade well and stay in the game for as long as possible.
Your turn, traders : what’s your biggest “should’ve cut it sooner” horror story? Drop it below — we promise not to say we told you so.
USA500 trade ideas
SPX500 Formed false breakout Bearish Bias 6,205 SP500 Short-Term Bearish Bias
The SPX500 remains under pressure as it trades below the key resistance level of 6260. Price action suggests a potential rejection from this resistance, signalling a continuation of downside momentum.
This bearish sentiment is further fuelled by recent tariff escalations by President Trump, which are weighing heavily on investor sentiment across global indices.
You can see more details in the chart Ps Support with like and comments for more analysis Thanks for supporting.

S&P500 (CASh500) Short - double top 15minEntry = 6303.4
SL = 6312.8
Take profit level 1 = 6280.7
Take profit level 2 = 6271.6
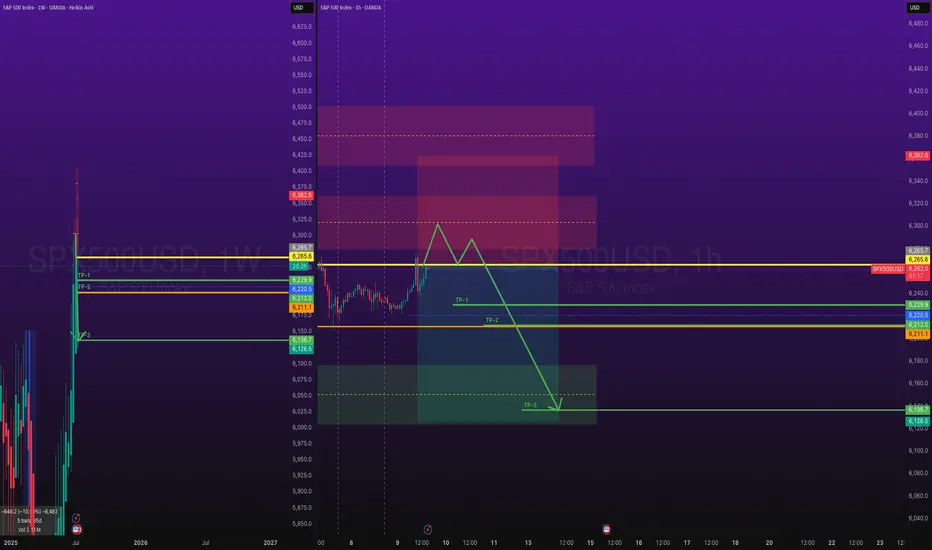
X1: SPX500/US500 Short Trade Risking 1% to make 1.35%FOREXCOM:SPX500 / CAPITALCOM:US500 Short for week, with my back testing of this strategy, it hits multiple possible take profits, manage your position accordingly.
Risking 1% to make 1.35%
Note: Manage your risk yourself, its risky trade, see how much your can risk yourself on this trade.
TP-1 is high probability TP but don't overload your risk like greedy, be disciplined trader.
Use proper risk management
Looks like good trade.
Lets monitor.
Use proper risk management.
Disclaimer: only idea, not advice
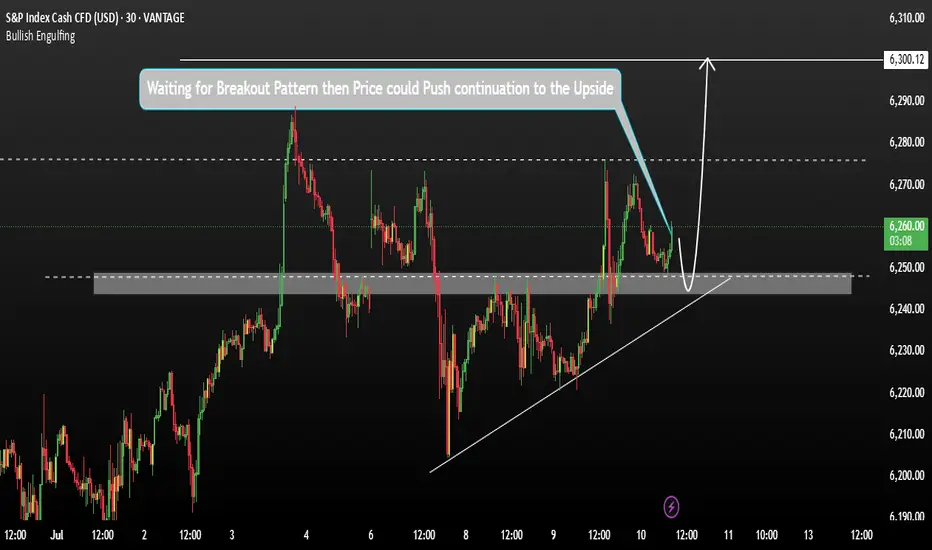
SP500 Bullish Momentum Amid Trade DevelopmentsThe US stock index continues to trade higher as overall market sentiment remains bullish, driven by optimism despite Donald Trump's aggressive tariff stance and ongoing global trade negotiations.
Currently, the index is consolidating within a narrow range around 6260. A confirmed breakout from this zone is essential to determine the next directional move. then Upside Target will be :6,250 and 6,300
If you like this idea if you Have on Opinion about this analysis share in comments.
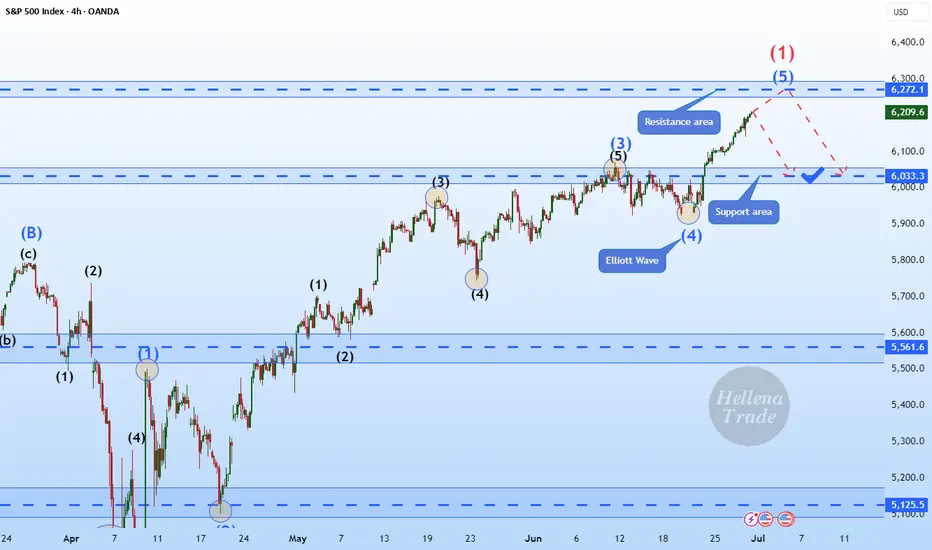
Hellena | SPX500 (4H): SHORT to support area of 6033.Colleagues, I assume that wave “1” completes the upward movement and somewhere around here a major correction ‘2’ should begin, which will consist of waves “ABC” and may continue to the level of 5700. But for now, I think we need to focus on the nearest targets.
I see the support area of 6033 as the first target.
Manage your capital correctly and competently! Only enter trades based on reliable patterns!
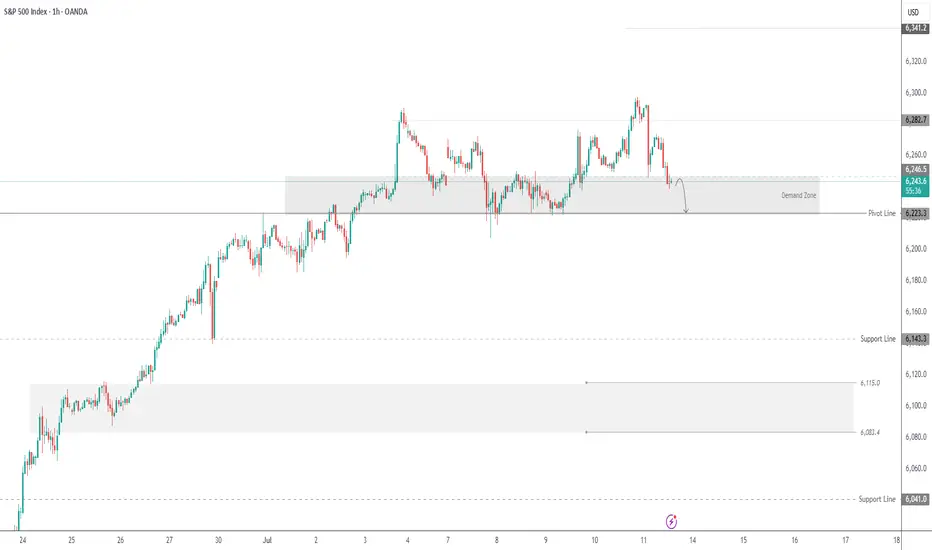
SPX500 Bearish Below 6246 – Eyes 6223 and 6195SPX500 Analysis
SPX500 stays under bearish pressure below 6246, targeting 6223 and possibly 6195 if the decline continues.
Recent tariff escalation by President Trump is adding weight to downside momentum across indices.
Pivot: 6246
Support: 6223, 6195, 6143
Resistance: 6268, 6291
Let’s talk about technical analysis & stops.Technical analysis is not your decision-making process — it’s a tool to help you structure better trading decisions by studying past price movements to anticipate likely future moves.
👉 Every time you look at a chart, you should decide:
✅ Do I want to trade at all?
✅ What’s my entry?
✅ Where’s my stop (when does my thesis fail)?
✅ What’s my target (where will I take profits)?
________________________________________
🛑 Where to put your stop?
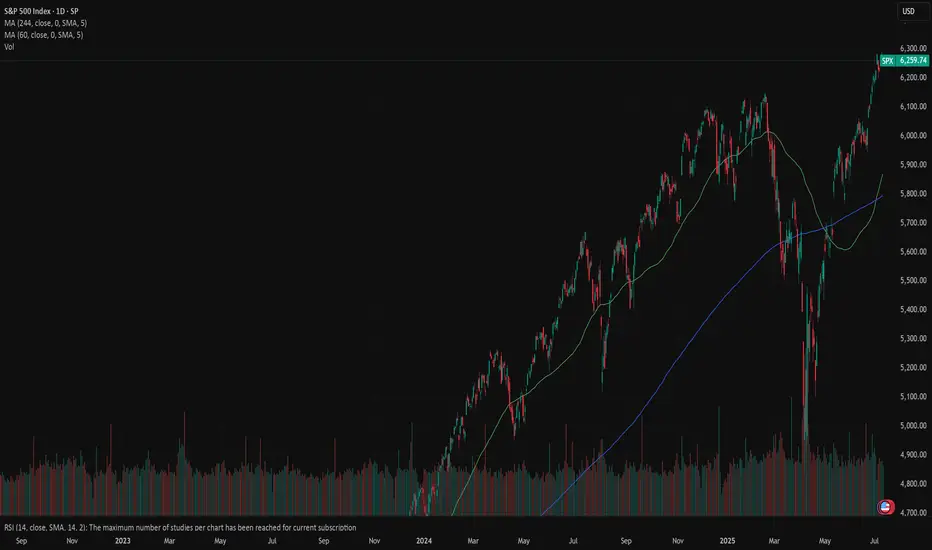
Take the S&P 500 daily chart. It’s been trending up strongly. Many traders use an exponential moving average (EMA) as a dynamic stop.
But:
• A 9 EMA often stops you out too early on strong trends.
• Adjusting to a 15 or 16 EMA could keep you in the trade longer, letting your winners run.
In tools like TradingView, you can visually adjust the EMA and see in real time how it would have kept you in or taken you out.
________________________________________
💡 Key takeaway:
When price closes below your EMA stop — that’s your signal to exit and lock in profits.
Use TA to structure your trades, not just spot pretty patterns.
________________________________________
💬 What’s your favourite method for setting stops?
Disclaimer:
The information posted on Trading View is for informative purposes and is not intended to constitute advice in any form, including but not limited to investment, accounting, tax, legal or regulatory advice. The information therefore has no regard to the specific investment objectives, financial situation or particular needs of any specific recipient. Opinions expressed are our current opinions as of the date appearing on Trading View only. All illustrations, forecasts or hypothetical data are for illustrative purposes only. The Society of Technical Analysts Ltd does not make representation that the information provided is appropriate for use in all jurisdictions or by all Investors or other potential Investors. Parties are therefore responsible for compliance with applicable local laws and regulations. The Society of Technical Analysts will not be held liable for any loss or damage resulting directly or indirectly from the use of any information on this site.

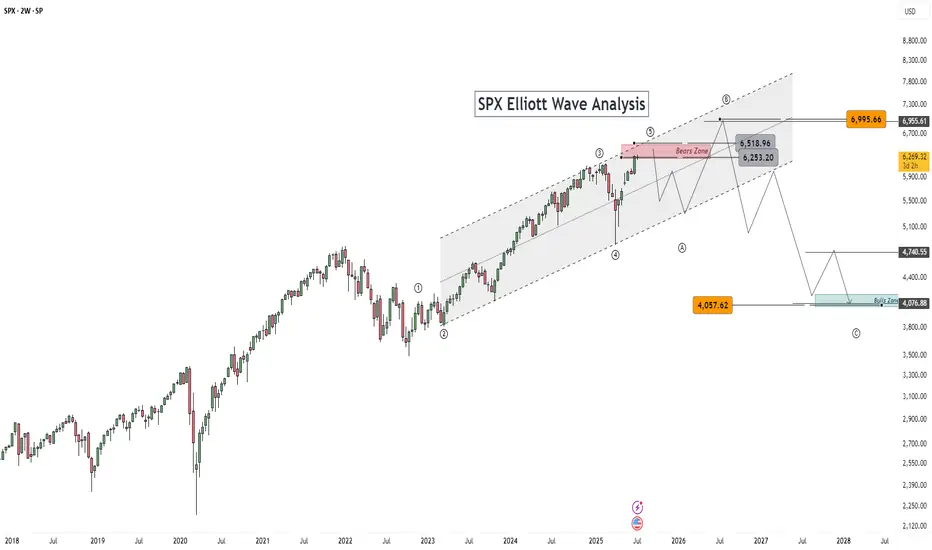
This is just my Elliott Wave Analysis not financial Advice. $SPThis is just my Elliott Wave Analysis not financial Advice. SP:SPX #SPX SP:SPX
20% in 60 daysSince the 90's we have seen many times where the broader market (SPX) has seen a pretty significant pull back, more than 10% and then a rally. Almost every time the market rose more than 20% in 60 days or less has been a good place to take profits. Clearly everything is super bullish right now, and I am not saying this will be the top, I am simply saying, we could experience a correction driven by profit taking. In an uptrend, you want to be a buyer on pull backs, so a pull back could give us another longer term opportunity
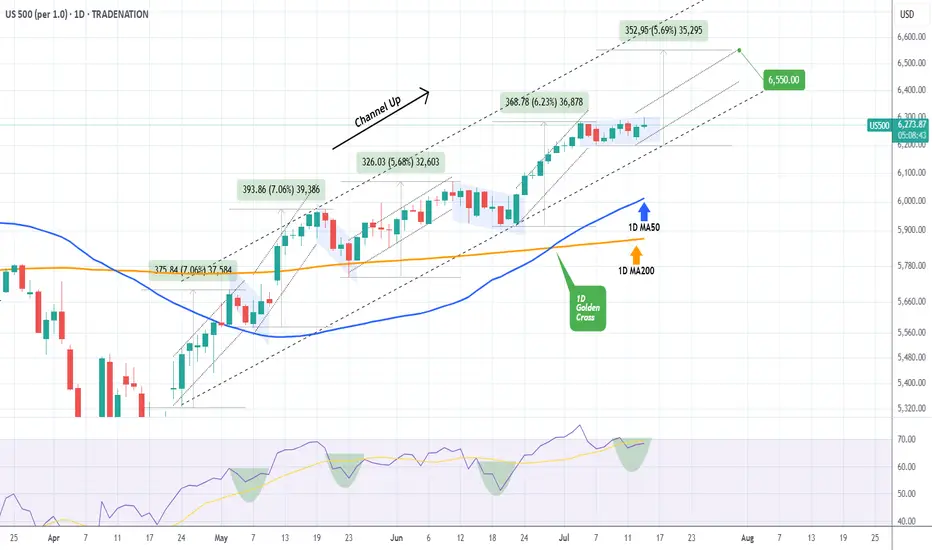
S&P500 Accumulation almost over. New rally begins.The S&P500 index (SPX) has been trading within a 3-month Channel Up pattern, within which, it's been replicating almost the same structure. This involves an aggressive Bullish Leg Phase (dotted Channel Up), followed by a correction/ Accumulation Phase (blue Channels), which eventually leads to the new Bullish Leg.
The 1D RSI fractals among those patterns are similar and right now it seems that we are about to complete the latest Accumulation Phase. Having completed a 1D Golden Cross 2 weeks ago, the time-frame looks more bullish than ever and as long as the 1D MA50 (blue trend-line) holds, we expect at least a +5.68% rise (the minimum of the previous Bullish Legs), targeting 6550.
-------------------------------------------------------------------------------
** Please LIKE 👍, FOLLOW ✅, SHARE 🙌 and COMMENT ✍ if you enjoy this idea! Also share your ideas and charts in the comments section below! This is best way to keep it relevant, support us, keep the content here free and allow the idea to reach as many people as possible. **
-------------------------------------------------------------------------------
Disclosure: I am part of Trade Nation's Influencer program and receive a monthly fee for using their TradingView charts in my analysis.
💸💸💸💸💸💸
👇 👇 👇 👇 👇 👇
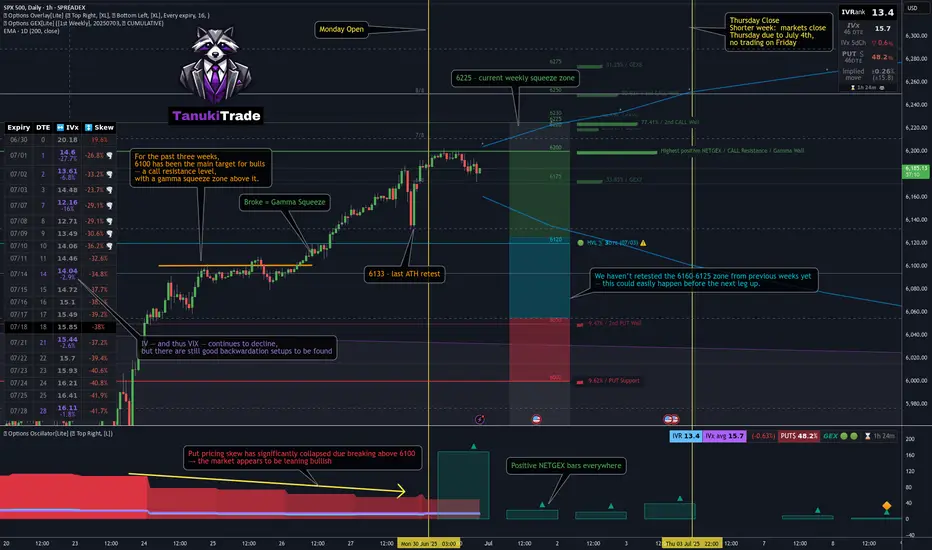
06/30 Weekly Gamma Exposure Outlook🧠 SPX Weekly Outlook — Gamma Breakout + Short Week Setup
The bulls finally broke through after weeks of painful grinding — and they did so with force.
📈 Thursday & Friday brought a textbook gamma squeeze as SPX sliced through the long-standing 6100 call wall , triggering sharp upside acceleration.
We are now firmly in positive Net GEX territory.
🔺 Entire GEX structure has shifted higher.
🎯 New squeeze zone at 6225 , with major call resistance near 6200 .
🔍 What Just Happened?
📊 The 6060–6120 zone acted as a tough resistance range for weeks — until last week’s breakout.
💥 Put skew collapsed , suggesting downside hedges are being unwound.
📉 VIX and IV keep dropping , confirming a shift toward lower-volatility environment .
🧲 Strong Net GEX across expiries created sustained upward dealer pressure → we’re in long gamma mode .
✅ Bullish Bias — But Stay Tactical
We're in a bullish gamma regime , so dips are likely to be bought.
Key pullback zone to watch: 6125–6060 .
🛠️ Strategy Ideas:
• Wait for a 6060–6125 retest before re-entering longs
• Use shorter-DTE bull put spreads or 0DTE gamma scalps above 6130+
• Scale out or trim risk near 6200–6225
⚠️ Risks to Watch
We’re overextended short-term.
🚨 Losing 6130–6125 could spark a quick flush to 6050 .
Bearish signals to monitor:
• IV spike or renewed put buying
• Loss of 6100 = no-man’s land without confirmation
• Consider short-term debit put spreads if breakdown confirms
🗓️ Short Trading Week Note
🇺🇸 U.S. markets closed Friday, July 5 for Independence Day.
This compresses flows into 4 sessions. Expect:
📌 Early week dealer hedging
📌 Possible positioning unwind on Thursday
💡 Weekly Trade Idea — Structure in Place
💼 Setup:
• Put Butterfly below spot
• 3x Call Diagonal Spreads above spot (5pt wide)
• Slight net negative delta , 11 DTE
🎯 Why it works:
• Leverages IV backwardation
• Profits from time decay
• Favors a stable or modestly bullish week
• Takes advantage of horizontal skew (July 11 vs July 14)
💰 Profit Target: 10–20% return on ~$1,730 risk.
Take profits before time decay kills the center valley — don’t overstay. 🏃💨
📌 Final Thoughts:
The 6100 breakout was technically & gamma-structurally significant ,
but big moves often retest before continuing.
Let price breathe.
Stay aligned with gamma exposure profile. 🔄
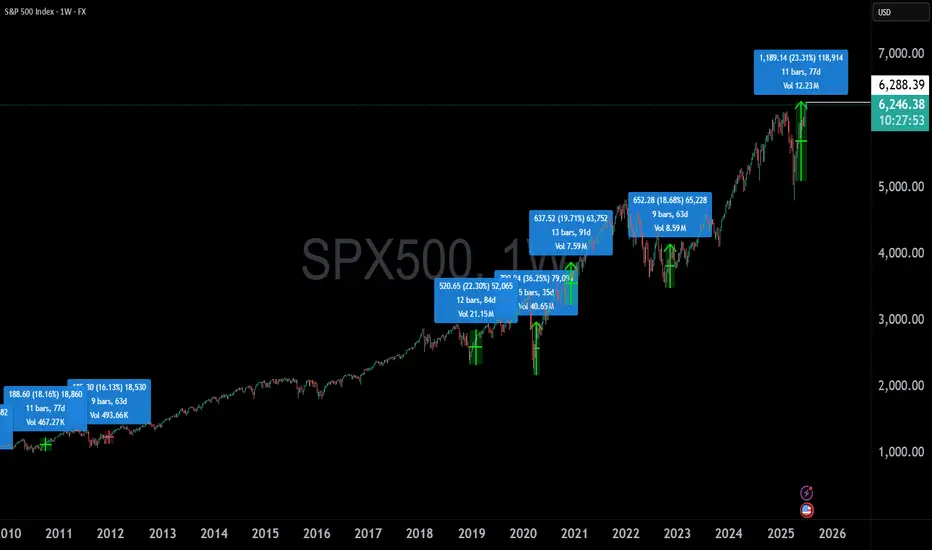
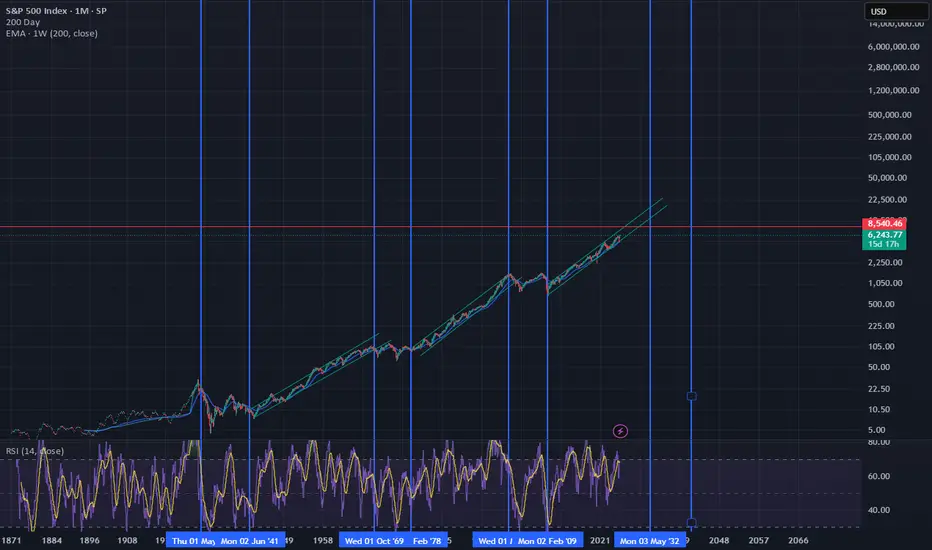
IS THE STOCK MARKET HEADING INTO DOT COM BUBBLE 2.0?In this video we look at the 3 month chart of SP:SPX using the traders dynamic index & Fibonacci retracement levels to put together a bullish case for the overall stock market to go on a monster rally over the next 7 years
We also theorize about how over the next 2 years the SP:SPX can indeed hit 7200+ by Q3 2026 and have pullbacks to 5800-6100, but how that could just be the "consolidation move in price" of the overall stock market before we get what could end up being the largest stock market rally we have ever seen in the 21st century

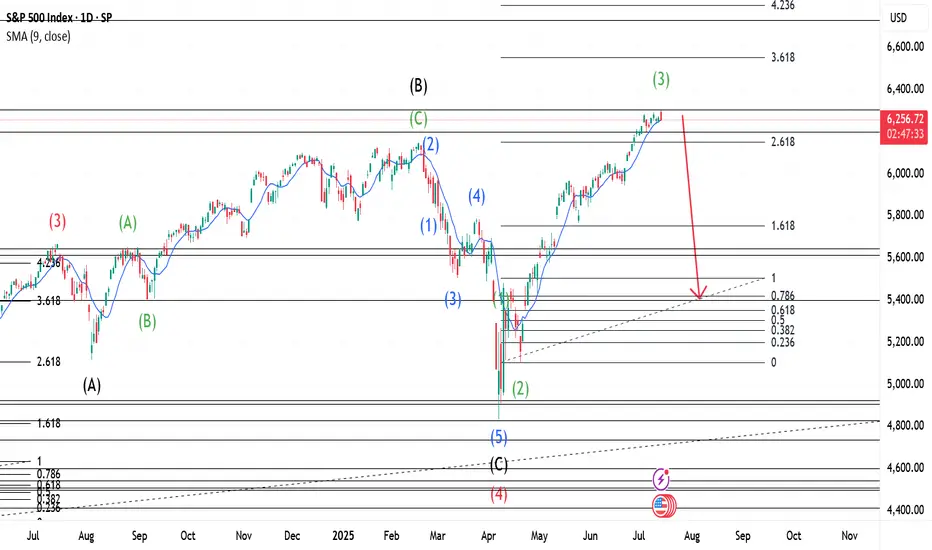
S&P 500 and the Elliott Wave TheoryThis is a continuation of a Weekly chart that I had previously posted. Our Wave 2(Red) was a Zigzag and the expectation is a Flat for Wave 4(Red) which we see occurred. Since Wave 4(Red) completed, a Wave 5(Red) was triggered. We can expect our Wave 5 to express itself in 5 Waves just like any other Wave. We can observe that our Wave 2(Green) was a Flat and we can expect our Wave 4(Green) to be a Zigzag. Wave 3(Green) was a strong upward move and a confirmation at its current price would trigger a Zigzag correction. This would be our Wave 4(Green) and would set the stage for the last wave before a major correction.

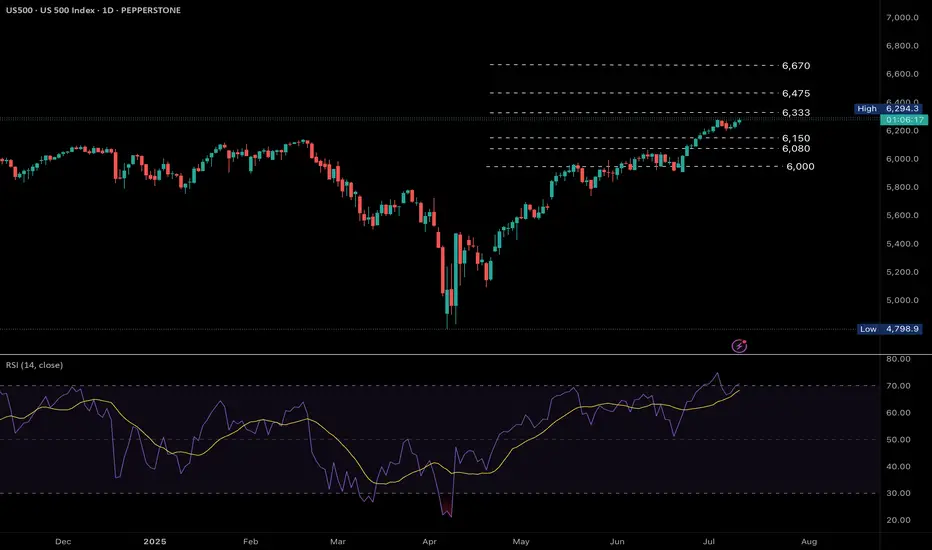
US500 trending higher as the US earnings season gains momentum. Fundamental
US500 is pushing higher as the US 2nd quarter earnings season gains momentum under President Trump's second administration amidst tariffs. Big tech earnings will have a significant impact on the index price action.
Technical
Bullish momentum is gaining as the uptrend remains strong. The RSI is approaching the overbought region however a break above the 6,333 key resistance level sees the index trading at all time highs with resistance levels at 6,475 and 6,670. A move below 6,230 sees a possible move towards supports at 6,150, 6,080 and subsequently 6,000.
by Terence Hove, Senior Financial Markets Strategist at Exness
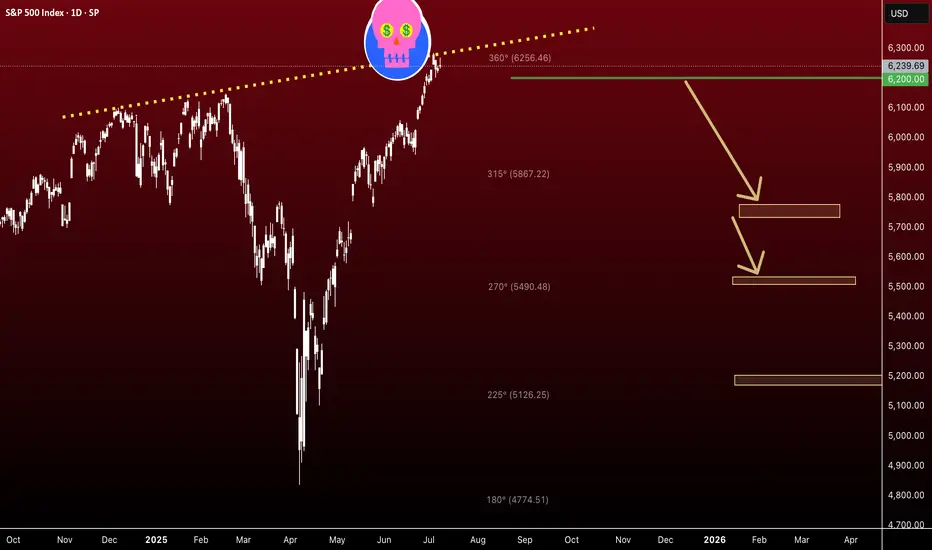
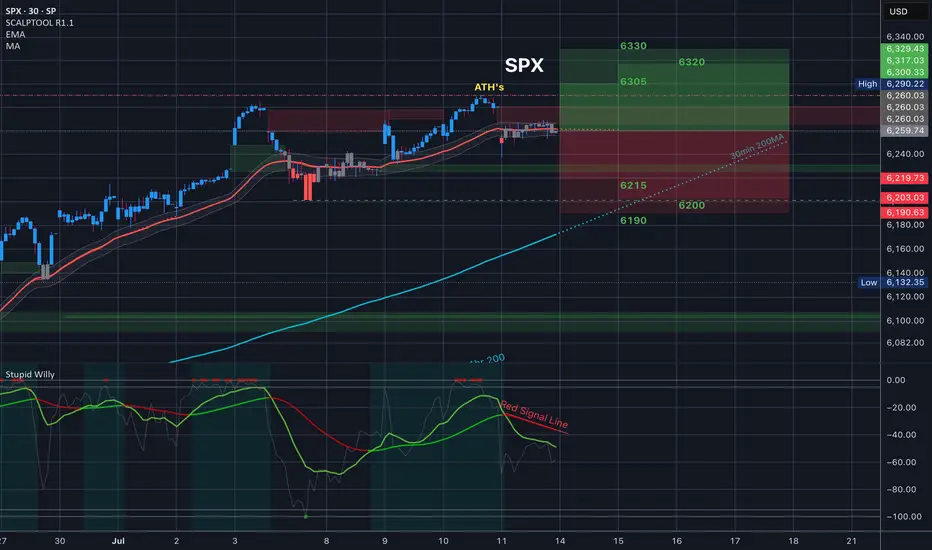
S&P 500 Technical Analysis – Potential Correction AheadThe S&P 500 is approaching critical historical resistance levels, just as economic headwinds begin to resurface — particularly the expiration of tariff ceasefire agreements and renewed trade tensions. These overlapping factors could signal an upcoming technical correction.
🔹 From a technical standpoint:
The index is forming a classic multiple-top pattern, typically associated with weakening bullish momentum and potential trend reversals.
However, we remain cautious and will only consider a bearish scenario if the 6200 support level is broken on a daily close.
📉 Proposed Trading Plan:
• Short entry: Only if the daily close is below 6200
• Stop-loss: Daily close above the last top
• Targets in order:
• 5800
• 5500
• 5250
⚠️ Note: Despite the bearish setup, we do not recommend rushing into selling without confirmation of support break.
A steady move up for the next 3 yearsYou can clearly see the pattern. The boom/bust cycle, and inflation. Don't expect my lines to be exact. Imagine bitcoin if we hit the upper trend line.
Bullish for the next 3-5 years and another crisis. (2030)
They should teach this in school.
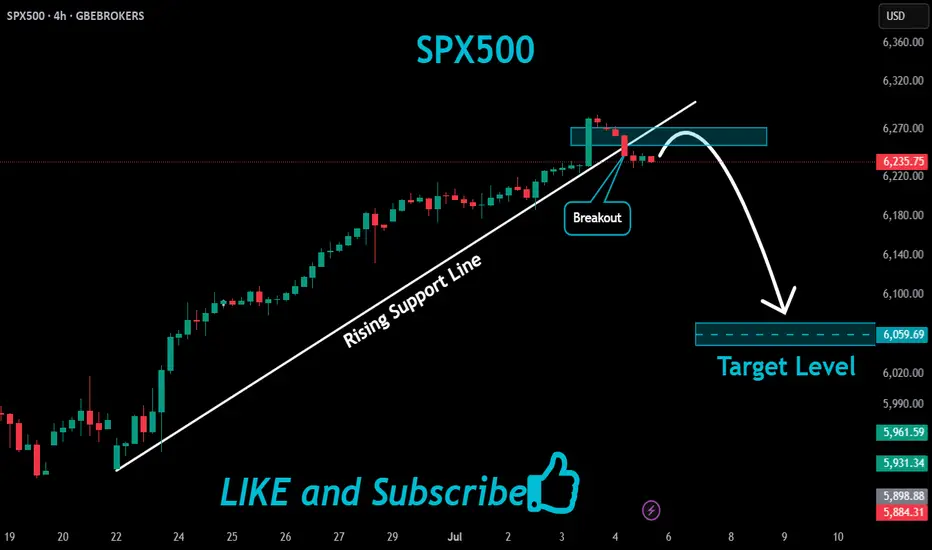
SPX500 Bearish Breakout!
HI,Traders !
#SPX500 was trading along
The rising support line but
Now we are seeing a bearish
Breakout so we are bearish
Biased and we will be expecting
A further bearish move down !
Comment and subscribe to help us grow !
SPX: earnings sentiment aheadPrevious week was another optimistic week on financial markets. Regarding the approaching deadline for a delay in the application of trade tariffs set by the US Administration, which came due on July 9th, the market did not show much of a concern. The green trend line of the S&P 500 continued during the week, where the index managed to reach another new all time highest level on Thursday, at 6.290. During the previous week there has not been any currently important US macro data posted, in which sense, the market sentiment remained optimistic. However, Friday's news regarding trade tariffs spoiled a bit of an up-trend, so the index ended the week, just a bit lower from its ATH level, at 6.259.
Weekly tariffs news include a 35% imposed tariffs on imports from Canada, and 50% on goods imported from Brazil in the U.S. There are also some comments on a potential increased universal 10% tariff on the majority of other nations, noting 15% and 20%, as well as a 50% tariff on copper. Analysts are noting that the market is already adjusted to the comments regarding trade tariffs, in which sense, there are no more strong market reactions on any incoming news.
The week ahead brings some important US macro data, as well as gearing up for the earnings season, starting with major banks like JPMorgan. The June inflation data as well as PPI will be posted in the week ahead, closing with University of Michigan Consumer Sentiment. This data might bring back some volatility to the S&P 500, however, the general investors sentiment remains positive at this moment.
$SPX Tomorrow’s Trading Range and everything in it /// 7.14.25Tomorrow’s Trading range and everything in it. How are you playing it?
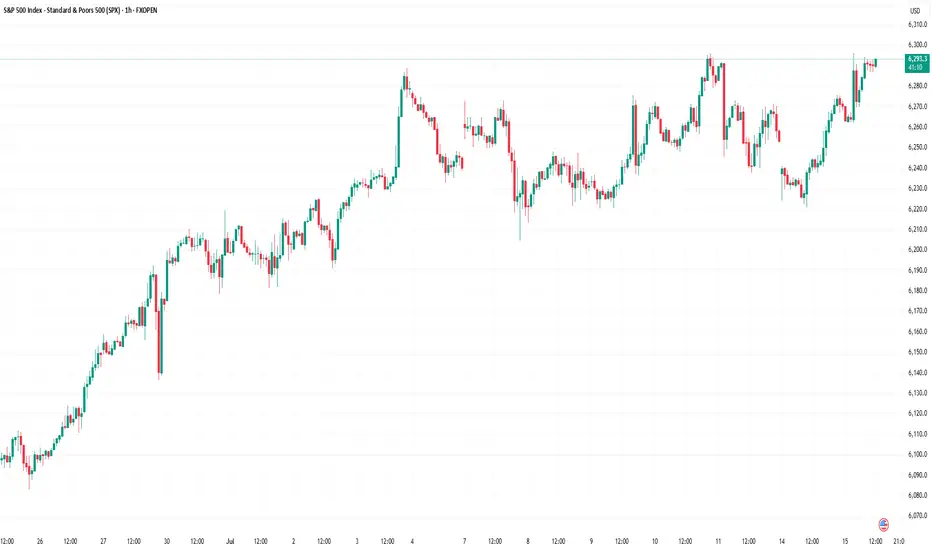
Equity Markets Ahead of the US Inflation ReportEquity Markets Ahead of the US Inflation Report
Today at 15:30 GMT+3, the US inflation report (Consumer Price Index, or CPI) is scheduled for release. According to ForexFactory, analysts expect the inflation rate to rise from 2.4% to 2.6%.
The actual figures will provide market participants with grounds to debate not only the likelihood of a Federal Reserve rate cut, but also the evolving tensions between Donald Trump and Jerome Powell.
Should the report deliver any surprises, it will almost certainly trigger heightened volatility across the equity markets. For now, however, investors are seemingly optimistic about the upcoming fundamental data — especially given the commencement of Q2 earnings season, which lends additional weight to today’s macroeconomic indicators.
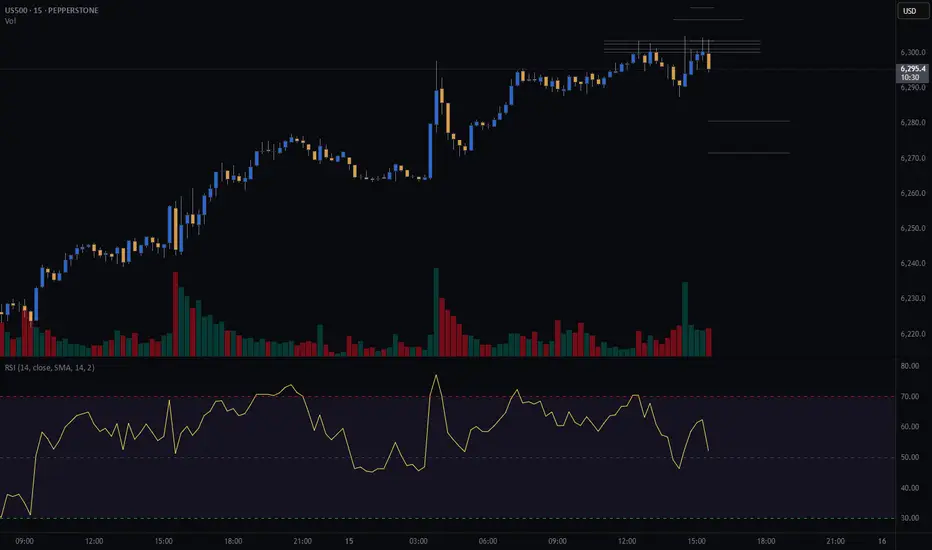
Technical Analysis of the S&P 500 Chart
The S&P 500 chart (US SPX 500 mini on FXOpen) shows the index fluctuating within a range defined by support at 6,222 and resistance at 6,290.
The upward impulses (as indicated by arrows) suggest that:
→ current market optimism, combined with the CPI release, may lead to a bullish breakout above resistance and the establishment of a new all-time high;
→ in a broader context, such a breakout could be interpreted as a continuation of the rally that began in April, following a period of consolidation between the aforementioned levels.
This article represents the opinion of the Companies operating under the FXOpen brand only. It is not to be construed as an offer, solicitation, or recommendation with respect to products and services provided by the Companies operating under the FXOpen brand, nor is it to be considered financial advice.
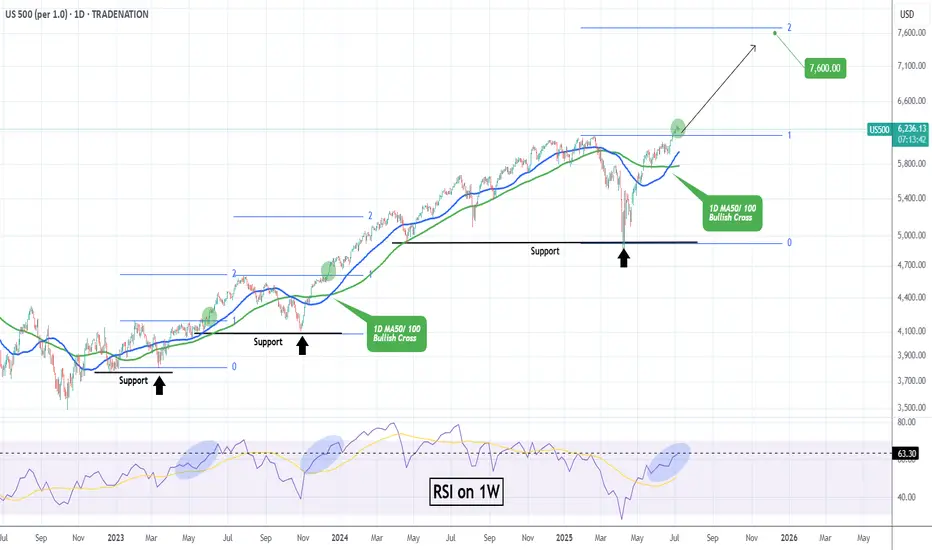
S&P500 Strong Buy Signal flashed for the 3rd time in 2 years!The S&500 index (SPX) is comfortably trading above its previous All Time High (ATH) and shows no signs of stopping here. Coming off a 1D MA50/ 100 Bullish Cross, we expect the 1D MA50 (blue trend-line) to turn now into the first long-term Support going towards the end of the year.
The last 1D MA50/ 100 Bullish Cross (December 15 2023) was nothing but a bullish continuation signal, which extended the uptrend all the way to the 2.0 Fibonacci extension, before a pull-back test of the 1D MA100 (green trend-line) again.
The 1W RSI is now on the same level (63.30) it was then. In fact it is also on the same level it was on June 05 2023, which was another such bullish continuation signal that peaked on the 2.0 Fib ext.
This suggests that we have a rare long-term Buy Signal in our hands, only the 3rd time in 2 years that has emerged. Based on that, we should be expecting to see 7600 as the next Target before it hits the 2.0 Fib ext and pulls back to the 1D MA100 again and there is certainly enough time to do this by the end of the year, assuming the macroeconomic environment favors (trade deals, potential Fed Rate cuts etc).
-------------------------------------------------------------------------------
** Please LIKE 👍, FOLLOW ✅, SHARE 🙌 and COMMENT ✍ if you enjoy this idea! Also share your ideas and charts in the comments section below! This is best way to keep it relevant, support us, keep the content here free and allow the idea to reach as many people as possible. **
-------------------------------------------------------------------------------
Disclosure: I am part of Trade Nation's Influencer program and receive a monthly fee for using their TradingView charts in my analysis.
💸💸💸💸💸💸
👇 👇 👇 👇 👇 👇