SPX possible B wave almost finishedmarket goes higher but I still think a larger correction down is coming. Gold is sideways still. OIl rejected from 68.50- so far. NG looks like it may go a bit higher. BTC is at the top of it's range.
USA500 trade ideas

SPX500 Eyes New ATH – Key Levels in PlaySPX500 – Overview
The index remains under bullish pressure, with potential to record a new all-time high (ATH).
As long as the price holds above 6246, the bullish trend is likely to continue toward 6282.
A confirmed 1H close above 6287 could trigger further upside toward 6310 and 6341.
However, a break below 6223 would signal bearish momentum, opening the path toward 6195 and 6143.
Pivot Line: 6282
Resistance: 6310, 6341
Support: 6246, 6223, 6195
ASCENDING WEDGE ON WATCH - ELLIOTT WAVE 3 NEARLY COMPLETEThe WAVE 3 extension can go further but it seems likely that coinciding with earnings this month we will have the potential for the start of WAVE 4 retracement.
The possible resignation of Jerome Powell could further intensify the charts.
AlphaTrend is an advanced trading indicator that leverages proprietary tools, real-time data, and custom metrics to give traders a competitive edge. Designed for all experience levels, it works instantly—no advanced charting skills required.
ADVANCED and PRO versions are available. (See below)
🔍 How It Works
At the core of AlphaTrend is Dynamic Reversion Bands — a sophisticated real-time system that adapts to price action by automatically adjusting to evolving market conditions.
These bands act like a roadmap, helping traders identify:
Mean reversion trade opportunities
Trend strength
Emotion-driven market conditions (like FOMO)
The system is rooted in Mean Reversion Theory:
If an asset's price deviates significantly from its historical average, it tends to “revert” back to that average over time. Traders can use this behavior to spot potential buying or selling opportunities:
Overbought Conditions: If the price moves too far above the mean, it may signal a pullback—traders might sell or short.
Oversold Conditions: If the price drops well below the mean, it may be undervalued—traders might buy in anticipation of a bounce.
⚪🟡🔴🟡⚪ Dynamic DOTS
AlphaTrend visualizes market overextension through dynamic DOTS:
White DOTS = Average conditions
Yellow DOTS = Above average conditions
Red DOTS = Extreme conditions
The DOTS update in real time as the candle is forming—appearing, disappearing, and shifting color based on current intensity levels. Once the candle closes, however, the DOTS do not repaint. This ensures clarity and confidence in every signal.
This is crucial, as many indicators repaint and revise data after the fact, undermining traders’ trust. With AlphaTrend, once a candle closes, the data remains permanently fixed.
📊 Adaptability and Market Insight
AlphaTrend adapts to any timeframe, but performs best on longer-duration candles, where signals are fewer but more reliable. Multi-interval displays (e.g., 1hr, 4hr, Daily) are highly recommended. That being said it does tend to give strong signals on all time frames even down to 1 min candles.
S&P 500 (CASH500) Short - Head and shoulders H1Potential short on S&P 500.
Risk/reward = 3.4
Entry = 6264.9
Stop loss = 6280.3
TP level 1 = 6221.7 (50%)
TP level 2 = 6200.5 (50%)
Need current candle to close back in range at 10.00 for all variables to be met.
Volume exception applied since current candle is the open of European markets.
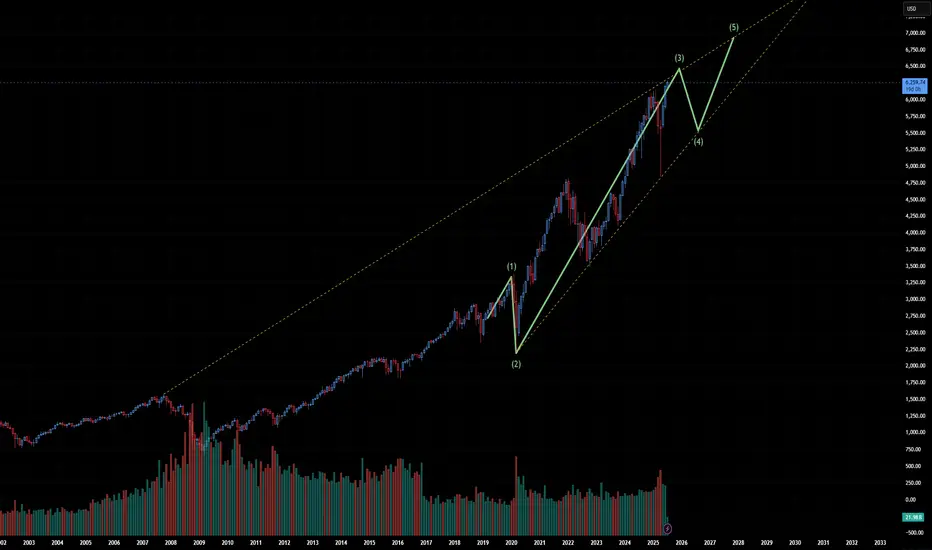
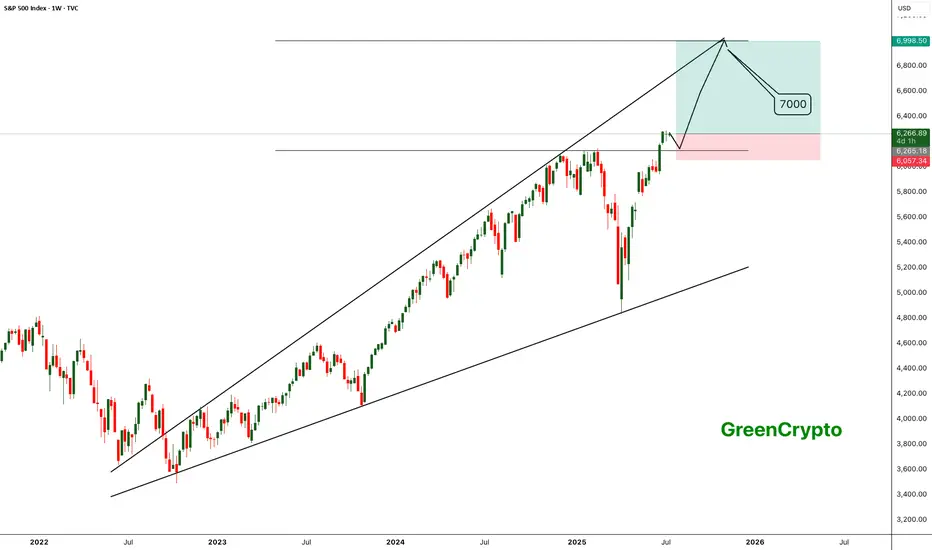
SPX - Next Target is 7000- SPX is currently trading around 6200 after breakout previous all time high.
- Price has formed a nice broadening wedge pattern and currently heading towards the next resistance line.
- We can expect a slight correction upt o 6100, and reversal towards 7000.
- I'm expecting SPX to hit 7000 target by Q1 of 2026.
Trade Opportunity
Entry: 6200
TP1: 6400
TP2: 6600
TP3: 6800
TP4: 7000
SL at: 6057
Stay tuned frequent updates
Cheers
GreenCrypto
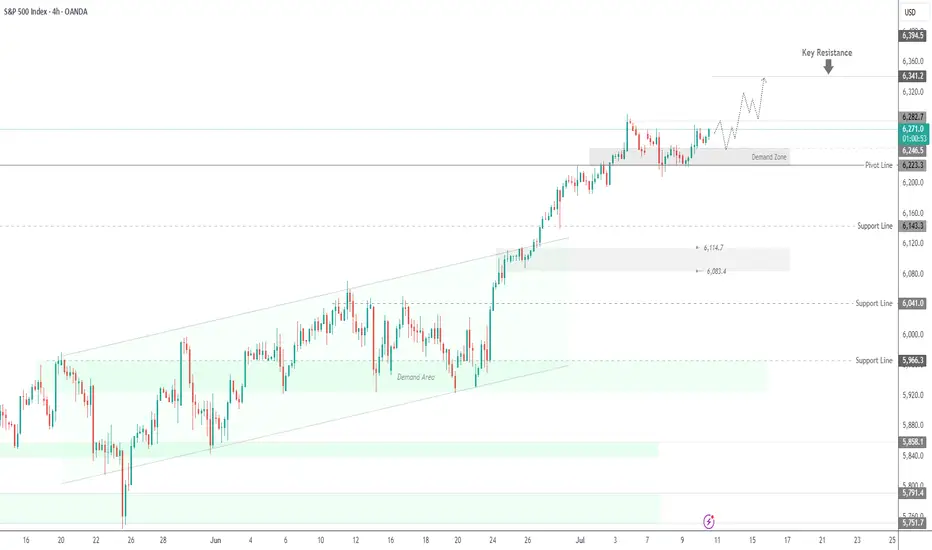
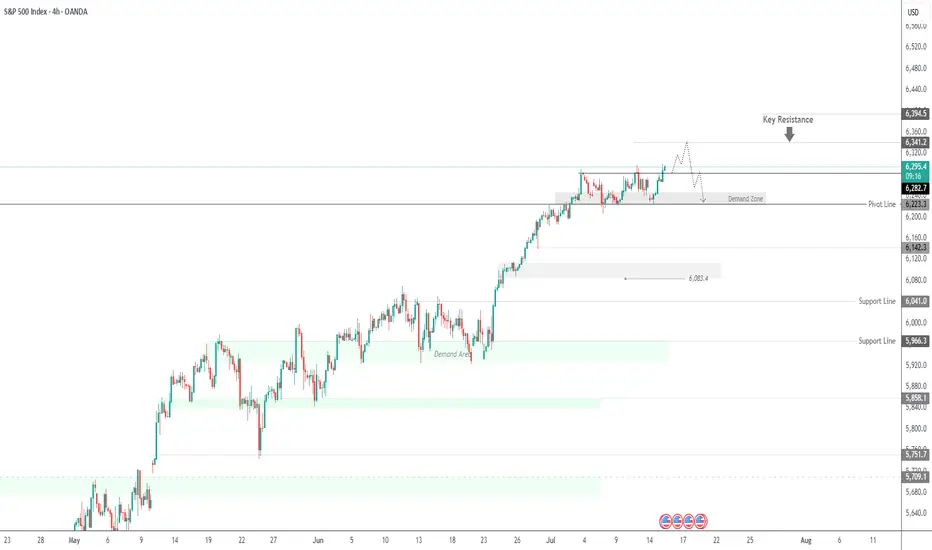
SPX500 Outlook – CPI Data in Focus, Key Pivot at 6282SPX500 – Market Outlook
U.S. futures are climbing as Nvidia plans to resume chip sales to China, fueling positive momentum across tech and growth sectors.
However, investor caution remains ahead of key events:
Major banks ( NYSE:JPM , NYSE:WFC Wells Fargo, NYSE:C Citigroup) will report earnings, offering insights into the financial sector.
All eyes are on the June CPI report, expected at 2.6%. A higher reading could reinforce bearish pressure, while a softer print would support continued bullish momentum.
Technical Outlook:
SPX500 has bounced from the demand zone and is now trading above the pivot at 6282, which keeps the bullish trend in play.
As long as the price holds above this level, we expect continuation toward 6341, and if broken, extended upside toward 6394.
To shift bearish, price must break and close below 6223, which would open the path toward 6142.
Pivot: 6282
Resistance: 6341 – 6394
Support: 6225 – 6191 – 6142
Event Watch : CPI data release today – anything above 2.6% may trigger downside; below 2.6% could support further upside.
Previous idea:
SPX 6300 Highs to 6200 Lows - Watch Key LevelsThis week earnings season kicks off
-Notables include JPM, GS, BAC, WFC, NFLX, KMI, PEP and others
US Inflation (CPI and PPI) this week
-forecasts are showing HIGHER inflation
-consumers care, but markets may not
6300-6350 key resistance area for SPX
6200 key support area for SPX
If we break the 6200 floor, there's room to fall to 6000-5700 to find stronger support
I discuss the 50 day moving averarages on the S&P and Nasdaq as levels to watch
For the remainder of the month...
7/18 July Monthly Expiration
7/30 US FOMC (with Press Conference)
8/1 US Non-Farm
8/1 US Tariff Deadline (per Trump)
Markets will have to really love a slew of good earnings and good news to see more highs and melt-ups through this typically bumpy season (Aug-Sep)
Thanks for watching!!!

Quick take on the S&P500From the very short-term perspective, the SP:SPX is currently stuck in a tight range. Waiting for a little breakout.
Let us know what you think in the comments below.
Thank you.
75.2% of retail investor accounts lose money when trading CFDs with this provider. You should consider whether you understand how CFDs work and whether you can afford to take the high risk of losing your money. Past performance is not necessarily indicative of future results. The value of investments may fall as well as rise and the investor may not get back the amount initially invested. This content is not intended for nor applicable to residents of the UK. Cryptocurrency CFDs and spread bets are restricted in the UK for all retail clients.

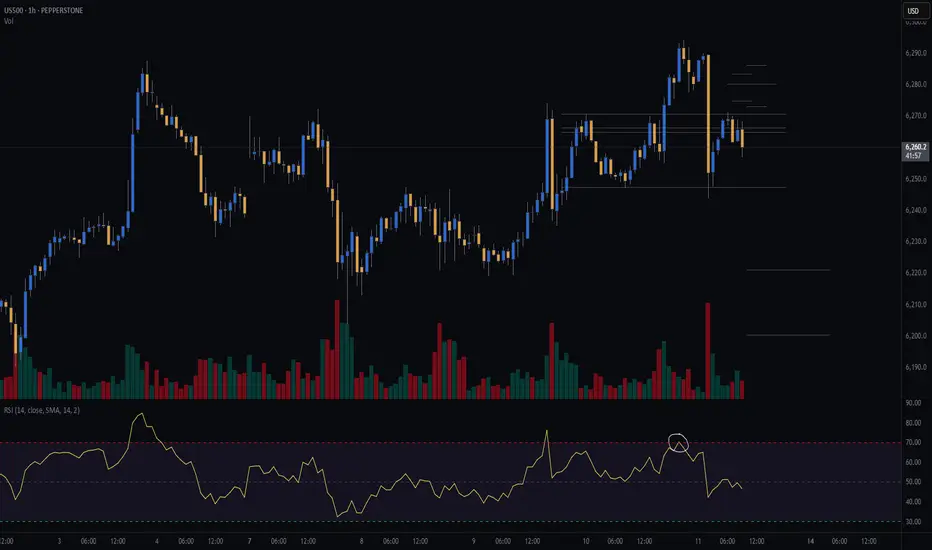
$SPX Today’s Trading Range and everything in it /// 7.11.25
Beautiful start here right at the bottom of the expected move. 6245/6230 bull put spreads right at open filled. Just look at the chart to see how I came up with that.

SPX - short here to test pivot around 6,040hit key area on the backtest heading back down to 6k area
S&P 500 - Micro Count Ew AnalysisThis is my lower timeframe analysis. Price has now reached the ideal target area for Wave 3, suggesting that a corrective phase may soon follow. This potential retracement could also align with broader market reactions to a possible announcement from Trump regarding new tariffs on Russia this coming Monday.
P.S. The macro count and higher timeframe outlook will be shared later.

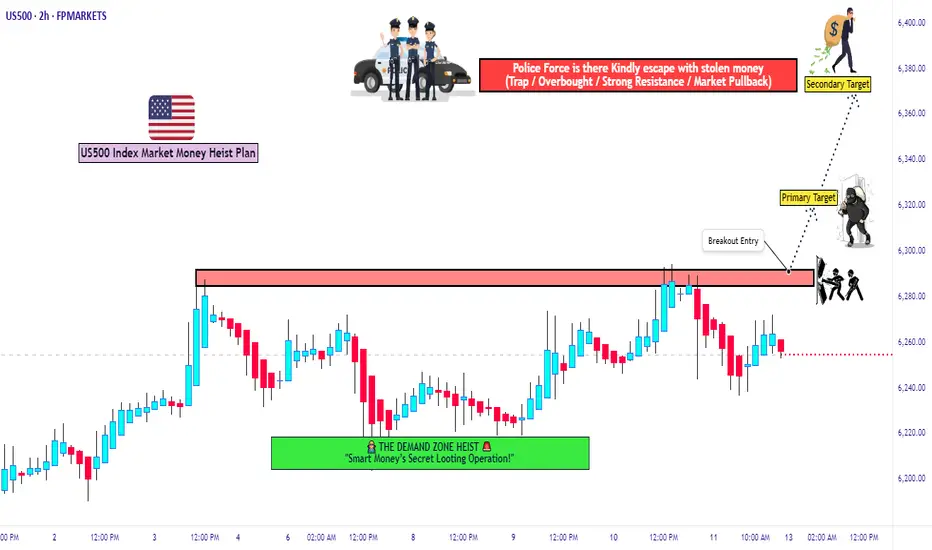
US500 Bulls Assemble | Breakout Heist Strategy📈🚨 MASTER HEIST PLAN: “SPX500 ROBBERY – THIEF TRADING STYLE 🔥💸” 🚨📈
(The Ultimate Long Strategy Blueprint for Smart Day/Swing Traders)
🌍 Greetings to All Market Bandits, Bullish Burglars, and Chart Snipers!
Hola! Bonjour! Ola! Hallo! Marhaba! 🙌
🦹♂️This is your friendly chart thief checking in with the latest SPX500/US500 masterplan!
This isn’t just a trade—it’s a heist 🎯. We’re not here to participate, we’re here to dominate! Welcome to the Thief Trading Style, where we map, trap, and snatch those pips with ruthless precision. 🧠🔍💰
🚀 THIEF TRADE SETUP - SPX500/US500
A mix of technical sniper entries + fundamental black ops analysis = 💸 Maximum Extraction. 💸
🎯 ENTRY PLAN: THE BREAKOUT HEIST
📍Buy Entry Zone: Wait for the clean breakout + candle close above 6270.00.
"The vault opens once we clear that wall. Let the bullish getaway begin!" 💥🚪📈
🛠️Thief Tips for Entry:
Use Buy Stop Orders above resistance levels.
OR layer in Buy Limit Orders near recent pullbacks (15/30m swing zones) using DCA Style (Dollar Cost Average layering like a pro).
Want stealth mode? Set that alert (alarm), and strike when the breakout sings. 🔔🎯
🛑 STOP LOSS – PROTECT THE LOOT
🧨Set your SL smart—beneath the nearest swing low using the 2H timeframe for stronger structure.
💬 “Look, don’t gamble. A thief knows when to run. Set that stop where I showed ya, or risk losin’ the bag.” 💼💣
❗Your SL should reflect your risk per trade, lot size, and number of entries. It’s your getaway plan—don’t mess it up.
💥 TARGETS – WHERE WE CASH OUT
🏴☠️Primary Take Profit (TP1): 6310.00
🏴☠️Secondary Take Profit (TP2): 6370.00
💹 Scalp Traders: Stick to the Long Side Only. Ride the momentum, but use trailing SL to lock it in.
🔍 THIEF FUNDAMENTAL INTEL: WHY THIS IS OUR MOMENT
Current SPX500 bullishness driven by:
✅ Positive macro & geopolitical tailwinds
✅ Institutional positioning (COT reports)
✅ Intermarket analysis showing strong correlations
✅ Momentum building with sentiment and volume
📌 Stay sharp—check all your fundamental reports, news catalysts, and sentiment tools before executing your move. Smart thieves plan every detail. 🎓📊
⚠️ NEWS RELEASE REMINDER
📢 News = Chaos. Don’t get caught in the spray:
🔒Avoid entering trades just before big announcements.
🚀 Use Trailing SL to secure profit if you're already in.
Stay agile. Stay smart. Stay rich. 💼🚁
❤️ SUPPORT THE HEIST – HIT THAT BOOST BUTTON!
👊 Liked the plan? Hit the Boost to join the elite robbery crew.
Every boost fuels the mission. Every like sharpens the strategy. Let's build a team of smart, profitable traders. 🚀💸🔥
🧠 Remember: This is general analysis – not financial advice. Manage your risk like a true thief. Stay updated. Adapt fast. Don't get caught. 🕵️♂️
🎉See you in the next Heist Plan! Keep your tools sharp, your charts cleaner, and your profit bags fatter. 🤑🔥
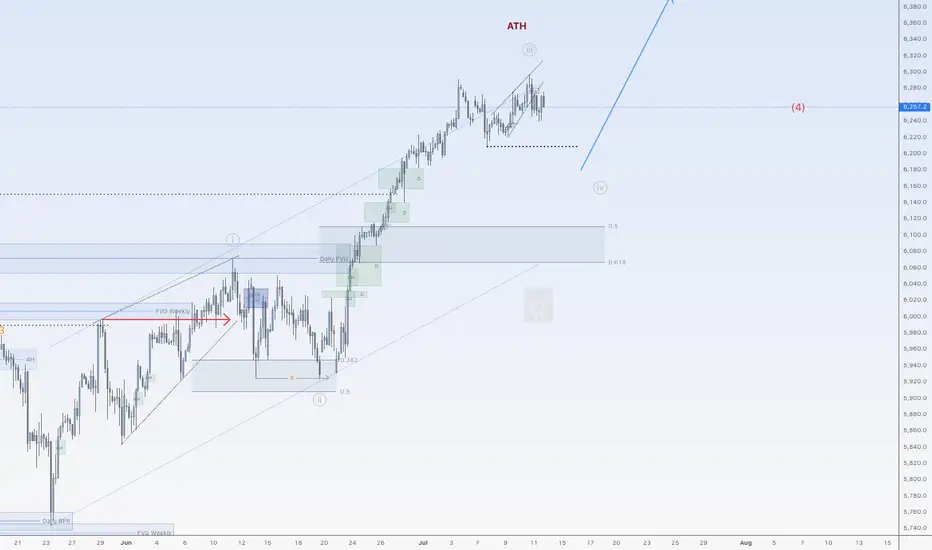
More upside after correction for SPX500USDHi traders,
Last week SPX500USD went a little more up (diagonal) just as I've said in my outlook.
Next week we could see the start of a bigger correction down (grey wave 4) and a break of the dotted trendline. Or the diagonal is a leading diagonal wave 1 and grey wave 3 extends more.
Let's see what the market does and react.
Trade idea: Wait to see if price breaks the dotted trend line (for shorts) or not (for longs).
If you want to learn more about trading FVG's & liquidity sweeps with Wave analysis, then please make sure to follow me.
This shared post is only my point of view on what could be the next move in this pair based on my technical analysis.
Don't be emotional, just trade your plan!
Eduwave
S&P 500 H4 | Approaching a multi-swing-low supportThe S&P 500 (SPX500) is falling towards multi-swing-low support and could potentially bounce off this level to climb higher.
Buy entry is at 6,220.89 which is multi-swing-low support that aligns with the 23.6% Fibonacci retracement.
Stop loss is at 6,170.00 which is a level that lies underneath a multi-swing-low support.
Take profit is at 6,299.72 which is a swing-high resistance.
High Risk Investment Warning
Trading Forex/CFDs on margin carries a high level of risk and may not be suitable for all investors. Leverage can work against you.
Stratos Markets Limited (tradu.com ):
CFDs are complex instruments and come with a high risk of losing money rapidly due to leverage. 63% of retail investor accounts lose money when trading CFDs with this provider. You should consider whether you understand how CFDs work and whether you can afford to take the high risk of losing your money.
Stratos Europe Ltd (tradu.com ):
CFDs are complex instruments and come with a high risk of losing money rapidly due to leverage. 63% of retail investor accounts lose money when trading CFDs with this provider. You should consider whether you understand how CFDs work and whether you can afford to take the high risk of losing your money.
Stratos Global LLC (tradu.com ):
Losses can exceed deposits.
Please be advised that the information presented on TradingView is provided to Tradu (‘Company’, ‘we’) by a third-party provider (‘TFA Global Pte Ltd’). Please be reminded that you are solely responsible for the trading decisions on your account. There is a very high degree of risk involved in trading. Any information and/or content is intended entirely for research, educational and informational purposes only and does not constitute investment or consultation advice or investment strategy. The information is not tailored to the investment needs of any specific person and therefore does not involve a consideration of any of the investment objectives, financial situation or needs of any viewer that may receive it. Kindly also note that past performance is not a reliable indicator of future results. Actual results may differ materially from those anticipated in forward-looking or past performance statements. We assume no liability as to the accuracy or completeness of any of the information and/or content provided herein and the Company cannot be held responsible for any omission, mistake nor for any loss or damage including without limitation to any loss of profit which may arise from reliance on any information supplied by TFA Global Pte Ltd.
The speaker(s) is neither an employee, agent nor representative of Tradu and is therefore acting independently. The opinions given are their own, constitute general market commentary, and do not constitute the opinion or advice of Tradu or any form of personal or investment advice. Tradu neither endorses nor guarantees offerings of third-party speakers, nor is Tradu responsible for the content, veracity or opinions of third-party speakers, presenters or participants.

$SPX Trading Range for 7.15.25 and everything in it for CPI
Tomorrow’s Trading range and everything in it. How are you playing it?
S&P 500 consolidating at all-time highsOf late, we have seen price action on the S&P 500 consolidate around all-time highs of 6,290 and is on track to form a small ascending triangle. The nearest support to note resides at the 1W level of 6,121, closely shadowed by a 1M support from 6,040.
Based on the current technical picture, this clearly remains a buyers’ market.
- FP Markets Research Team

The S&P 500 Is Hitting New Highs, But Its Charts Look MixedThe S&P 500 SP:SPX has made a series of new all-time closing and intra-day highs in recent days as Wall Street staged a remarkable comeback from the April lows that followed President Donald Trump's announcement of "Liberation Day" tariffs. Does fundamental and technical analysis say the key index could go higher from here ... or pull back?
Let's check it out:
The S&P 500's Fundamental Analysis
The SPX fell more than 21% intraday in less than seven weeks between its Feb. 19 peak and its April 7 low as Trump rolled out his plan for big tariffs on foreign imports.
Many investors feared that high import duties -- coupled with foreign retaliatory tariffs on American exports -- would boost U.S. inflation and unemployment at the same time, creating "stagflation."
But about a week after Trump rolled out the "Liberation Day" tariffs on April 2, the president paused much of the plan for 90 days to allow for trade talks with other countries.
Risk-on assets quickly started to come back as Wall Street began to think deals with trading partners might blossom. So far, only the United Kingdom, China and Vietnam have played ball, but that's been good enough for many investors.
Meanwhile, consumer-level U.S. inflation has largely been beaten back (at least for now), and Trump has had other economic victories as well.
For example, his "Big, Beautiful Bill" of tax cuts and spending changes recently passed into law, offering what many see as multiple pro-growth provisions.
True, the Congressional Budget Office warned that the Big, Beautiful Bill could add some $3.3 trillion to the U.S. government's already huge deficits over the next decade. However, the agency's projections didn't include $2.8 trillion of expected revenues over the next 10 years from Trump's tariffs.
The CBO also chose to model almost no economic growth over the next decade, which probably isn't very realistic.
Of course, it's still unclear whether Wall Street has already priced in all of the "Big, Beautiful Bill" potential positives, or whether the measure's tax cuts and deregulation will have their desired economic effects.
Similarly, we don't know whether there are any more bilateral trade deals around the corner, or whether the Federal Reserve will soon cut interest rates -- which could boost stocks by making bond and money-market yields less attractive.
The S&P 500's Technical Analysis
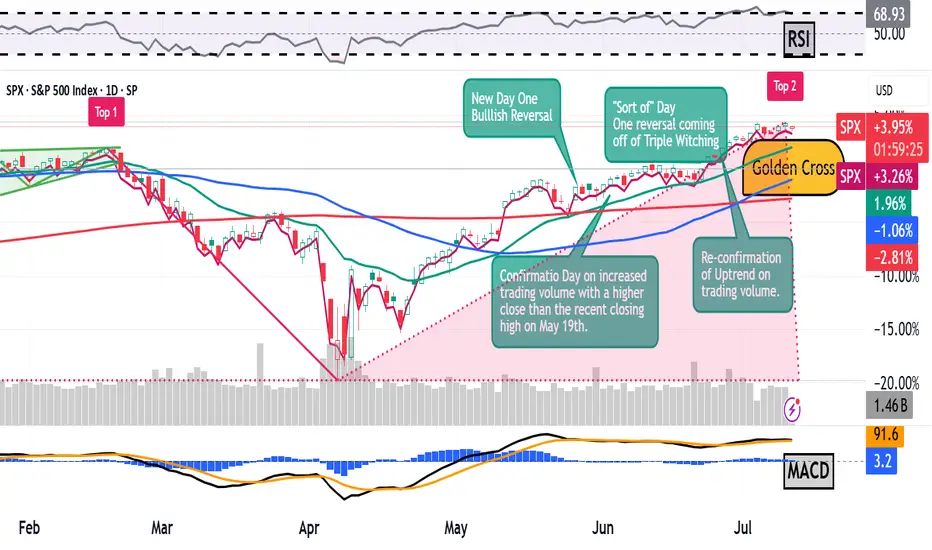
Now let's look at the SPX's chart going back some four months and running through midday Tuesday:
Readers will see that the S&P 500 has been in a clear uptrend for the past three months, as denoted by the orange- and purple-shaded areas above.
The index has colored neatly within the lines, finding support at the lower trendline in mid-June. Additionally, support came at the S&P 500's 21-day Exponential Moving average, or "EMA, marked with a green line above.
More recently, the S&P 500 also enjoyed the benefits of what we call a "golden cross." That's when the index's 50-day Simple Moving Average (or "SMA," marked with a blue line) crosses above a rising 200-day SMA (marked with a red line). That's historically a bullish technical signal for the index.
The S&P 500 also experienced "Day One" bullish reversals on May 27 and June 23. Those "Day Ones" were then confirmed on June 3 and June 26, respectively.
A "Day One" reversal occurs when an index reversed direction up or down on increased trading volume, followed by a "Confirmation Day" that moves the market in the same direction as the reversal on increased volume as well. That combination typically signifies changes in an index's short-term trend.
Now, astute readers might notice that the S&P 500's June 23 "Day One" reversal occurred on decreased day-over-day trading volume.
However, that's misleading because the market day just prior to June 23 was a "triple-witching" day, which technical analysts therefore discard.
Readers should also understand that there must be at least a one-day pause between a "Day One" reversal and a "Confirmation Day." Otherwise, technical analysts will consider both days to represent one move, and we wouldn't have a volume-based technical confirmation.
Next, let's look at the SPX's chart going back to January and running through midday Tuesday:
This chart shows that the S&P 500 is in danger of putting in what's called a "Double Top" pattern of bearish reversal, denoted with the red boxes above marked "Top 1" and "Top 2." With all that's going on politically and geopolitically, that's a concern.
On top of that, Q2 earnings season begins next week, and analysts' consensus is for rather paltry 5% year-over-year earnings growth for the S&P 500 component companies as a whole.
In addition, the S&P 500 has a conflicting Relative Strength Index ("RSI") and Moving Average Convergence Divergence indicator (or "MACD").
The index's RSI, marked with gray lines at the above chart's top, is practically at technically overbought levels.
But at the same time, the daily MACD (marked with black and gold lines and blue bars at the chart's bottom) is showing signs of weakness.
The histogram of S&P 500's 9-day EMA (the blue bars) is now below the zero-bound, which is historically a short-term bearish technical signal.
On top of that, the 12-day EMA (the black line) is threatening to cross under the 26-day EMA (the gold line). This hasn't happened yet, but would be a short-term bearish signal if it did.
Add it all up and the S&P 500 is showing a mixed technical picture right now despite trading at or close to all-time record highs.
(Moomoo Technologies Inc. Markets Commentator Stephen “Sarge” Guilfoyle had no position in S&P 500-related ETFs or mutual funds at the time of writing this column.)
This article discusses technical analysis, other approaches, including fundamental analysis, may offer very different views. The examples provided are for illustrative purposes only and are not intended to be reflective of the results you can expect to achieve. Specific security charts used are for illustrative purposes only and are not a recommendation, offer to sell, or a solicitation of an offer to buy any security. Past investment performance does not indicate or guarantee future success. Returns will vary, and all investments carry risks, including loss of principal. This content is also not a research report and is not intended to serve as the basis for any investment decision. The information contained in this article does not purport to be a complete description of the securities, markets, or developments referred to in this material. Moomoo and its affiliates make no representation or warranty as to the article's adequacy, completeness, accuracy or timeliness for any particular purpose of the above content. Furthermore, there is no guarantee that any statements, estimates, price targets, opinions or forecasts provided herein will prove to be correct.
Moomoo is a financial information and trading app offered by Moomoo Technologies Inc. In the U.S., investment products and services on Moomoo are offered by Moomoo Financial Inc., Member FINRA/SIPC.
TradingView is an independent third party not affiliated with Moomoo Financial Inc., Moomoo Technologies Inc., or its affiliates. Moomoo Financial Inc. and its affiliates do not endorse, represent or warrant the completeness and accuracy of the data and information available on the TradingView platform and are not responsible for any services provided by the third-party platform.
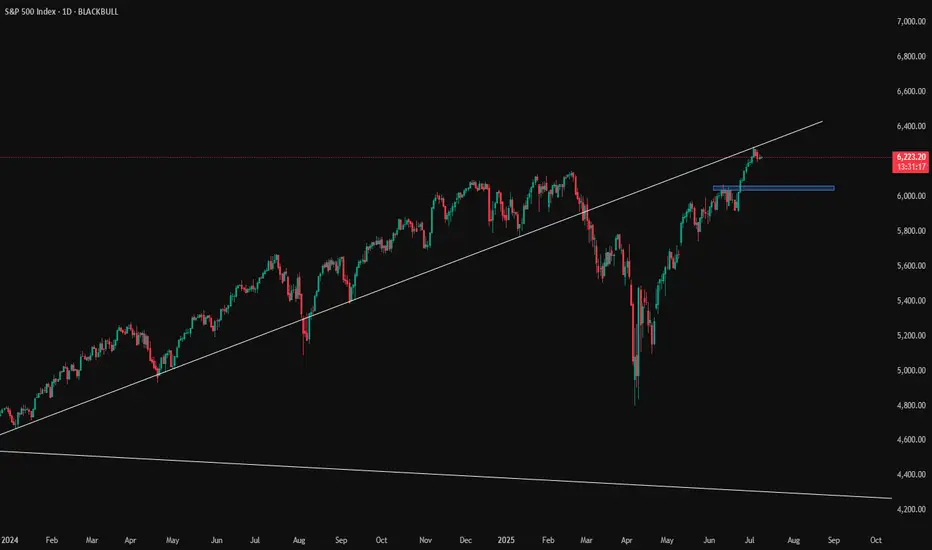
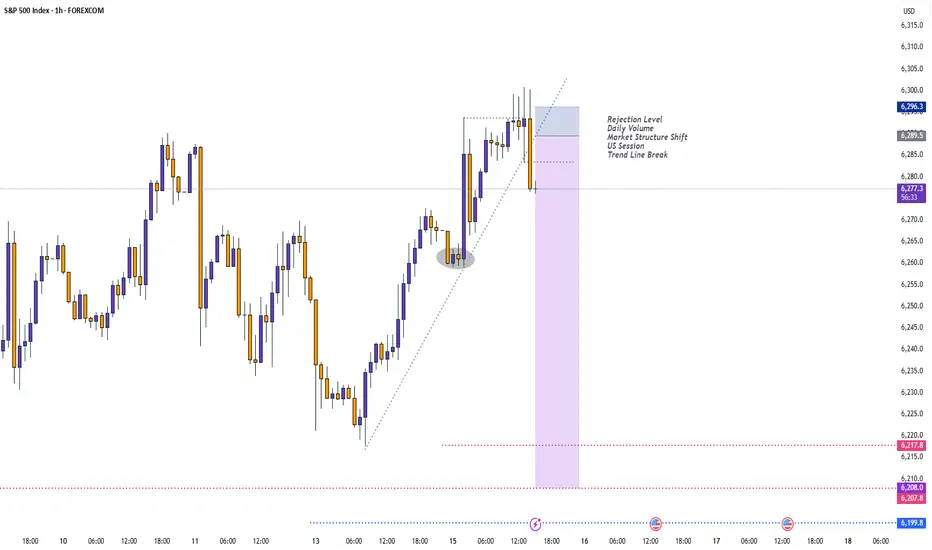
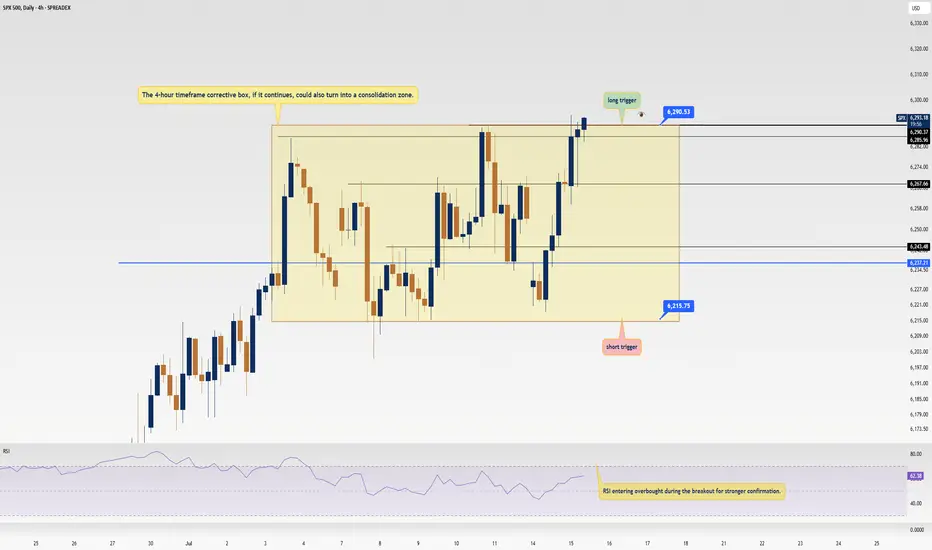
SPX500 Update: Monster Trigger Ready to Launch!Welcome back, traders, it’s Skeptic from Skeptic Lab! 😎 With news of the unemployment rate rising, stock and crypto markets have been surging hard, and right now, we’ve got a killer trigger on SPX500 you don’t want to miss. Its breakout could spark the next major bullish leg. Let’s dive into the Daily and 4-hour timeframes to unpack this setup. here’s the play:
✔️ Daily Timeframe:
After a strong rally, SPX500 hit an all-time high (ATH) at 5,249.14 before entering a deep correction. Here’s what many traders miss: support/resistance levels aren’t static—they shift over time. The resistance that was at 6,146.89 has now climbed to 6,290. Breaking 6,290 signals the start of a major bullish trend after 146 days of correction. This is our primary long trigger.
📊 4-Hour Timeframe (Futures Triggers):
Long Trigger: After a solid uptrend with strong momentum, we entered a time-based correction within a box pattern. Breaking the box ceiling at 6,290 is the long trigger, aligning with the Daily breakout.
Short Trigger: Breaking the box floor would trigger a short, but this goes against the trend, so stop-loss risk is higher, and your win rate could take a hit—stay cautious.
📉 Key Insight: The 6,290 breakout is the big move to watch, fueled by market momentum from the unemployment news. Shorts are riskier due to the bullish trend, so prioritize longs with volume confirmation.
🔔 Confirmation: For longs, confirm the 6,290 break with RSI entering overbought.Risk management is critical—cap risk at 1%–2% per trade to survive the market’s swings.
🔼 I’ll update if the structure shifts! Thanks for vibing with this analysis! <3
💬 Let’s Talk!
Which SPX500 trigger are you locked on? Hit the comments, and let’s crush it together! 😊 If this update lit your fire, smash that boost—it fuels my mission! ✌️
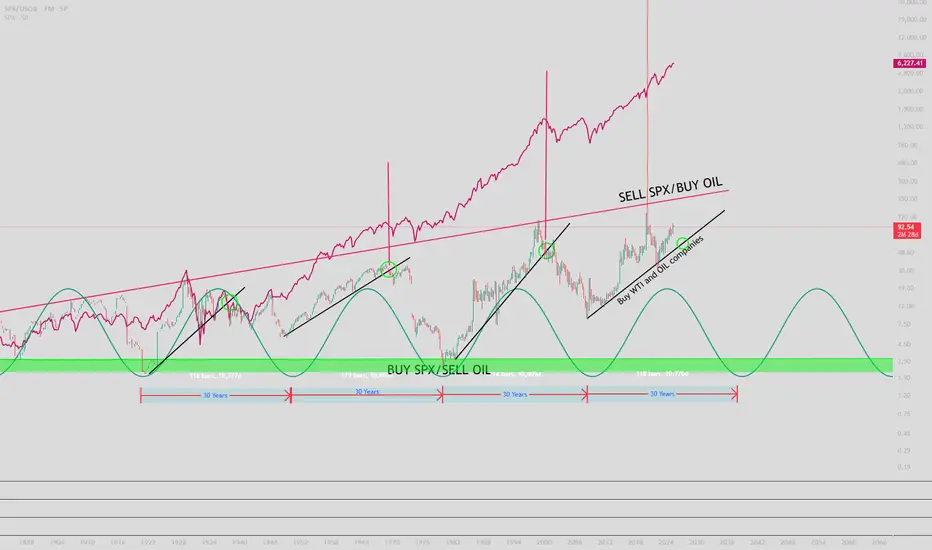
SPX VS OILHello there.
30 years low cycle is coming to end for OIL and energy.
Every 30 years, market of energy bottom against SPX.
When buy SPX AND NAS ? Each 30 years.
1920->1950->1980->2010->2040
When Sell SPX AND NAS ? Each 25-30 years
19401->970-2000->2025-30->2055-60
Sell SPX WHEN atm ? Well.. follow the last uptrend (blackline), sell when break
Recession always come when Energy > SPX
So.. keep an Eyes on Energy.
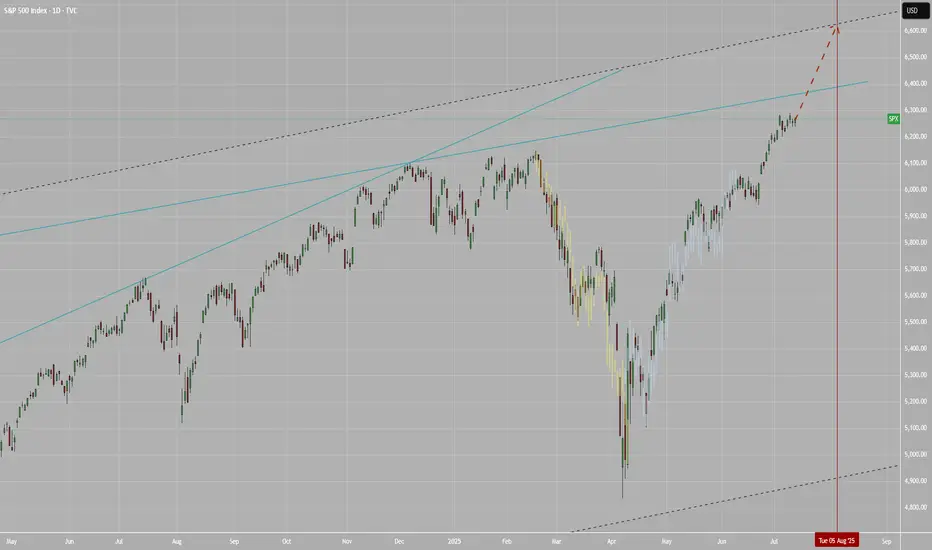
SPX to 6600+ by Aug 5This leg up in SPX is not over yet. Target at upper bound of the channel around 6.6K+ by Aug 5.
Gap down is likely a bear trap - SPYSo the gap down looked bearish but the technicals are not confirming it. One more high is likely today or Monday. Gold is at resistance here. OIl found support and looks like a long. BTC rallied and can go higher but it's putting in daily bearish divergences. Natural Gas looks like it will bounce.

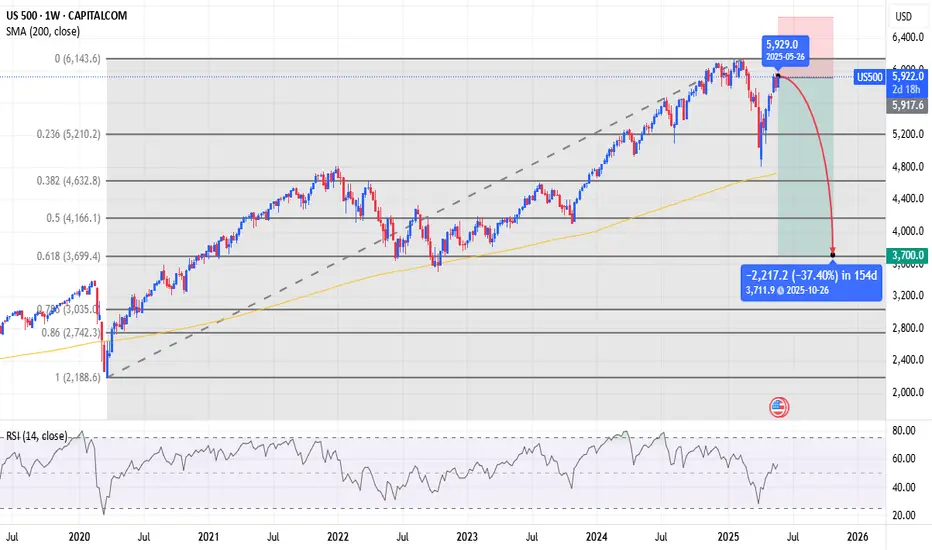
Major LowI'm buying puts expiring on October 31st, All Hallow's Eve.
I'll give price room to keep melting up to 666 at the farthest, that is my stop level. If we breach that price, then just know that tech is unstoppable and Artificial Intelligence is the Mark of the Beast.
If the market doesn't drop here, then the sky is the limit.