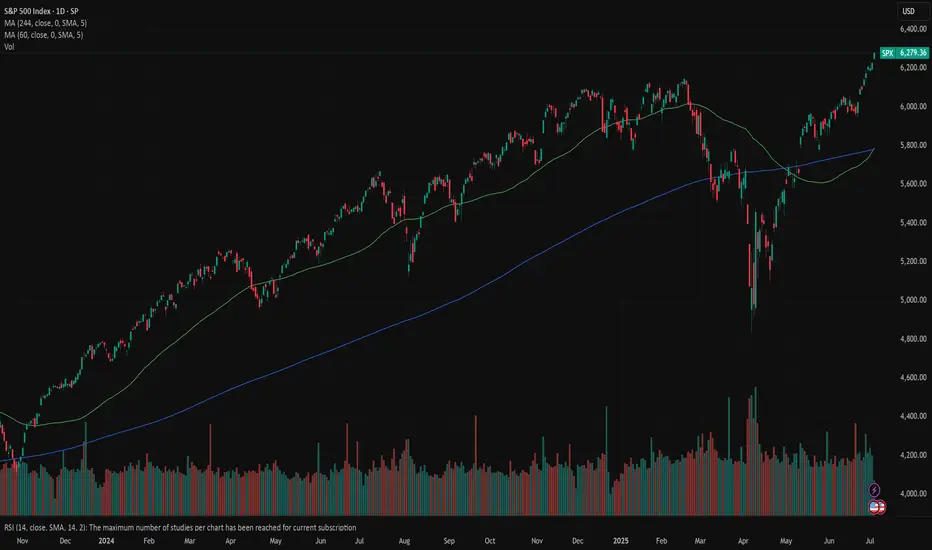
SPX: highly optimisticThe US market celebrated on Friday the US Independence Day, after highly optimistic last two weeks. Almost every day, the S&P 500 was reaching new all time highest levels, finishing Thursday trading session at 6.279. At this moment this is officially treated as a new ATH for the index. The optimism was supported by better than expected US jobs data posted during the previous week. The NFP added 147K new jobs in June, which beated market expectations. The strong US payrolls reinforced market confidence despite concerns over trade tariffs. With inflation remaining sticky and solid jobs growth, markets have increased expectations of the Fed's rate cut in September. Currently, there is relatively low odds that the next rate cut might occur at the Julys FOMC meeting.
Tech companies were again those who led the index to the upside. The leader was for one more time Nvidia, with a weekly surge of 9,7%. AMZN was traded higher by 6,3%, MSFT by 3,9%. TSLA was struggling a bit, ending the week 0,33% higher from the week before.
Weekly news regarding trade tariffs include a US-Vietnam trade deal of 20% tariffs on imports from Vietnam. At the same time, the US exports to Vietnam will be tariffs-free. However, markets are still concerned regarding the final resolution of imposed 90-days delay of implemented tariffs for almost 180 countries around the world, a period which expires in July. On the other hand, Trump's tax mega bill was passed by the US Senate on Tuesday, and is currently awaiting final approval from the House. There were many discussions during the previous period that this tax mega bill might further increase US debt levels, which will be negatively reflected in the economy.
USA500 trade ideas
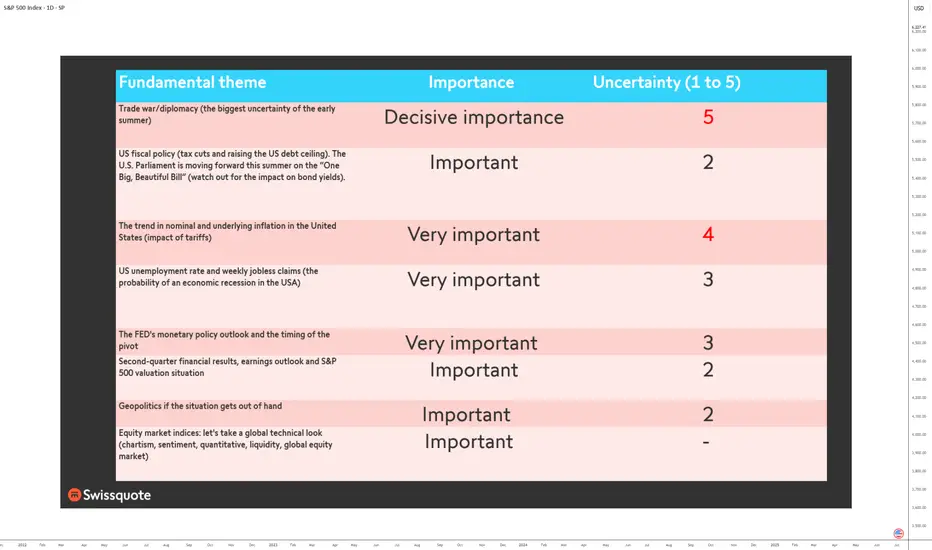
Top fundamentals that will shape the S&P 500 this summer 2025The summer of 2025 is characterized by a combination of macroeconomic and microeconomic factors that will shape the trajectory of the US equity market. While the S&P 500 is trading close to its all-time highs and at a valuation comparable to that at the end of 2021, the strength of the upward momentum will depend on the conjunction of several key variables. Understanding these fundamentals is crucial to grasping the potential and risks awaiting investors over the coming months.
1) The trade war and economic diplomacy, the main source of uncertainty
The trade issue remains the most unpredictable at the start of the summer. The July 9 deadline for the conclusion or failure of tariff negotiations is crystallizing tensions between the United States and its main partners. The prospect of a new wave of tariffs could have a direct impact on production costs, inflation and business confidence. Trade diplomacy is thus the variable most likely to provoke volatility jolts and challenge positive earnings growth expectations. If trade agreements are signed, then this will help to sustain the S&P 500's uptrend.
2) US fiscal policy: the “One Big, Beautiful Bill”
The Trump administration's major tax bill is another hotspot. This piece of legislation calls for an extension of the tax cuts initiated in 2017 and a dramatic increase in the public debt ceiling, to the tune of $5,000 billion. While these measures potentially support consumption and private investment, their medium-term impact on public finances is uncertain. The real issue for the equity market is to assess whether these decisions will lead to a surge in long-term US bond yields. A slippage in US Treasury yields would increase corporate financing costs and undermine currently high valuation multiples. Conversely, if yields remain contained, the equity market's upward momentum could continue.
3) Inflation and the Fed's monetary policy: a delicate balance
The trajectory of inflation, in particular that of the PCE index, will be a major determinant. US inflation is currently slightly below the Fed's target. Several components, notably the services sector, which accounts for almost two-thirds of the PCE basket, are proving relatively stable. Inflationary risks are more likely to come from commodities, particularly if trade tensions reignite. Oil, which accounts for around 11% of the PCE basket, is currently showing no major warning signs, benefiting from a geopolitical calm. Real estate and healthcare are also showing reassuring indicators. Against this backdrop, the Federal Reserve is adopting a cautious stance: while several major Western central banks are moving towards a neutral rate, the Fed is stalling and conditioning its monetary pivot on visibility regarding tariffs and corporate behavior.
The timing of rate cuts is one of the biggest sticking points. According to recent signals, the first rate cut could take place as early as September. However, influential members of the FOMC, appointed by the Trump administration, are arguing for earlier easing. The political pressure is strong: Trump is calling for immediate cuts, but Chairman Powell remains in control of the agenda, taking care to preserve a consensus within the committee.
4) The job market and the likelihood of a recession
The US employment situation is an advanced barometer of the economic cycle. Weekly jobless claims and the aggregate unemployment rate are closely monitored. Historically, a significant rise in unemployment signals that the economic slowdown is already underway. For the time being, the labor market is proving resilient, but the slightest deterioration could alter investors' central scenario and reinforce recessionary expectations. This risk is one of the potential dampeners to the prevailing optimism, unless it were to accelerate the timetable for resuming the cut in the federal funds rate.
5) Second-quarter results and earnings outlook
The second-quarter earnings season is of particular importance. US companies must demonstrate their ability to deliver earnings growth in line with forecasts, even as valuation multiples remain stretched. Maintaining high price levels on the S&P 500 assumes robust earnings growth and confident guidance from management. Failing this, the risk of a correction would be high, especially as the market has already incorporated many positive factors. The weakness of the US dollar and the price of oil, as well as the current momentum in AI, could hold out some pleasant surprises for second-quarter results.
6) Geopolitics and oil, potential sources of volatility
Finally, global geopolitics is a second-order variable, but one that could suddenly become a priority. A rapid deterioration in the international situation, particularly in the Middle East or the China Sea, could affect trade flows and oil prices, fuelling renewed inflation and financial volatility.
Conclusion :
The summer of 2025 promises to be a period of strategic transition for the US equity market. Between trade diplomacy, fiscal policy, inflation, the trajectory of interest rates and earnings momentum, investors will have to deal with an accumulation of uncertain factors. If these uncertainties gradually dissipate, the uptrend could continue. Conversely, the combination of a geopolitical shock, a rebound in inflation and a political stalemate over the federal budget would have the potential to weaken the current rally.
DISCLAIMER:
This content is intended for individuals who are familiar with financial markets and instruments and is for information purposes only. The presented idea (including market commentary, market data and observations) is not a work product of any research department of Swissquote or its affiliates. This material is intended to highlight market action and does not constitute investment, legal or tax advice. If you are a retail investor or lack experience in trading complex financial products, it is advisable to seek professional advice from licensed advisor before making any financial decisions.
This content is not intended to manipulate the market or encourage any specific financial behavior.
Swissquote makes no representation or warranty as to the quality, completeness, accuracy, comprehensiveness or non-infringement of such content. The views expressed are those of the consultant and are provided for educational purposes only. Any information provided relating to a product or market should not be construed as recommending an investment strategy or transaction. Past performance is not a guarantee of future results.
Swissquote and its employees and representatives shall in no event be held liable for any damages or losses arising directly or indirectly from decisions made on the basis of this content.
The use of any third-party brands or trademarks is for information only and does not imply endorsement by Swissquote, or that the trademark owner has authorised Swissquote to promote its products or services.
Swissquote is the marketing brand for the activities of Swissquote Bank Ltd (Switzerland) regulated by FINMA, Swissquote Capital Markets Limited regulated by CySEC (Cyprus), Swissquote Bank Europe SA (Luxembourg) regulated by the CSSF, Swissquote Ltd (UK) regulated by the FCA, Swissquote Financial Services (Malta) Ltd regulated by the Malta Financial Services Authority, Swissquote MEA Ltd. (UAE) regulated by the Dubai Financial Services Authority, Swissquote Pte Ltd (Singapore) regulated by the Monetary Authority of Singapore, Swissquote Asia Limited (Hong Kong) licensed by the Hong Kong Securities and Futures Commission (SFC) and Swissquote South Africa (Pty) Ltd supervised by the FSCA.
Products and services of Swissquote are only intended for those permitted to receive them under local law.
All investments carry a degree of risk. The risk of loss in trading or holding financial instruments can be substantial. The value of financial instruments, including but not limited to stocks, bonds, cryptocurrencies, and other assets, can fluctuate both upwards and downwards. There is a significant risk of financial loss when buying, selling, holding, staking, or investing in these instruments. SQBE makes no recommendations regarding any specific investment, transaction, or the use of any particular investment strategy.
CFDs are complex instruments and come with a high risk of losing money rapidly due to leverage. The vast majority of retail client accounts suffer capital losses when trading in CFDs. You should consider whether you understand how CFDs work and whether you can afford to take the high risk of losing your money.
Digital Assets are unregulated in most countries and consumer protection rules may not apply. As highly volatile speculative investments, Digital Assets are not suitable for investors without a high-risk tolerance. Make sure you understand each Digital Asset before you trade.
Cryptocurrencies are not considered legal tender in some jurisdictions and are subject to regulatory uncertainties.
The use of Internet-based systems can involve high risks, including, but not limited to, fraud, cyber-attacks, network and communication failures, as well as identity theft and phishing attacks related to crypto-assets.
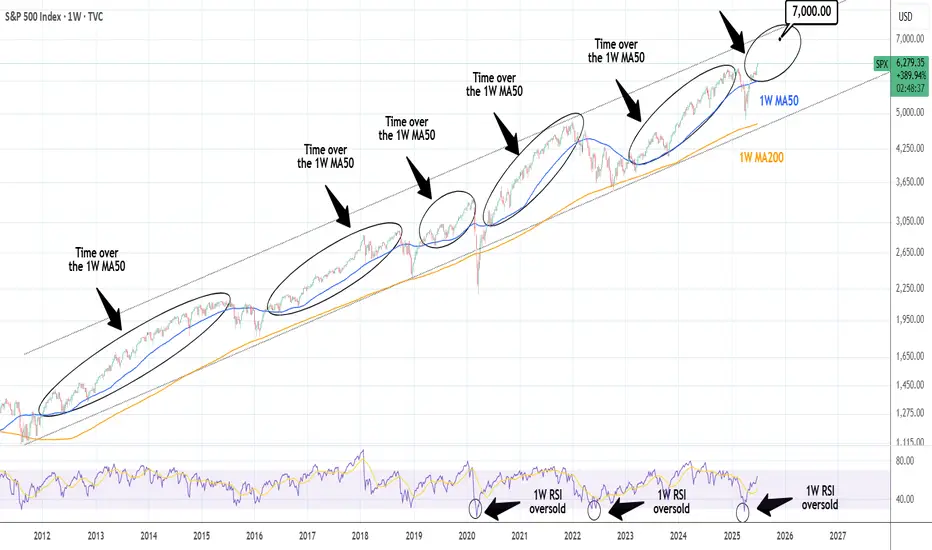
S&P500: Once it breaks the 1W MA50, it doesn't look back.S&P500 has turned overbought on its 1D technical outlook (RSI = 75.570, MACD = 96.940, ADX = 23.950) and rightly so as it is extending the rally after crossing above the 1W MA50. The Channel Up since late 2011 shows that when the index crosses above its 1W MA50, it tends to spend a notable time over it (and every contact is a buy opportunity), with the most recent example being the March 2023 - December 2024 period. The shortest such period has been in 2019, which was suddently disrupted by the black Swan event of COVID. We may have gotten out of a similar situation as Trump's tariffs disrupted the uptrend earlier this year with a huge, unexpected correction. There 1W MA200 supported and this brings us to a new 'above the 1W MA50 bullish phase', which even if it is as short as 2019, it can still target 7,000.
See how our prior idea has worked out:
## If you like our free content follow our profile to get more daily ideas. ##
## Comments and likes are greatly appreciated. ##
SPX500 Awaits Breakout as Trade Talks Fuel Market CautionWall Street Edges Up Amid Tariff Talks & Trade Turbulence
U.S. stock index inched higher on Wednesday as markets remain on edge over President Donald Trump's aggressive tariff stance and the ongoing negotiations with global trade partners. Traders are cautiously watching for clarity, with sentiment shifting quickly on any updates.
📉 SPX500 Technical Outlook
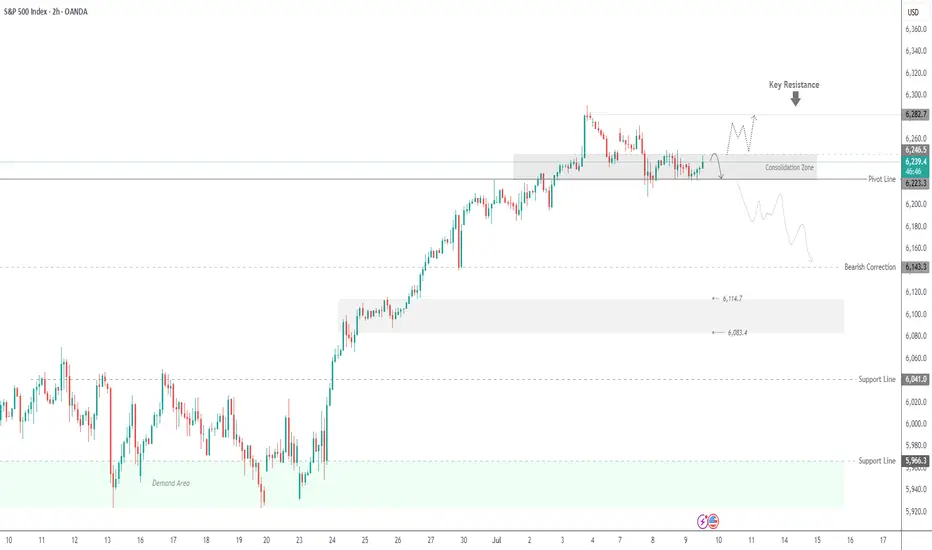
The index continues to consolidate within a narrow range between 6223 and 6246. A confirmed breakout from this zone is needed to define the next directional move.
A break below 6223 would confirm bearish continuation toward 6194, with potential extension to 6143.
A break above 6246 would shift the bias bullish, targeting 6282, followed by 6305.
Key Levels:
Support: 6223 / 6195 / 6143
Resistance: 6282 / 6305
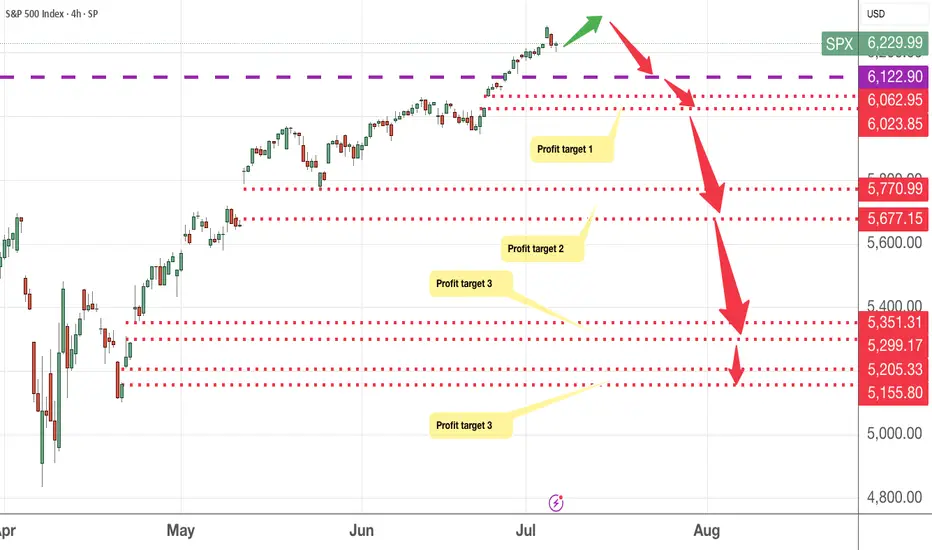
SPX may have retracement soon, taking profits timeAs if timing cannot be more coincidental, Trump has announced slapping 25% tariff on Japan and South Korea. This sends chills back to the stock market as the SPX has recently climbed and exceeded the previous high of 6148 price level.
This week, I expect the SPX to retrace to the various levels I indicated on the chart. Profit target 3 and 4 looks less likely but not impossible. 1 & 2 are more likely and that again would be a good entry level to accumulate.
No, I am not shorting as I invest in the VOO ETF for long term so retracement is a good opportunity to long.
Trading at the market topHello,
The stock market is back at an all-time high. This often brings excitement for existing investors—and a sense of anxiety or even FOMO (fear of missing out) for those who stayed on the sidelines when prices were lower.
It’s tempting to jump in, especially with headlines filled with optimism and portfolios showing green across the board. But this is also a time for caution and patience.
After a sustained rally, price levels often outpace fundamentals like earnings growth, economic stability, or interest rate trends. In such moments, valuations can become stretched, and investor sentiment overly euphoric conditions that typically precede short-term pullbacks or corrections.
Buying at the top locks in risk, not value.
If you're feeling late to the party, remember that good investors don’t chase prices—they wait for prices to come to them.
The best opportunities often come in moments of fear, not euphoria. And while this market high may go higher still, history shows that eventually, corrections come—and those prepared for them are the ones who win in the end.
Disclosure: I am part of Trade Nation's Influencer program and receive a monthly fee for using their TradingView charts in my analysis.
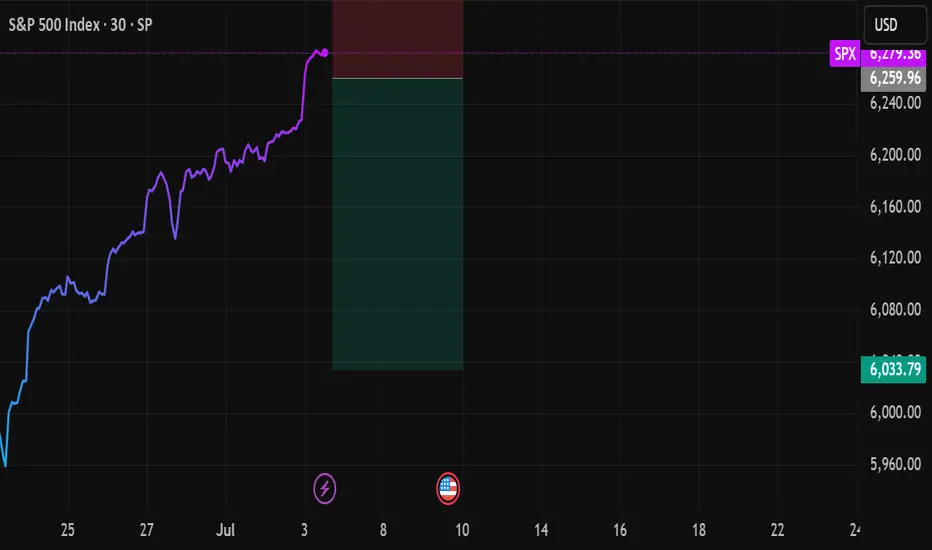
SHORT ON SPY (SPX/USD)SPY has a double top and is currently pulling back to a supply zone.
I expect spy to drop to the next demand level or FVG to the downside.
This is a sell limit order. Waiting for price to reach the supply area before taking the sell.

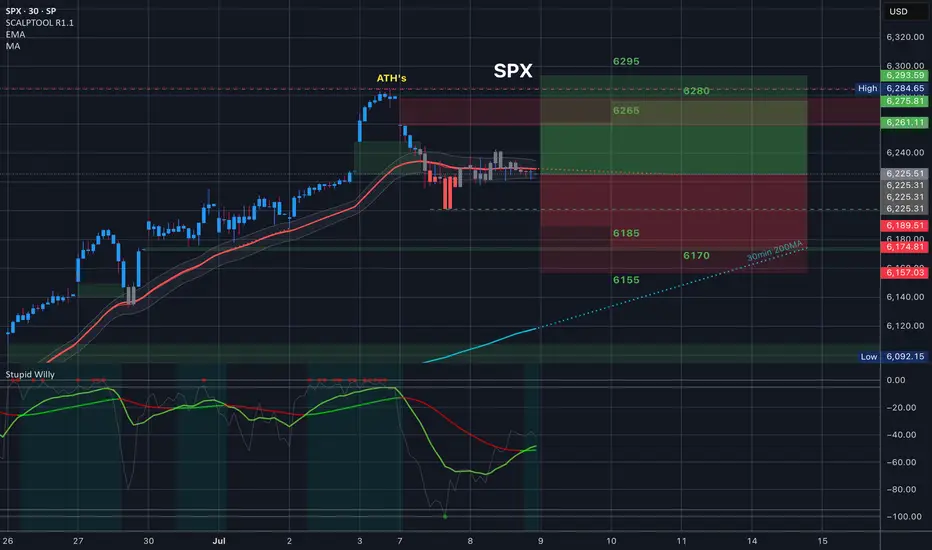
SPX - Are you catching the rotation trends? SPX is still holding very bullish price action. Technicals are pointing towards higher price and todays inside consolidation day certainly helps digest recent gains.
Along with the flat indices market session, we did observe some massive capital rotation trends.
Financials saw a pretty strong down move across the board. JPM / BAC / C all saw large outflows. We were positioned on the short side of financials and took profits on JPM puts.
Even with the big selloff in financials, SPX held up surprisingly well.
Capital simply rotated instead of outright leaving the market. Bullish Signal.
Technology, Energy, Materials, Health care, Transports all saw capital inflow trends.
Rotation into under preforming sectors is a sign that markets could be staging another healthy leg up.
We still have an upside target over 6300 on SPX.

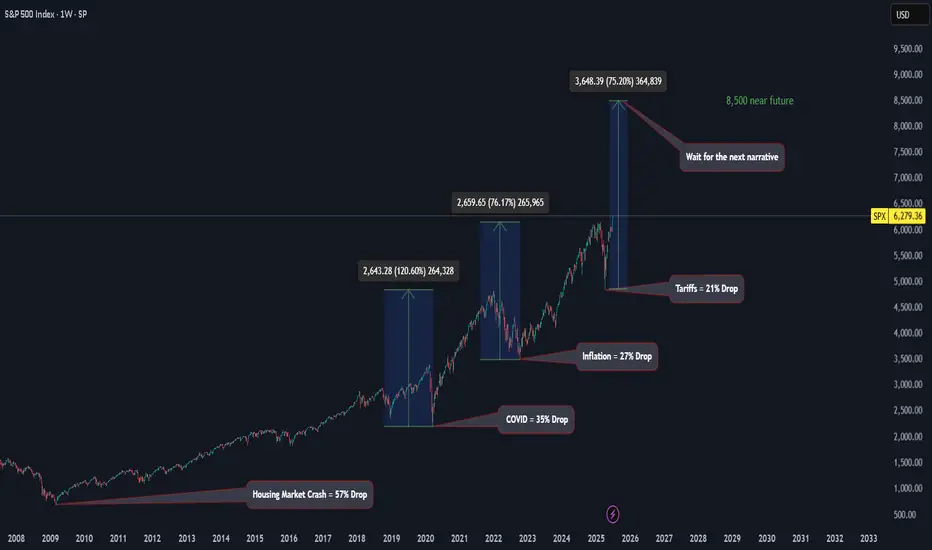
SPX Expansion with Historical DataGood morning everyone!
This week I wanted to elaborate more on my previous idea of SPX with the historical data that led to this analysis. This is almost all fundamental analysis adding in the retracement percentages which can also be evaluated through some technical instruments.
Unemployment rate is currently at 4.1%, with inflation at 2.4%. Based on the data, it is evident the market is currently in an expansion period which is why the narrative that we will see 2 interest rate drops by the end of year continues to diminish. I think we will probably see 1 before the year ends and that would just fuel the market and gain momentum to the upside.
If we were to measure the expansion of SPX going back to the 2000's, we get an extension of at least 75%. If we were to extend 75% based on the previous swing high (6,147) we could see future SPX price at 8,500. Now, do your own research, but the data is here. I expect the market to possibly retest previous high, but if you did not enter during the dip, no worries. There is still plenty of upside potential and better late than never.
Remember... CASH FLOW IS KING!
Avoid all the noise and distractions. The job of many platforms out there is to have something to put out for the public EVERYDAY! A good amount of that is noise. Look for macroeconomic news and let that be your indicator.
Historical Data:
(1) .com Bubble (2000 - 2002) We had a 50% drop of SPX. This lasted for almost 2 years before recovery.
(2) Housing Market (2007 - 2009) The SPX dropped 57% due to the collapse of subprime lenders collapsing. Housing prices decline drastically leaving people with high mortgage payments than what their homes are actually worth leading to a wave of foreclosures.
(3) Covid (2020) This was a global event with government mandated shutdowns causing the entire financial markets to come to a halt. Many business closures that led to jobs loss with an unemployment rate of approximately 15%.
(4) Inflation & Rate Hikes (2022) When Covid happened, upon recovery market expanded way too fast causing inflation to rise and the Feds to increase interest rates to slow down the economy.
(5) Tariffs (2025) Will stay away from politics on this one, however, a rebalancing of trade has taken place with some countries still working on tariff deals with the U.S. This has caused huge uncertainty for companies and corporation. VIX (fear index) reached 60.13.
Hope you enjoyed this post. Have a great rest of your week, don't forget to like and follow and Happy Trading!
SP500 rock & roll with Trump.. 4/July/25SPX500 breaking ATH again are we in bullish stage? Or again Donald Trump "Inviting" us come to his WWE stage for his favourite "wrestling" games.. Jumping up and down or up side down.( expanding triangle) ......
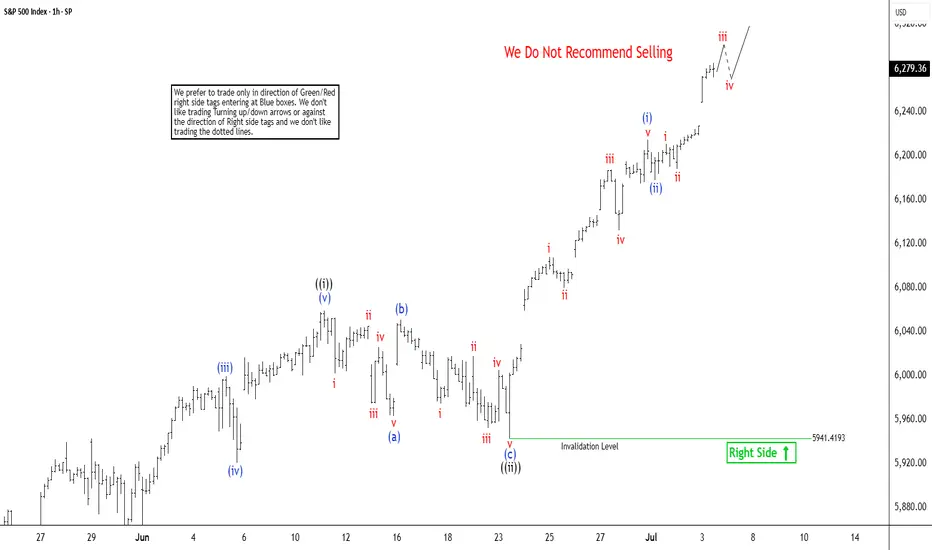
S&P 500 ($SPX) Nests Upward in Strong RallySince bottoming out on April 7, 2025, following the tariff war selloff, the S&P 500 (SPX) has sustained a robust rally. The Index is reaching new all-time highs in a clear Elliott Wave impulsive structure. Technical analysis, particularly momentum indicators like the Relative Strength Index (RSI), shows no divergence at the latest peak. This indicates sustained bullish momentum and suggests the rally remains within the third wave of the Elliott Wave sequence. From the April 7 low, wave 1 concluded at 5968.6. A corrective wave 2 followed which ended at 5767.41. The index has since nested higher within wave 3, demonstrating strong upward momentum.
Breaking down the substructure of wave 3, the hourly chart below reveals that wave ((i)) peaked at 6059.4. The subsequent pullback in wave ((ii)) unfolded as a zigzag pattern. Wave (a) declined to 5963.21, and wave (b) rebounded to 6050.83. Wave (c) concluded at 5941.4, completing wave ((ii)) in the higher degree. The index has since resumed its ascent in wave ((iii)). Up from wave ((ii)), wave (i) reached 215.08 and a minor pullback in wave (ii) ended at 6177.97.
The SPX is expected to continue its upward trajectory, with potential pullbacks finding support in a 3, 7, or 11 swing against the 5941.4 level, setting the stage for further gains. This analysis underscores the index’s bullish outlook, supported by technical indicators and Elliott Wave structure, as it navigates higher within this impulsive cycle.
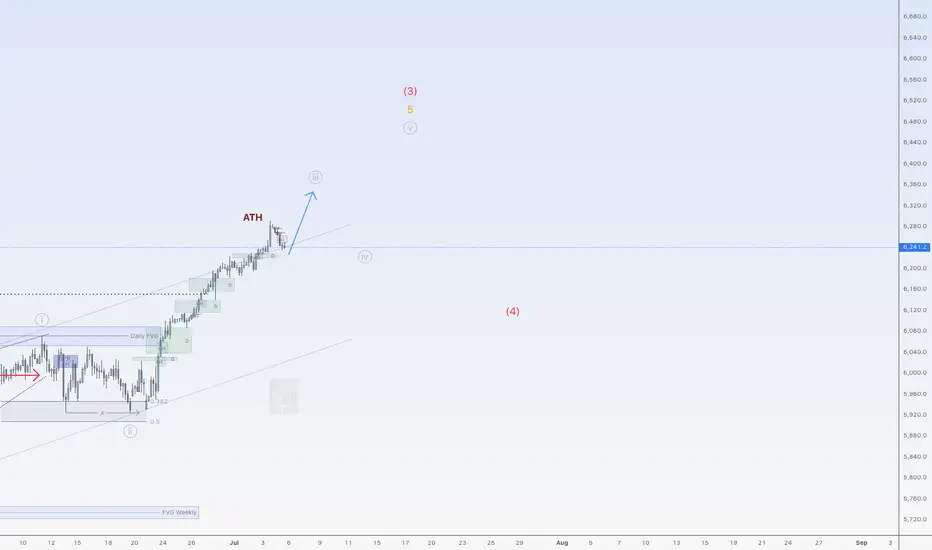
Little more upside for SPX500USDHi traders,
Last week SPX500USD went higher then expected (wavecount updated).
If this is correct, then next week we could see a little more upside for this pair.
Let's see what the market does and react.
Trade idea: Wait for price come into the Daily bullish FVG's to trade longs again. At the moment price is too high to trade.
If you want to learn more about trading FVG's & liquidity sweeps with Wave analysis, then please make sure to follow me.
This shared post is only my point of view on what could be the next move in this pair based on my technical analysis.
Don't be emotional, just trade your plan!
Eduwave
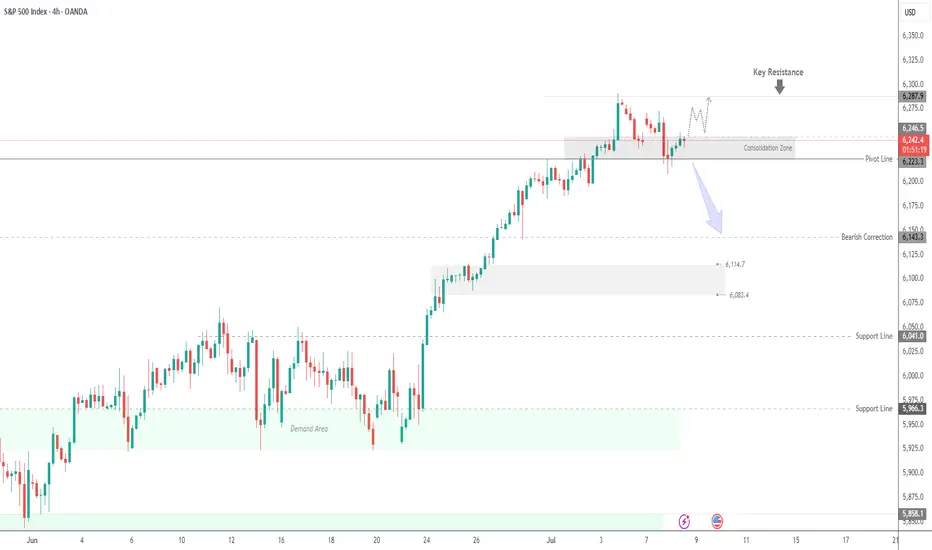
SPX500 Range-Bound Between 6223–6246 |Breakout Will Define TrendSPX500 – Technical & Fundamental Outlook
The SPX500 is currently trading within a narrow consolidation zone between 6223 and 6246.
A 1H or 4H candle close below 6223 would confirm a bearish breakout, with downside targets at 6191 and 6143.
Conversely, a 1H close above 6246 would signal bullish continuation, potentially driving the price toward the next resistance at 6287, followed by 6305.
Support: 6223 / 6191 / 6143
Resistance: 6287 / 6305
Fundamental Note:
The tariff situation remains a major driver.
Successful negotiations would likely boost bullish sentiment across indices.
Lack of progress may trigger renewed bearish momentum.
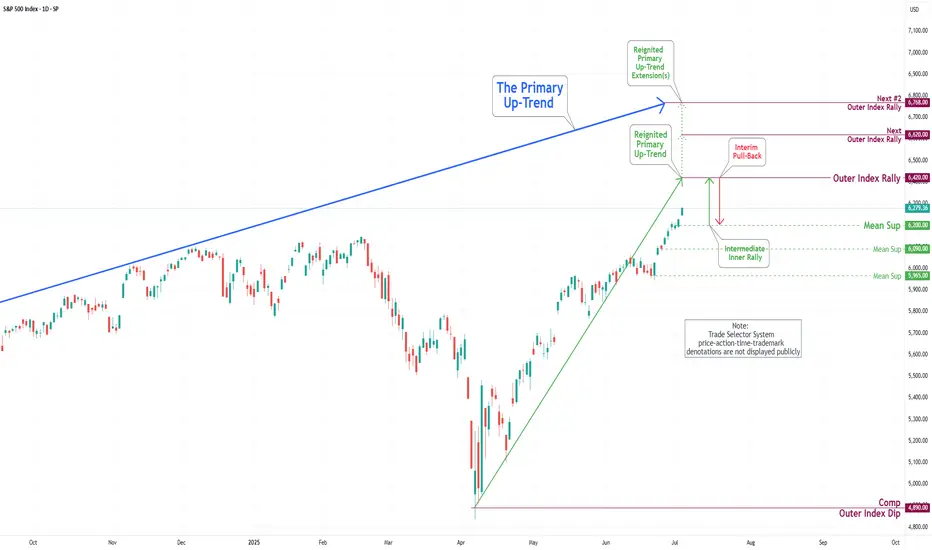
S&P 500 Daily Chart Analysis For Week of July 3, 2025Technical Analysis and Outlook:
During this abbreviated trading week, the S&P 500 Index has primarily shown an upward course, hitting and surpassing our target for the Outer Index Rally of 6235. Currently, the index demonstrates a consistent bullish trend, with the following objective for the Outer Index Rally set at 6420, followed by forthcoming targets of 6620 and 6768. Nevertheless, it is crucial to acknowledge the current price action may cause prices to retrace from their current fluctuation to test the Mean Support at 6200 before resuming their upward movement.
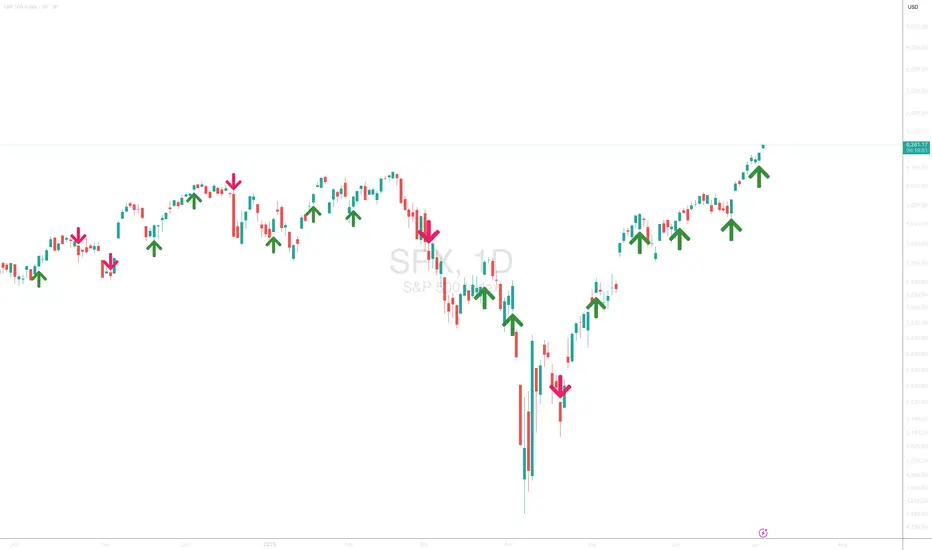
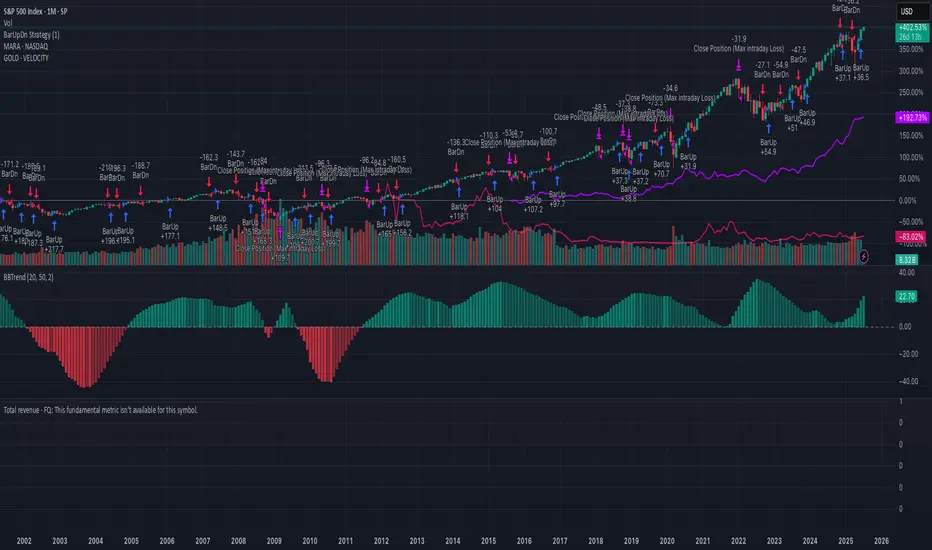
Acorn's Smart Money S&P SignalJuly 2, 2025 - S&P broke to the upside confirming a bullish S&P signal. If correct, the bullish S&P indicator suggests the S&P will close above 6177.97 on July 17. Let’s see if the market can continue to the upside!
S&P to go down a bit....good time to hop on UVIX!Saw this from a mile away. We are now at the cross hair between high tariffs and the tail-end of a week long rally that was mostly based on hot air. What's next? Gravity will prevail.
The VIX has been at super low levels historically. UVIX is a nice 2X! Jumped like 4% already today and there's way more upside. Best of luck and always do your own due diligence.

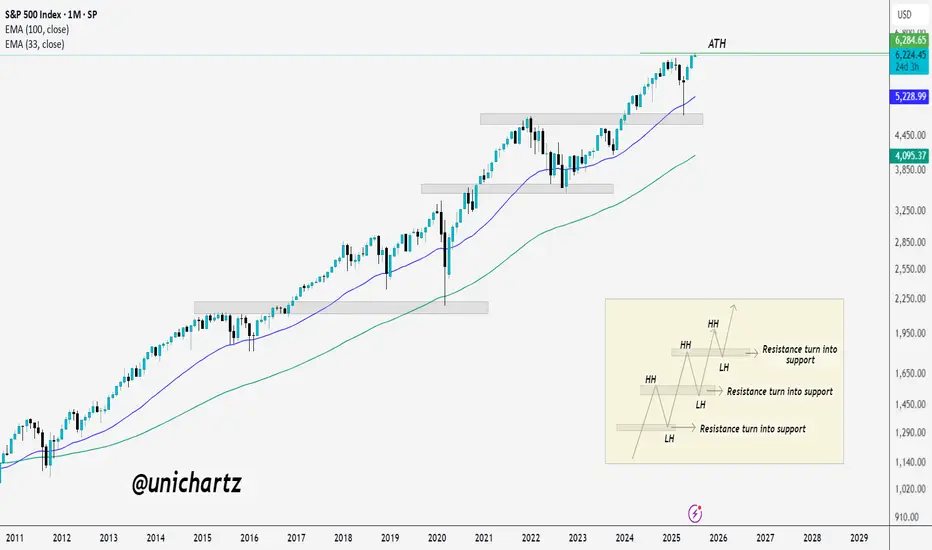
Decade-Long Uptrend Holds Strong – SPX Hits Fresh HighsS&P 500 Just Hit a New All-Time High (ATH) 🚀
The index has been in a strong uptrend for over a decade, consistently printing higher highs (HH) and higher lows (HL).
Every major resistance level has flipped into support, classic bull market structure.
Even during corrections, the 33 EMA and 100 EMA have acted like dynamic support zones.
Now that SPX has cleared its previous ATH, the structure remains intact, unless a strong breakdown occurs, momentum is still with the bulls.
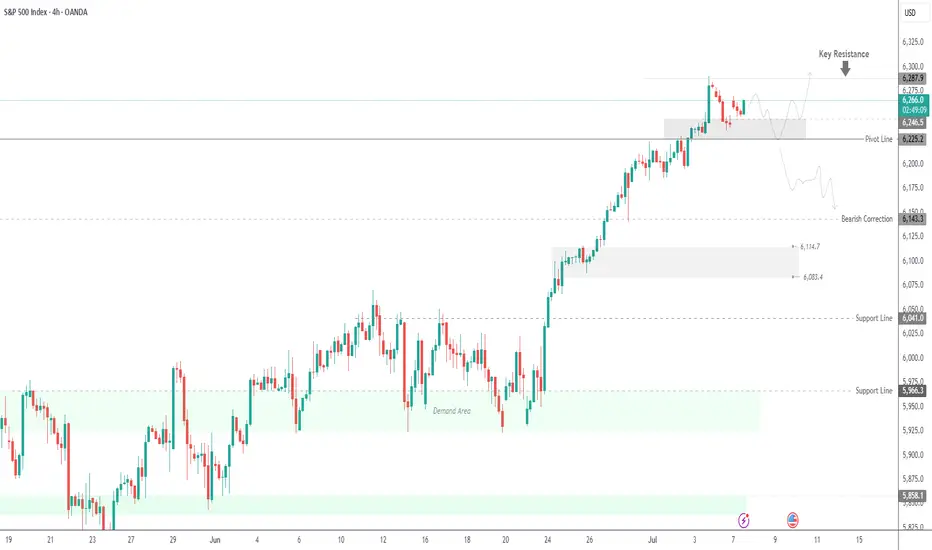
SPX500 Holding Bullish Structure – Eyes on 6287 BreakoutSPX500
The price maintains bullish momentum as long as it remains above 6225 and 6246.
Currently, the market is approaching the 6287 resistance level. A confirmed 4H candle close above 6287 is required to validate continuation of the bullish trend toward 6325.
However, a rejection from 6287 may trigger a short-term bearish correction, with potential pullbacks toward 6246 and 6225.
A sustained break below 6225 would shift the momentum to the downside, targeting the 6143 support level.
Pivot Level: 6264
Resistance: 6287 – 6325
Support: 6246 – 6225 – 6143
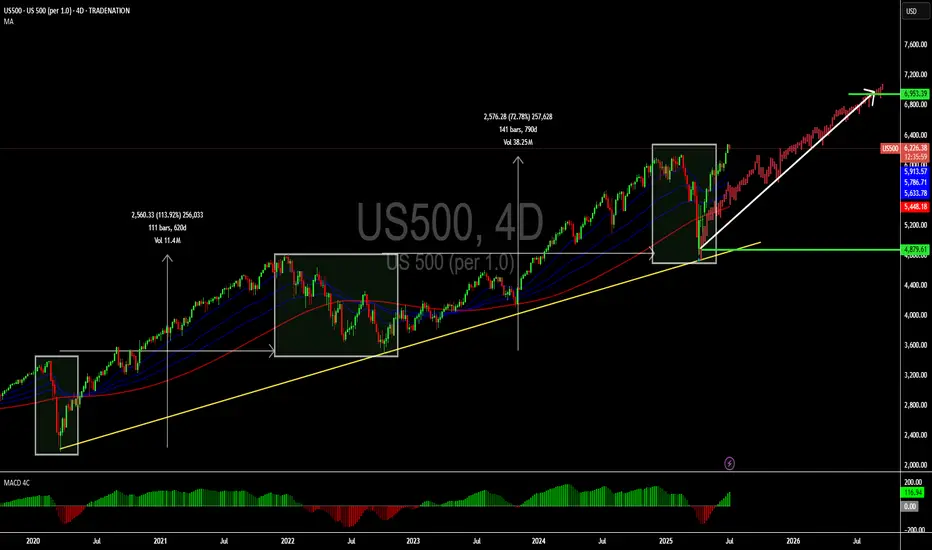
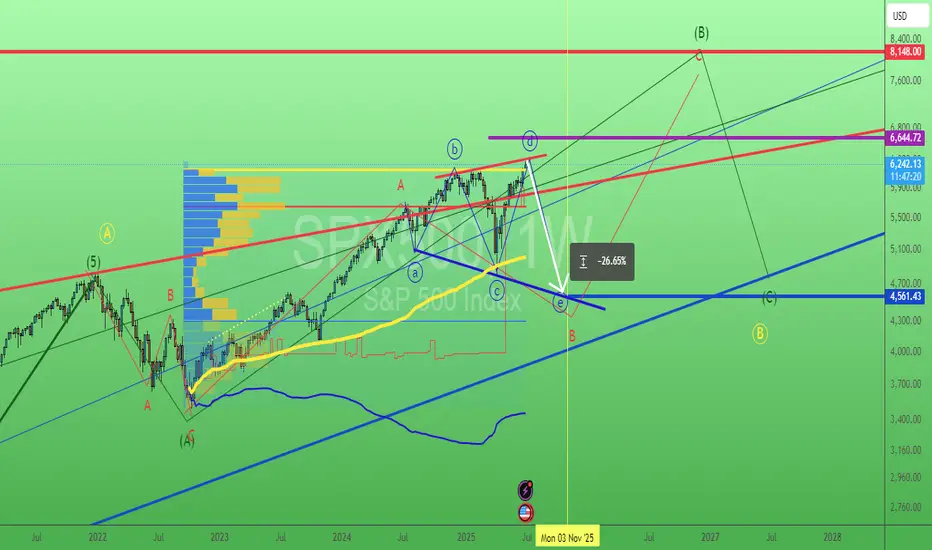
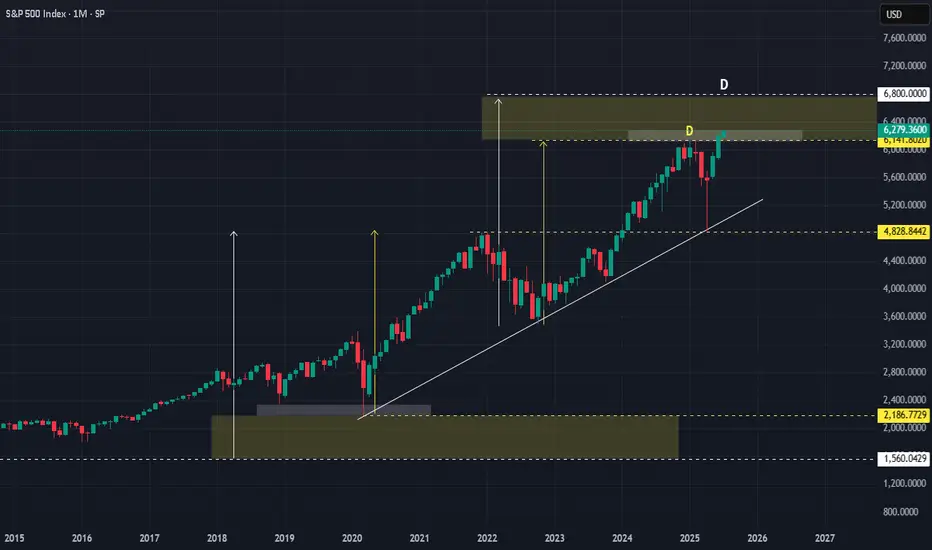
SPX : Next Stop @ 6800 :-)Since we are now expecting a delay in the FED cutting, there will be plenty of liquidity to spice things up.
The 'D' @ yellow had worked once before and since it has been 'used up' , its potency had been somewhat reduced.
But have no fear/worry, there would always be more 'D' ahead. The next one at 6,800
Good luck.
Dummy ideaFastest Way to Create an Idea on TradingView
Here’s a step-by-step guide to quickly publish an idea (analysis, chart, or setup) on TradingView:
1. Prepare Your Chart
• Open TradingView and set up your chart with all desired indicators, drawings, and timeframes.
2. Open the Publish Idea Window
• Shortcut: Press `Alt + P` on your keyboard to instantly open the “Publish Idea” window.
• Or: Click the Publish button at the top-right corner of your chart.
3. Fill Out the Required Fields
• Title: Enter a clear, descriptive title for your idea.
• Description: Write a brief explanation of your analysis or setup.
• Category: Select the appropriate category (e.g., Analysis, Tutorial).
• Direction: Mark your idea as Long, Short, or Neutral.
• Privacy: Choose Public or Private.
• (Optional) Add tags and related ideas for better visibility.
4. Publish
• Confirm you agree to the House Rules.
• Click Publish Idea.
Major resistance level for the S%P 500the s and p 500 have been on an uptrend but reems some correction might take place soon
July Doesn't Disappoint - S&P Nasdaq Dow Russell All RunningS&P All Time Highs
Nasdaq All Time Highs
Dow Jones closing in on All-Time Highs (and outperforming both S&P and Nasdaq recently)
Russell 2000 playing catch up and moving higher
This is melt-up at its finest
Since US/China Trade Agreement and Middle East Ceasefire Agreement, markets have used
these two events as further catalysts to continue the upside runs
Stochastic Cycle with 9 candles suggesting a brief pause or pullback in the near-term, but
a 3-5-10% pullback is still an opportunity to position bullish for these markets
I'm only bearish if the markets show that they care with price action. The US Consumer isn't breaking. Corporate Profits aren't breaking. Guidance remains upbeat. Trump is Pro Growth and trolling Powell on the regular to run this economy and market HOT demanding cuts (history says that's a BUBBLE in the making if it's the case)
Like many, I wish I was more aggressive into this June/July run thus far, but I'm doing just fine with steady gains and income trades to move the needle and still having plenty of dry powder
on the sidelines for pullbacks
Markets close @ 1pm ET Thursday / Closed Friday for 4th of July
Enjoy the nice long weekend - back at it next week - thanks for watching!!!
