SPX500 Holds Above 6,225 – Bullish Trend Intact for NowSPX500 Update – Bullish Pressure Holds Above Pivot
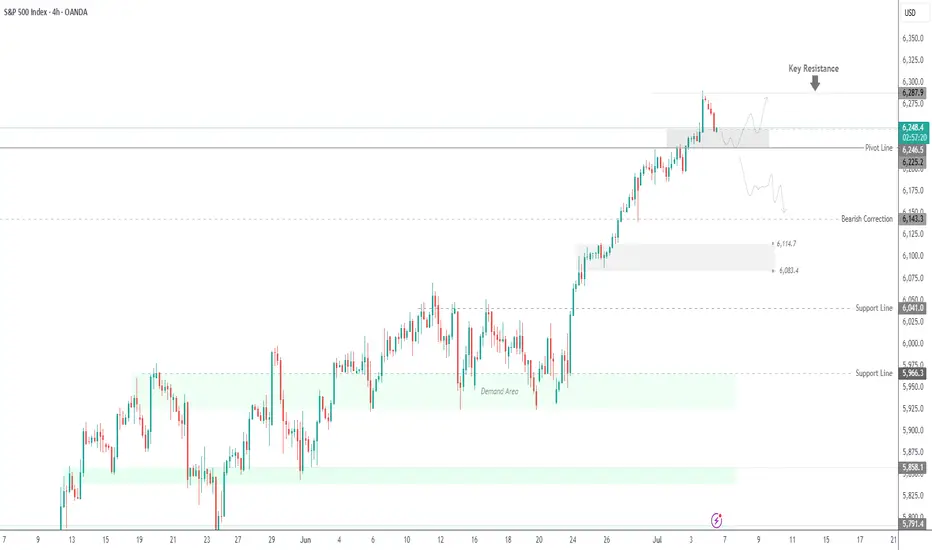
SPX500 continues to show bullish momentum, as highlighted in our previous analysis. The price remains supported by strong buying volume above the key pivot zone at 6,225.
As long as the price stays above this level, a retest toward 6,225 remains possible before another leg higher.
However, a confirmed break below 6,225 would signal potential bearish momentum and shift the short-term structure.
Key Levels:
• Pivot Line: 6,246
• Resistance: 6,265 / 6,287 / 6,325
• Support: 6,225 / 6,191 / 6,143
USA500 trade ideas
S&P 500 Hit Record High Ahead of Holiday BreakS&P 500 Hit Record High Ahead of Holiday Break
Today, financial markets in the United States are closed in observance of Independence Day. Investor sentiment was likely buoyed by the latest rally in the S&P 500 index (US SPX 500 mini on FXOpen), which set a new all-time high yesterday, surpassing 6,280.
The bullish momentum has been driven by robust labour market data in the US. According to ForexFactory, analysts had anticipated a rise in the unemployment rate from 4.2% to 4.3%, but instead, it unexpectedly declined to 4.1%.
Can the stock market continue to climb?
Technical Analysis of the S&P 500 Chart
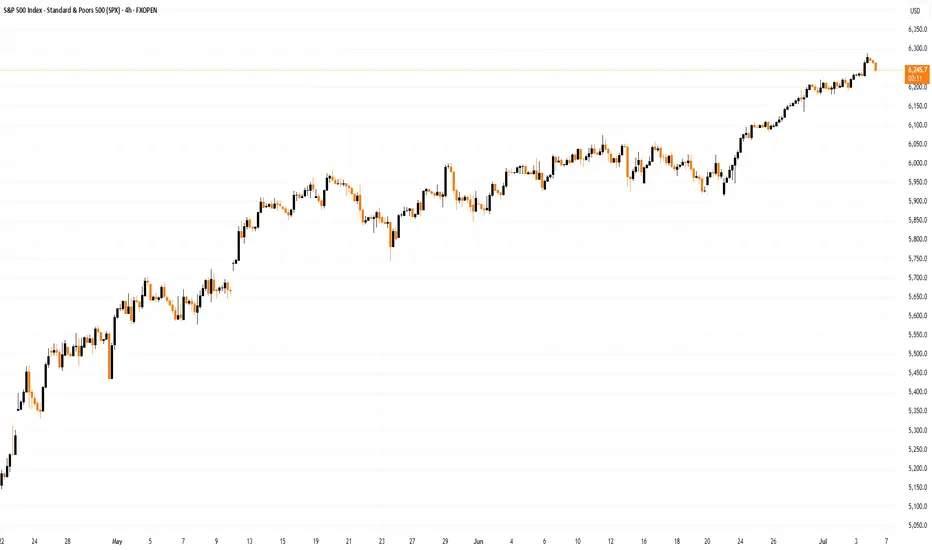
Analysing the 4-hour chart of the S&P 500 index (US SPX 500 mini on FXOpen)on 30 June, we observed the following:
→ An ascending channel was formed (indicated in blue);
→ A developing bullish impulse (marked with an orange line) suggested the price would move towards the upper boundary of the channel – a scenario that materialised with yesterday’s rally (as shown by arrow 1).
However, from a price action perspective, the recent downward move (arrow 2) has now gained significance. It may indicate that sellers are becoming more active around the identified resistance level.
Should the price decline towards the lower orange line, this could negate the current bullish impulse altogether, effectively reflecting a classic bearish engulfing pattern.
Given the above, there is reason to believe that bears are attempting to regain control after the S&P 500 (US SPX 500 mini on FXOpen) surged over 5% in the past 10 days. As such, a potential breakout below the orange line cannot be ruled out, with price action possibly targeting the median of the blue ascending channel.
What happens next?
The market’s trajectory will largely hinge on developments related to tariffs. Trade policy will remain in the spotlight next week, as key deadlines set by the White House approach — events that traders will be closely monitoring.
This article represents the opinion of the Companies operating under the FXOpen brand only. It is not to be construed as an offer, solicitation, or recommendation with respect to products and services provided by the Companies operating under the FXOpen brand, nor is it to be considered financial advice.
USA Economy Long-Term Outlook:The long-term outlook for the U.S. economy , as of mid-2025, is characterized by several key factors and some uncertainty, particularly around tariffs and monetary policy.
GDP Growth: The U.S. economy experienced a contraction in Q1 2025 (down 0.2-0.5% GDP), the first in three years, partly due to a surge in imports and a sharp cutback in consumer spending. Economists anticipate a bounce back in Q2 2025 (forecasted at 3% growth). However, the overall expectation for 2025 is for growth to decelerate significantly (e.g., Vanguard projects 1.5% GDP growth for year-end 2025, EY forecasts 1.5%, Trading Economics 1.7%, J.P. Morgan 2.1%). The second half of 2025 is expected to see a "pronounced demand cliff" due to front-loaded purchases ahead of anticipated trade restrictions.
Inflation: Tariffs are a significant factor impacting inflation. CPI growth is expected to average around 2.9% in 2025 and potentially accelerate to 3.2% in 2026, moderating to around 2.3% by 2029 (Deloitte). Core PCE inflation is expected to climb to the 2.8-3.0% range year-over-year in Q3 2025 - Q3 2026 as tariffs filter through the economy (University of Michigan). The Federal Reserve is closely watching tariff-induced price spikes.
Interest Rates/Monetary Policy: The Federal Reserve is likely on hold with interest rates for now, but two more rate cuts are anticipated later in 2025 if the labor market remains stable (Vanguard). Some forecasts suggest the Fed will resume cutting rates in July 2025, reaching a terminal range of 3.25-3.5% by mid-2026 (University of Michigan). However, the uncertainty around tariffs and their impact on inflation could influence the Fed's decisions.
Labor Market: The labor market has been cooling but remains stable. The unemployment rate is expected to increase throughout 2025, potentially reaching 4.3% (Morningstar), 4.7% (Vanguard), or even 4.8% by year-end (EY). Job gains are predicted to decelerate significantly in the second half of 2025 due to tariffs.
Tariffs: Tariffs are a major source of uncertainty. While some recent de-escalation in trade policy with China has led to positive revisions in the outlook, the long-term impact of tariffs remains a concern, with potential to lower GDP growth, raise inflation, and weaken the labor market. The expectation is that tariffs will be at least modestly higher than at the start of 2025.
In essence, the long-term economic forecast for the USA suggests continued growth, but at a more moderate pace than recent years, with ongoing vigilance required for inflation and labor market dynamics, heavily influenced by evolving tariff policies.
SPX500 at New ATH – Will NFP Fuel the Next Leg Up? SPX500 Outlook: Trade Optimism Fades as Focus Shifts to U.S. Jobs Data
Caution prevails ahead of today’s high-impact U.S. Nonfarm Payrolls report, which could be pivotal for the July rate cut narrative. A weaker print may support risk assets and push SPX500 higher, while a strong report could dampen momentum.
Technical Analysis (SPX500):
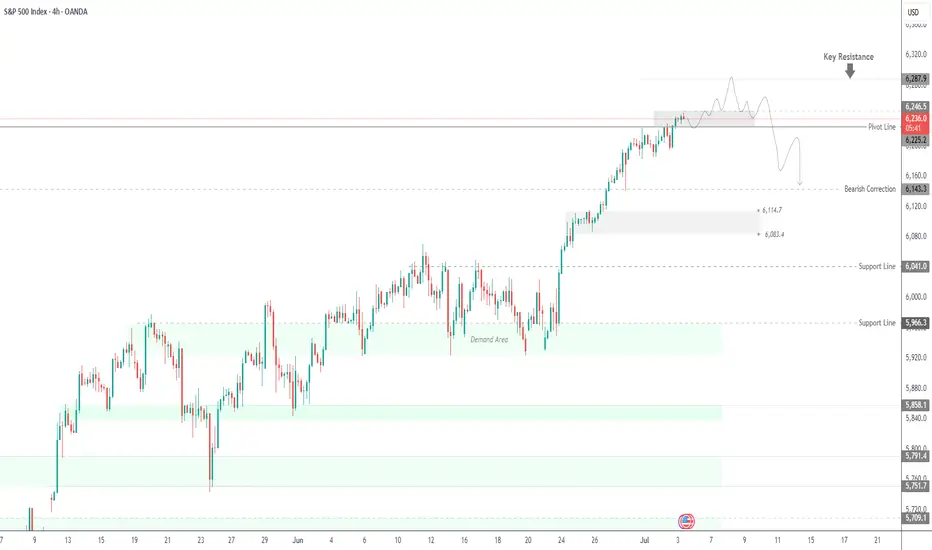
SPX500 has printed a new all-time high and is now targeting 6287, especially if the index closes above 6246 on the 1H chart.
As long as price holds above 6225 (pivot), the bias remains bullish, with potential upside targets: 6287 & 6325
However, a 4H close below 6213 would suggest a correction toward: 6190 & 6143
Key Levels:
• Resistance: 6287 / 6325
• Support: 6190 / 6143
Stay alert — today's NFP report could trigger major moves across indices and FX.
S&P500 bullish ahead of US employment- NFP numbersHouse Republicans moved Trump’s major tax and spending bill closer to a final vote, which could happen before his July 4 deadline. The package includes tax cuts, immigration funding, and the rollback of green energy incentives. Gamblers are raising concerns about a tax increase in the bill that could affect them.
In trade news, the US eased export rules on chip design software to China as part of an ongoing deal. China’s tone has shifted more positively, with a top official saying he’s hopeful about US-China relations and that conflict between the two is “unimaginable.”
At the Fed, Chair Jerome Powell hasn’t said if he’ll step down when his term ends in May, adding uncertainty. Trump, who wants a loyal replacement, has called for his resignation after a federal agency accused Powell of giving misleading testimony about expensive Fed building renovations.
On Wall Street, value investing made a comeback last quarter. Over 60% of active value fund managers beat their benchmarks by buying cheap industrial stocks and avoiding underperforming sectors like utilities and consumer staples.
Conclusion:
US equities are steady but cautious. Uncertainty around Fed leadership and Trump’s economic plans is keeping markets in check, while improving US-China trade relations and a shift toward value stocks are offering support.
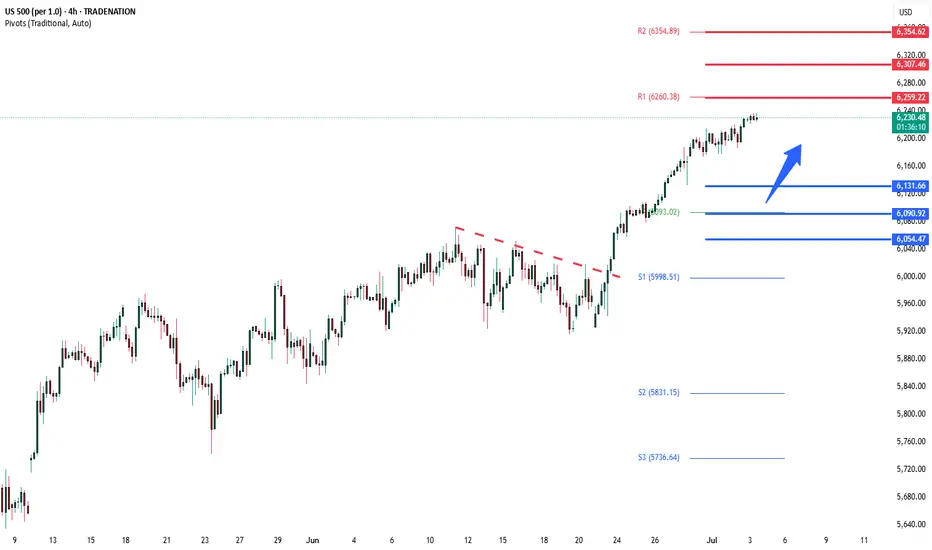
Key Support and Resistance Levels
Resistance Level 1: 6260
Resistance Level 2: 6307
Resistance Level 3: 6355
Support Level 1: 6130
Support Level 2: 6090
Support Level 3: 6055
This communication is for informational purposes only and should not be viewed as any form of recommendation as to a particular course of action or as investment advice. It is not intended as an offer or solicitation for the purchase or sale of any financial instrument or as an official confirmation of any transaction. Opinions, estimates and assumptions expressed herein are made as of the date of this communication and are subject to change without notice. This communication has been prepared based upon information, including market prices, data and other information, believed to be reliable; however, Trade Nation does not warrant its completeness or accuracy. All market prices and market data contained in or attached to this communication are indicative and subject to change without notice.

SPX500 LongThere is a lot of support at this level
There is a shark pattern on M15 and M30
All timeframes are oversold and there are multiple bottoms with divergence
This trade is with the trend
25 Pip stop loss
Bulls and Bears zone for 07-15-2025ETH session market is trading higher and expected to Open gap up.
Would traders be able to keep that momentum going rest of the RTH session.
Level to watch: 6328 --- 6330
S&P500 Bullish breakout supported at 6207Trump’s $3.4 Trillion Tax Plan
Favors wealthy investors: Tax burden shifts based on how you earn, not how much.
Winners: Business owners, investors, high-income earners.
Losers: Immigrants, elite universities.
Trade Tensions
EU Tariffs: Brussels targets $72B in US goods (e.g., Boeing, cars, bourbon) in response to Trump’s tariff threats.
Impact: Risk to transatlantic trade; US open to talks.
US-China Tech Relations
Nvidia: Resumes H20 AI chip sales to China after US approval—boosted chip stocks.
Trump: To announce $70B in AI & energy investments today in Pennsylvania.
Trend: Signs of easing tensions between US and China.
Earnings Focus: Big US Banks
Q2 results (JPM, Citi, WFC, BNY Mellon, BlackRock) will highlight:
Net interest income: How rate levels affect profits
Loan growth & credit quality: Signs of lending strength or weakness
Capital markets activity: Trading & investment banking trends
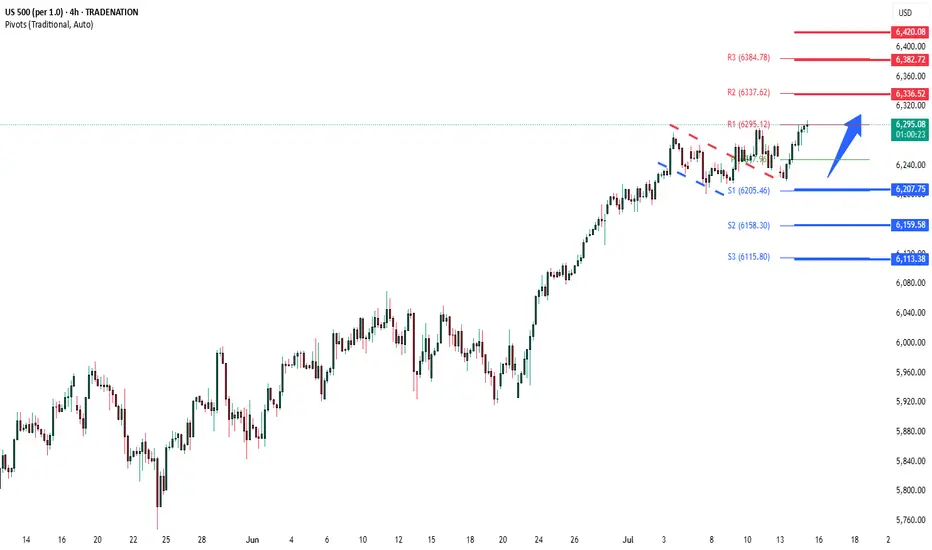
Key Support and Resistance Levels
Resistance Level 1: 6335
Resistance Level 2: 6380
Resistance Level 3: 6420
Support Level 1: 6207
Support Level 2: 6160
Support Level 3: 6115
This communication is for informational purposes only and should not be viewed as any form of recommendation as to a particular course of action or as investment advice. It is not intended as an offer or solicitation for the purchase or sale of any financial instrument or as an official confirmation of any transaction. Opinions, estimates and assumptions expressed herein are made as of the date of this communication and are subject to change without notice. This communication has been prepared based upon information, including market prices, data and other information, believed to be reliable; however, Trade Nation does not warrant its completeness or accuracy. All market prices and market data contained in or attached to this communication are indicative and subject to change without notice.
S&P 500: Defying Tariff Headwinds, Breaking RecordsThe S&P 500 has staged a remarkable rally in 2025, shattering all-time highs and capturing global attention. This surge has unfolded despite the negative economic overhang of renewed tariff threats and ongoing trade tensions, raising critical questions for investors: How did the market overcome such headwinds, and what lies ahead for both the short and long term?
The Rally Against the Odds
Tariff Turbulence: Earlier this year, President Trump announced sweeping new tariffs, sparking fears of supply chain disruptions and higher costs for American companies. Historically, such moves have triggered volatility and corrections.
Market Resilience: Despite these concerns, the S&P 500 not only recovered losses from the spring but surged to new record highs, with the index climbing over 23% since April’s lows. Major tech companies, especially those leading in AI and innovation, have been at the forefront of this advance.
Investor Sentiment: The rally has been fueled by optimism around potential Federal Reserve rate cuts, robust corporate earnings, and expectations of long-term economic growth—even as the immediate impact of tariffs remains uncertain.
Short-Term Correction: A Healthy Pause?
While the long-term outlook remains bullish, several indicators suggest the market may be due for a short-term correction:
Narrow Market Breadth: The current rally has been driven by a handful of mega-cap stocks, leaving the median S&P 500 stock well below its own 52-week high. Historically, such narrow leadership often precedes periods of consolidation or pullbacks.
Valuation Concerns: Stock valuations are at elevated levels, and some analysts warn that earnings growth could slow as companies adapt to higher input costs and shifting trade policies.
Correction Forecasts: Some strategists predict the S&P 500 could correct to around 5,250 by the third quarter of 2025, citing factors like slowing consumer spending and persistent policy uncertainty.
Long-Term Outlook: Higher Highs Ahead
Despite the potential for near-term volatility, the long-term trajectory for the S&P 500 remains positive:
Fed Policy Tailwinds: Anticipated rate cuts and lower bond yields are expected to provide further support for equities, encouraging risk-taking and higher valuations.
Corporate Adaptation: Companies are actively offsetting tariff impacts through cost savings, supply chain adjustments, and strategic pricing.
Growth Sectors: Innovation in technology, productivity gains, and deregulation are setting the stage for sustained profit growth, especially in sectors like AI, robotics, and defense.
Key Takeaways for Investors
Stay Disciplined: While a short-term correction is possible, history shows that markets often rebound strongly after periods of volatility.
Diversify Exposure: With market gains concentrated in a few names, diversification and active stock selection are more important than ever.
Focus on Fundamentals: Long-term investors should look beyond headlines and focus on companies with resilient earnings and adaptive business models.
The S&P 500’s ability to break records in the face of tariff headwinds is a testament to the underlying strength and adaptability of the U.S. economy. While short-term bumps are likely, the path ahead still points toward new highs for those with patience and perspective.
This article is for informational purposes only and does not constitute investment advice. Always consult with a financial advisor before making investment decisions.
#spx500 #stockmarket #analysis #economy #us #nasdaq #fed #bonds #rates #trading

S&P500 Slips Ahead of CPI & Earnings SeasonEquities began the week under pressure, with the S&P 500 dropping 0.5%, slipping below the 6,230-resistance area. Although the Fed minutes released last week indicate that most members are open to cutting rates this year, inflation data and second-quarter earnings could change that trajectory.
Upcoming Events to Watch:
• CPI Release (Tuesday 14:30 SAST): A cooler-than-expected print would support a breakout in risk assets. A hot reading could shift expectations toward policy tightening, weighing on equities.
• Q2 Earnings Season: Major banks including JPMorgan Chase, Wells Fargo, and Citigroup will report this week. Strong earnings may cushion the market, while any weakness could exacerbate volatility.
S&P500 Technical View:
• Immediate Resistance: 6,230
• Potential Upside: A cooler CPI could see the index rally toward 6,290.
• Support Levels: Should inflation surprise to the upside, the index may slide to 6,190, or even 6,150 in extended selling.

SP500, above the GAP bullish, below the GAP…As simple as it can be. Below the GAP, very bearish.
Ideally, a sharp move down would confirm
My bias.

$SPXSP:SPX Update:
Rumors of Powell possibly resigning as Fed Chair have created uncertainty among buyers.
But if inflation stays low even with tariffs we might see longer holds.
If Powell does step down, markets could actually rally on hopes of upcoming rate cuts.
📉📈
Now we wait for the inflation report…

SPX500USD | Retesting All-Time HighsThe index has extended its bullish rally, printing a new local high at 6,286.5 before showing signs of slight hesitation with consecutive small-bodied candles.
Support at: 6,134.5 / 6,026.0 / 5,926.2 🔽
Resistance at: 6,286.5 🔼
🔎 Bias:
🔼 Bullish: Sustains above 6,134.5 and breaks 6,286.5 for new highs.
🔽 Bearish: Break below 6,134.5 could trigger a retracement toward 6,026.0.
📛 Disclaimer: This is not financial advice. Trade at your own risk.

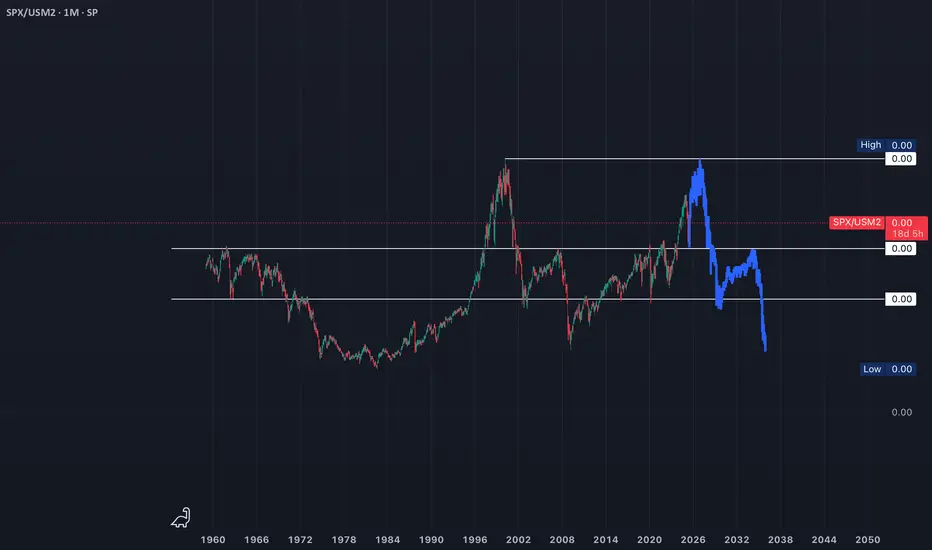
Is SP500 / US M2 Money Supply telling us a story?Historically this ratio has inflected from key levels. Last week the upper boundary of what 8 would call a normal range has acted as support. If history rhymes to dot com bubble, this AI bubble can bounce from these levels and see an increase until Q4 2026, then a sharp fall will follow. To the lower boundary of that normal range.
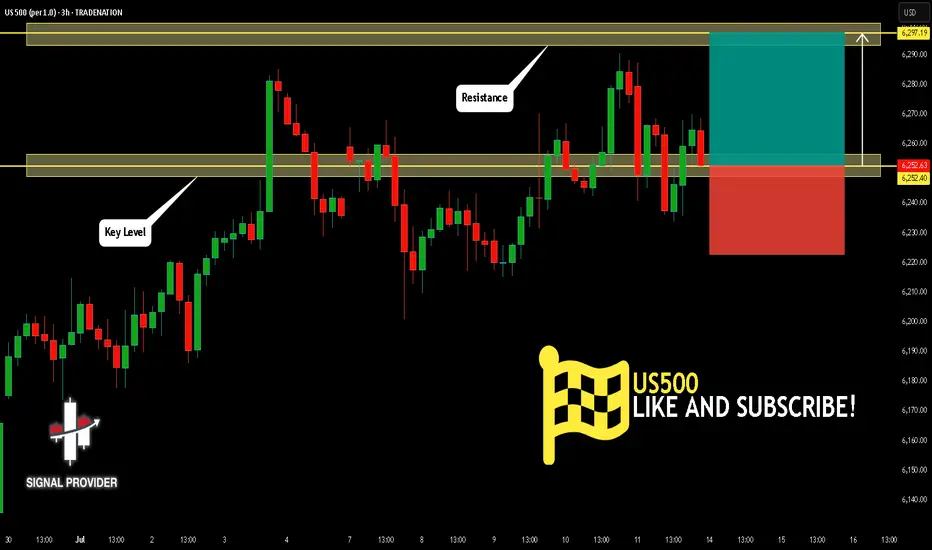
US500 Is Bullish! Long!
Here is our detailed technical review for US500.
Time Frame: 3h
Current Trend: Bullish
Sentiment: Oversold (based on 7-period RSI)
Forecast: Bullish
The market is trading around a solid horizontal structure 6,252.40.
The above observations make me that the market will inevitably achieve 6,297.19 level.
P.S
Overbought describes a period of time where there has been a significant and consistent upward move in price over a period of time without much pullback.
Disclosure: I am part of Trade Nation's Influencer program and receive a monthly fee for using their TradingView charts in my analysis.
Like and subscribe and comment my ideas if you enjoy them!
SPX500 SPX appears to be running SSL. 4H levels identified. Looking for Break & retest. If support does not hold on to any level, expect the bulls to return and take over.

SPX Breakdown or Another Push Higher?Hi y'all thanks for tuning in! Here are a few written notes to sum up the video.
Indecision at New Highs
After breaking out to new all-time highs, SPX printed a doji on the weekly chart, signaling indecision. This hesitation could mark the start of digestion.
Still Structurally Bullish, but Extended
The weekly chart shows SPX is still holding trend structure, but price is notably extended from the 10EMA. Historically, when price moves too far from key short-term EMAs, it tends to reset either via time (sideways chop) or price (pullback).
Daily Chart Shows a Shelf Forming
On the daily chart, price has been consolidating just under the prior high with small-bodied candles. This is forming a “shelf” around the 6,260–6,280 zone. It’s acting like a pause, not a breakdown. Holding above this zone keeps the trend intact.
Pullback Risk Increases Below 6,232
If price loses 6,232 (last week's breakout area and short-term shelf), it increases the likelihood of a pullback toward the 6160 or even deeper toward the 5970. That lower zone also marks the bottom of the prior consolidation box from earlier this year.
Seasonality Reminder
Historically, July is strong in the first half, with weakness (if it shows up) arriving mid-to-late month. So far, price has tracked that seasonal strength. Any weakness from here would align with that typical timing.

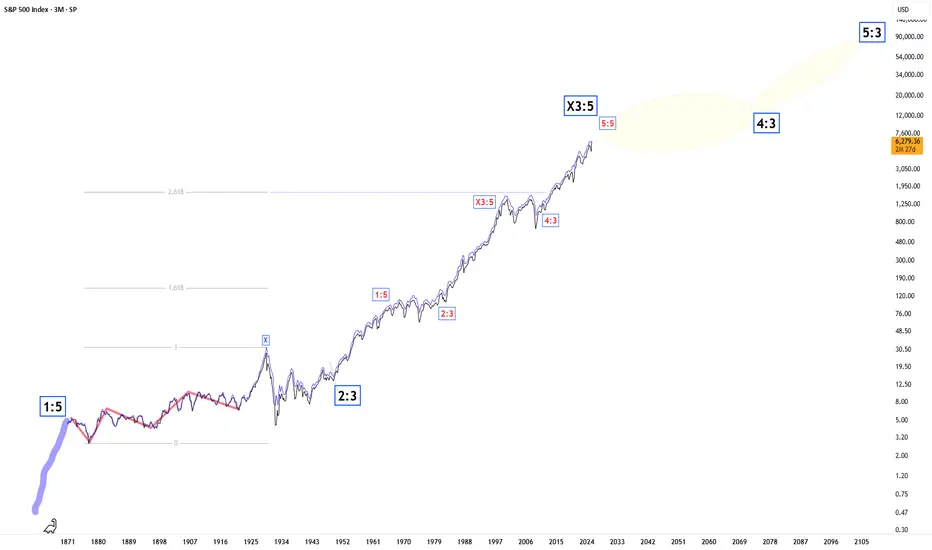
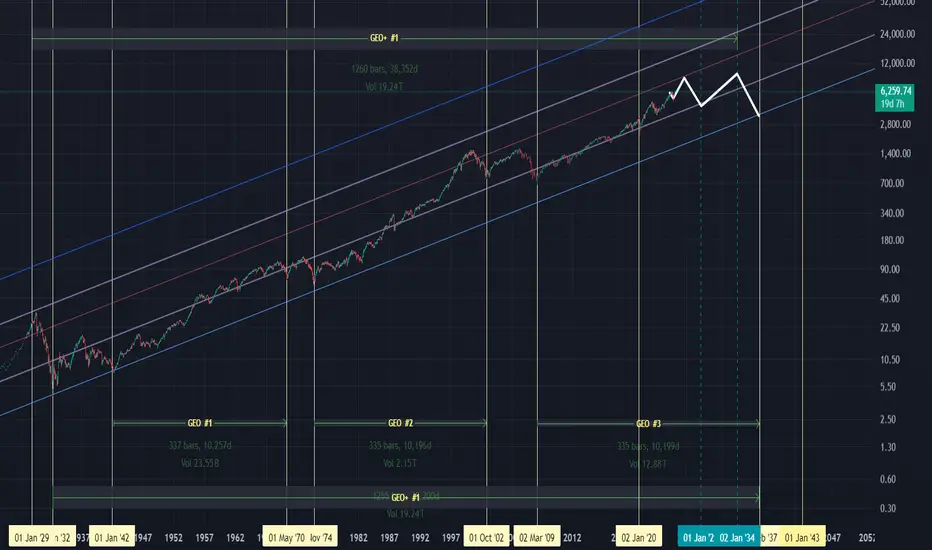
SPX GEO+ Cycle Update: "SPX: April Low Called, Target 8000+"SPX GEO+ Cycle Update: April Low Called Precisely (Next Target: 8000)
On January 5th, 2025, when SPX was trading at 5942, I published an analysis in Italian using my GEO+ Cycle methodology that made two specific projections:
📉 A low around 5000 in April 2025
📈 Then an advance targeting 8000 by 2026
Update: April delivered exactly as projected.
The geometric patterns suggested April would mark a significant turning point, and the market found strong support right in the anticipated zone and timeframe.
About GEO+ Cycles:
After 15 years studying market geometry, I've developed a framework that identifies multi-decade structural patterns. These aren't traditional technical indicators—they're mathematical relationships that help project major turning points with remarkable precision.
Current Phase:
We're now in the advancing phase of this cycle. Based on geometric projections, the target window for 8000 remains January 2026.
Important Context:
This represents cycle analysis for educational purposes, not trading advice. The methodology focuses on identifying major structural turning points rather than short-term movements.
What's Next:
I'll continue tracking this cycle's development and provide updates as we approach key geometric levels.
For those interested in learning more about geometric market analysis, feel free to follow for updates on this and other cycle progressions.
The mathematics of market geometry continue to unfold...
Note: Originally published in Italian, now sharing these insights with the global TradingView community.
Macroeconomic analysis of the American marketHello investor friends,
today I bring an update on the macro economic state of the American economy which generally moves markets around the world.
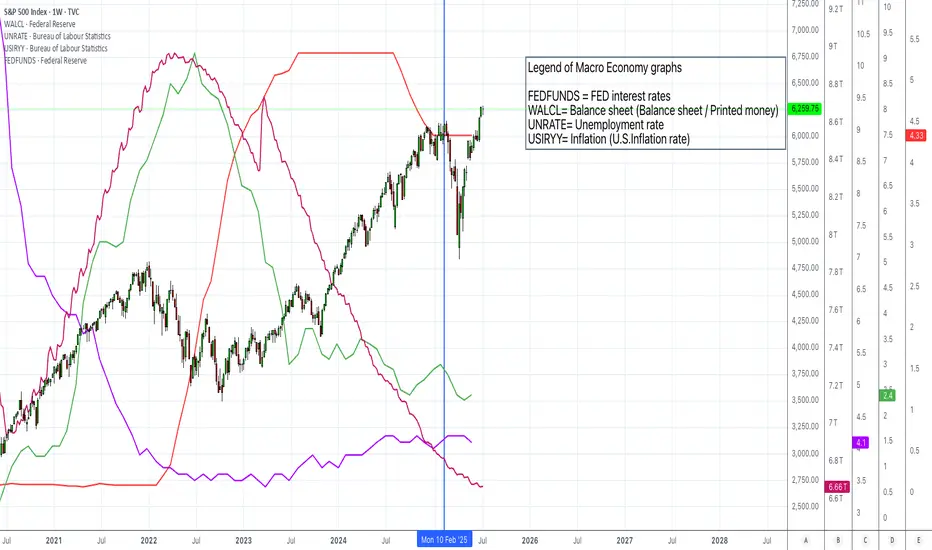
From the graph we can see the S&P 500 index on which 4 lines have been superimposed which coincide with:
- FED interest rate
- FED balance sheet
- US inflation rate
- US unemployment rate
The vertical line on the graph coincides with the date of the last update I made 5 months ago.
The central bank decides interest rates and the injection of money with the aim of keeping inflation low and avoiding too much unemployment.
At the moment we have:
- Unemployment rate at 4% (remained unchanged)
- Inflation at 2.4% (decreased compared to 5 months ago)
- The balance / release of printed money (continues to fall)
- The interest rate remained unchanged (current 4.33%)
Compared to 5 months ago the situation seems to have improved and is quite stable. The FED has decided to keep rates unchanged due to political issues as it would like to see clearly before making cuts.
In general we can say that the situation seems quite good as, unemployment is low, inflation is at optimal levels, we see that the budget/money injection is decreasing and therefore leads to maintaining regular inflation and finally the interest rates being stable maintain a low level of unemployment.
Given these factors we see that since the last update 5 months ago (i.e. in February), in the following weeks there was a collapse due to Trump's policies but that it was certainly an excellent opportunity to increase positions given that the macroeconomic situation was positive as it currently is.
From today we could certainly expect further declines due to other monetary policies or other news, but as long as the macro situation is positive we have no reason to worry.
👍 Like if you want more macro updates in the future
🙋♂️ Follow me so you don't miss my future analyses
⚠️ Disclaimer: This post is for informational purposes only and does not constitute financial advice. Always do your research before making investment decisions.
SP:SPX FRED:SP500 VANTAGE:SP500 AMEX:SPY VANTAGE:DJ30 AMEX:DIA CME_MINI:NQ1! FX:NAS100 NASDAQ:QQQ FX:EUSTX50 FOREXCOM:GER40 FX:AUS200
Possible Wyckoff top on US500I'll be looking for this wyckoff formation on US500.
Of a new ATH is forming in the next few days and we have a stong sell off, I'll be taking the short on the Test of the Spring.

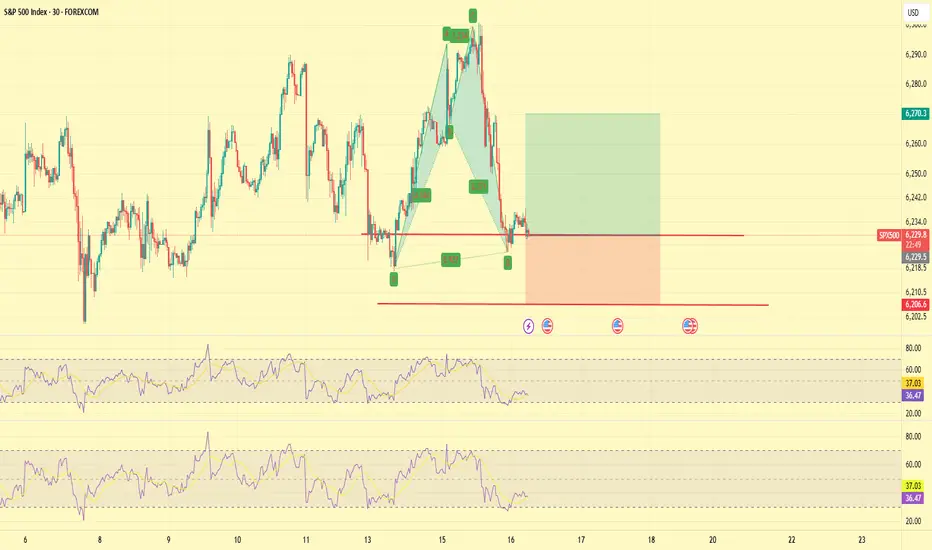
SP500 TECHNICAL ANALYSIS 30 MINUTE TIME FRAME 📊 Technical Analysis – SP500 CFD (30-Minute Chart)
✅ 1. Overall Market Trend:
The market is currently in a range-bound structure after a sharp upward move toward the 6,296 level.
Price entered a clear supply zone and reversed sharply.
Multiple BOS (Break of Structure) and CHoCH (Change of Character) events indicate clear shifts in price behavior.
📌 2. Key Structure Zones:
🟩 Demand Zones:
6,240–6,250: First active demand zone — could trigger bullish reactions.
6,180–6,200: Deeper liquidity zone within the Discount area, ideal for long setups if tested.
Price is approaching equilibrium and preparing for a potential reaction.
🟥 Supply Zones:
6,290–6,300: This premium zone caused the recent rejection and is currently acting as short-term resistance.
📈 3. Price Action & Candles:
Price created a rising wedge near the highs, which broke down.
Strong bearish candles followed, breaking key short-term structure levels.
Price is now heading into the equilibrium zone and testing demand.
📌 4. Possible Scenarios:
🔻 If Price Falls:
Watch for a reaction at the 6,240–6,250 demand zone.
If this area breaks, the next downside target is 6,180–6,200 — a high-probability liquidity zone.
🔺 If Price Rebounds:
A bullish reaction from the current zone could send price back toward 6,270+.
A confirmed break of 6,296 would open the door to higher highs.
🧠 Summary Table:
Condition Analysis
Current Status In corrective phase after bullish impulse
Short-Term Trend Bearish structure active (BOS, CHoCH present)
Key Support 6,245 → 6,180
Key Resistance 6,290–6,300
Buy Opportunity Bullish confirmation at demand zones
Sell Opportunity Weak reactions or breakdowns below BOS
⚠️ Disclaimer:
This analysis is for educational purposes only and does not constitute financial advice or a buy/sell signal.
Always trade based on your personal strategy and risk management plan.
VANTAGE:SP500

SPX500 RallyThe SPX500 price will drastically grow in the coming days. Price has broken out a bullish flag pattern. We may anticipate and enter on the retest around 6230
