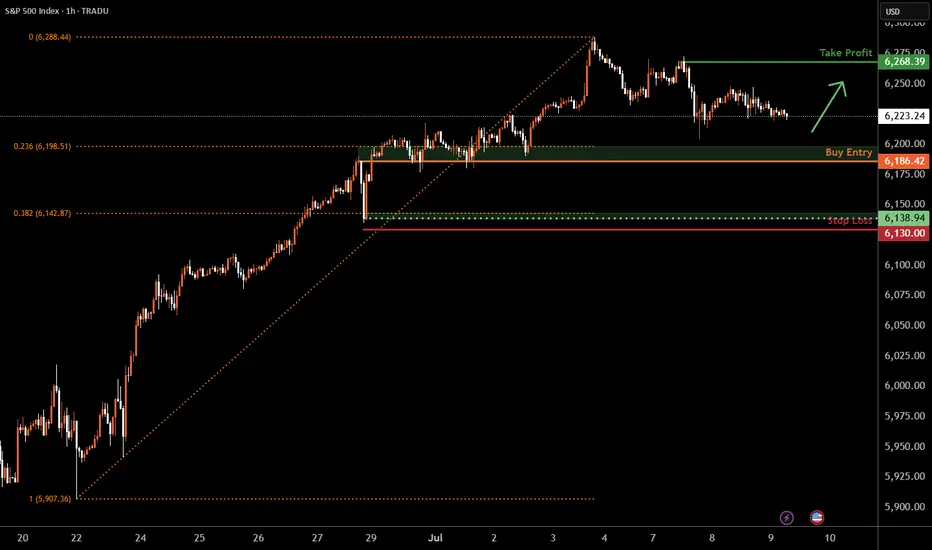
S&P 500 H1 | Falling toward an overlap supportThe S&P 500 (SPX500) is falling towards an overlap support and could potentially bounce off this level to climb higher.
Buy entry is at 6,186.42 which is an overlap support that aligns with the 23.6% Fibonacci retracement.
Stop loss is at 6,130.00 which is a level that lies underneath a swing-low support and the 38.2% Fibonacci retracement.
Take profit is at 6,268.39 which is a swing-high resistance.
High Risk Investment Warning
Trading Forex/CFDs on margin carries a high level of risk and may not be suitable for all investors. Leverage can work against you.
Stratos Markets Limited (tradu.com ):
CFDs are complex instruments and come with a high risk of losing money rapidly due to leverage. 63% of retail investor accounts lose money when trading CFDs with this provider. You should consider whether you understand how CFDs work and whether you can afford to take the high risk of losing your money.
Stratos Europe Ltd (tradu.com ):
CFDs are complex instruments and come with a high risk of losing money rapidly due to leverage. 63% of retail investor accounts lose money when trading CFDs with this provider. You should consider whether you understand how CFDs work and whether you can afford to take the high risk of losing your money.
Stratos Global LLC (tradu.com ):
Losses can exceed deposits.
Please be advised that the information presented on TradingView is provided to Tradu (‘Company’, ‘we’) by a third-party provider (‘TFA Global Pte Ltd’). Please be reminded that you are solely responsible for the trading decisions on your account. There is a very high degree of risk involved in trading. Any information and/or content is intended entirely for research, educational and informational purposes only and does not constitute investment or consultation advice or investment strategy. The information is not tailored to the investment needs of any specific person and therefore does not involve a consideration of any of the investment objectives, financial situation or needs of any viewer that may receive it. Kindly also note that past performance is not a reliable indicator of future results. Actual results may differ materially from those anticipated in forward-looking or past performance statements. We assume no liability as to the accuracy or completeness of any of the information and/or content provided herein and the Company cannot be held responsible for any omission, mistake nor for any loss or damage including without limitation to any loss of profit which may arise from reliance on any information supplied by TFA Global Pte Ltd.
The speaker(s) is neither an employee, agent nor representative of Tradu and is therefore acting independently. The opinions given are their own, constitute general market commentary, and do not constitute the opinion or advice of Tradu or any form of personal or investment advice. Tradu neither endorses nor guarantees offerings of third-party speakers, nor is Tradu responsible for the content, veracity or opinions of third-party speakers, presenters or participants.
USA500 trade ideas
BuyHigher Time Frame Reject Level
Bullish Previous Week
Market Structure Shift Bullish
Asian Session
Trade
Manage
Smile

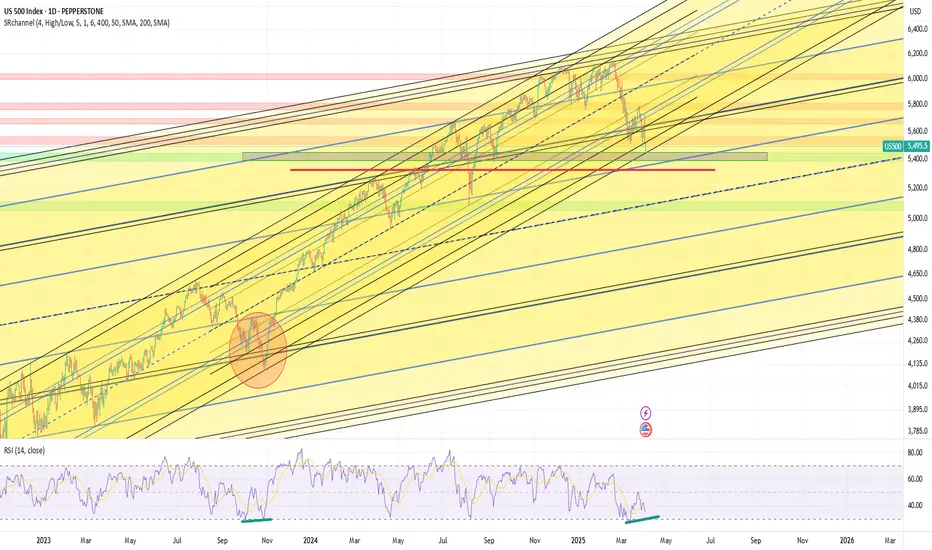
Logarithmic channelsThe price has reached a support area at the bottom of the long-term logarithmic channel. If this area will not hold the price I see a possible spike to 5330 level which is 1.618 retracement of March 13 bottom - March 25 top. The price did the same retracement in October 2023. Pay attention that we have 1d positive divergence forming on RSI. We are bottoming, a crash is unlikely right now. The reversal will most likely happen this week.
Gold Bullish for 2 months followed by 3 months of Bearish?An interesting pattern developed on Gold for the monthly that could indicate 2 months of Bullish order flow to 3600 - 3800 area followed by 3 months of bearishness to 3000 - 3100 area.

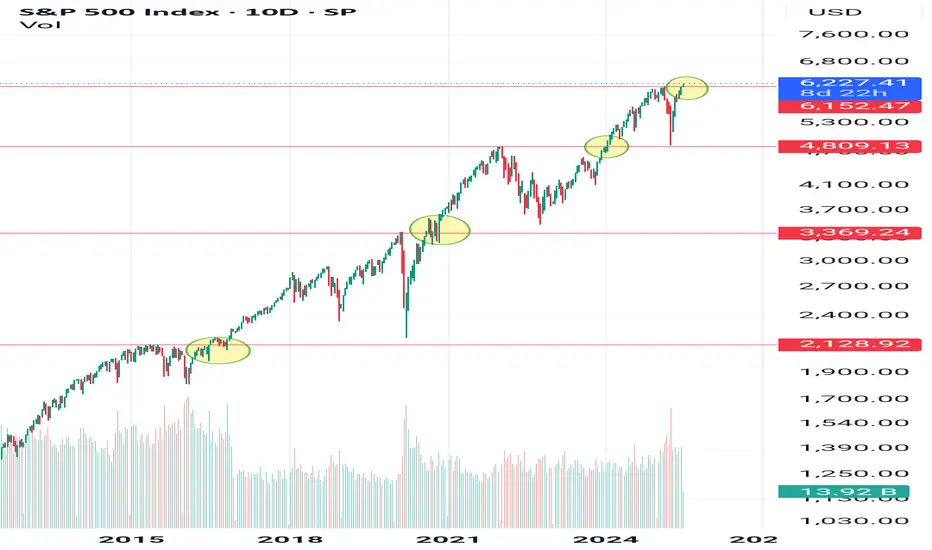
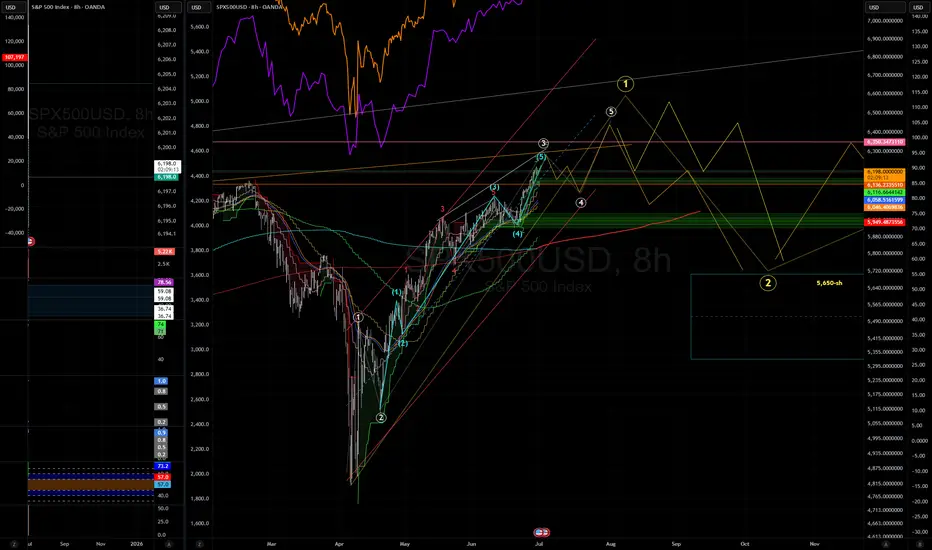
SPX to 7450?Looking at the long term chart starting from the covid crash we can see 2 impulse of average 2650 pts and two retracement, so from the trump crash to 4800 we could see one last bullish impulse of around 2650 pts to target 7450 in autumn.
Now I expect a retracement to 5965-5970 area before last bullish impule

Nonfarm Payroll and some other news 03.07.2025Nonfarm Payrolls surprisingly turned out to be moderate. These are excellent arguments for the Fed not to touch the rate, since labor market is their main mandate along with inflation.
At the same time, stock market is showing steady growth and overheating in some places.
What should the US economy be saved from by lowering the Fed rate?
From Trump's future decisions, or create an influx of liquidity for a good picture so that Trump can further report on GDP growth?
These questions should be asked by engaged Fed chairman.
At 5:00 PM, an interesting ISM services report was released: the growth of new orders against background of falling employment immediately makes us wonder why then such a level of applications to Nonfarm.
The answer is simple, Elon Musk fired a lot of employees during his short career in the White House.
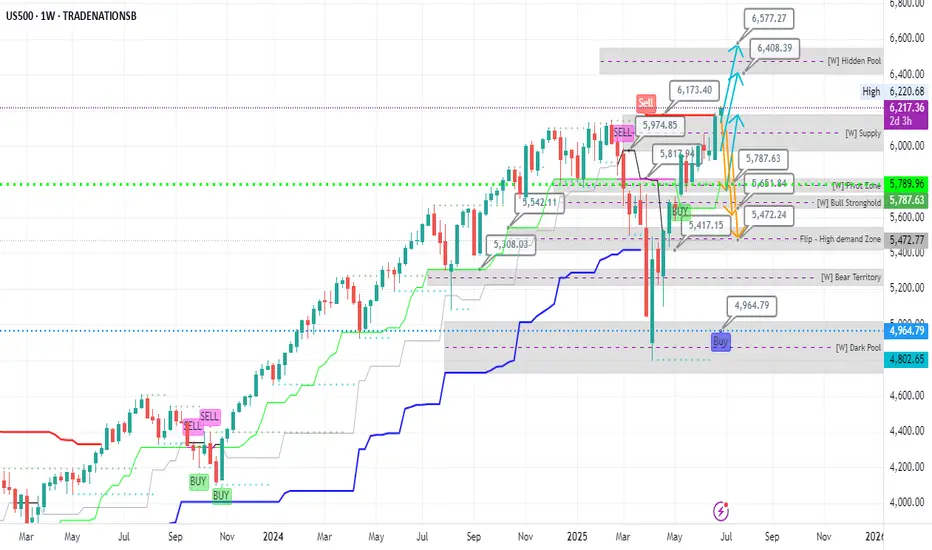
How High is High Enough - welcome to the Void & VanityUS500 | ATH Extension and Rebalancing Outlook
What is going on beyond the surface? – Here is how I will anticipate next move.
Today , price carved a new All-Time High (ATH) , extending beyond Monday’s peak and breaching the previously defined Sell Limit Bound at 6173 .
6173 level capped prior upside and served as the structural ceiling on the weekly timeframe – would demand balance.
While price has cleared 6173 , failure to retain acceptance above it raises the possibility of a rebalancing phase —necessary before any sustainable bullish expansion. This retracement, if triggered, would offer clarity on whether this breakout is a continuation or merely a premature exploration into thin liquidity.
📌 Key Observations:
• 6173 – Breached, but yet to prove retention. A weekly close and reaccumulation above here is required to maintain bullish momentum.
• 6577–6408 – Marked as a hidden liquidity pool and potential upside target zone. Price may hunt for this range, but only if it holds structurally above 6173.
• Below 6173 – Failure to anchor here may trigger a rebalance into prior value areas before any serious upside projection takes form.
Price must find equilibrium before the next leg. Any upside without that balance risks collapsing under its own weight.
#SPX500 Buy 6205.8#SPX500 Buy 6205.8
SL 6145.8
TP 6225.8
TP 6305.8
TP 6445.8
Trade at your own risk
Protect your capital
The Wizard 🧙♂️ SWFX

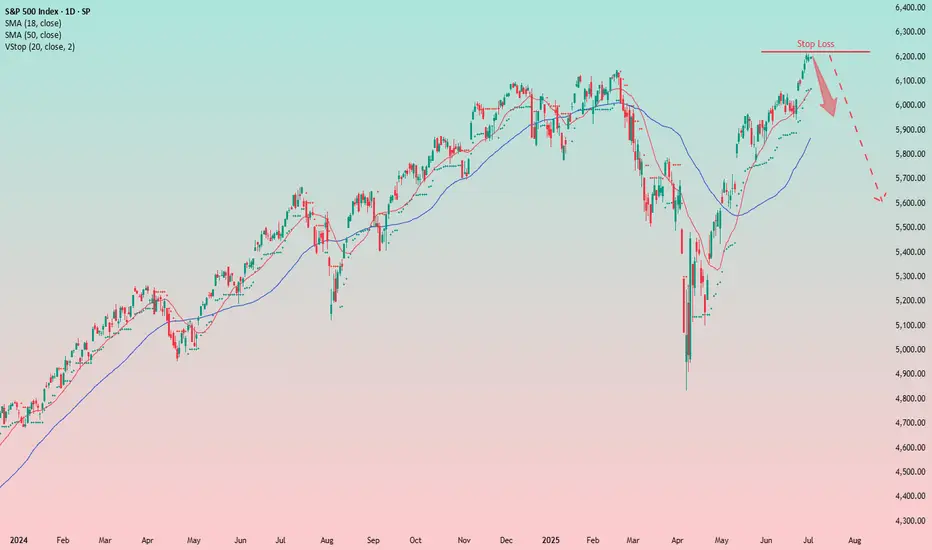
Bearish Outlook on the S&P 500: Time to Get ReadyFrom a long-term perspective, I see a short setup building on the S&P 500 index. The anticipated rate cuts in the U.S. — which I believe are coming soon — have historically led to market declines, despite the common perception that lower rates are bullish for equities.
Additionally, the market appears overheated: P/E ratios are at extreme highs, more than 50% above historical averages.
Given this, I expect we’ll see a downside move soon.
Since markets tend to rise slowly but fall quickly, I’m beginning to build a short position in advance. Stops may get hit, and re-entries might be necessary, but overall I see more reasons supporting this thesis than contradicting it.
Bulls and Bears Zone for 07-02-2025S&P keeps going higher after new ATH high earlier this week. Markets could go higher for a while if we see any pullback.
Level to watch: 6232 ---6234
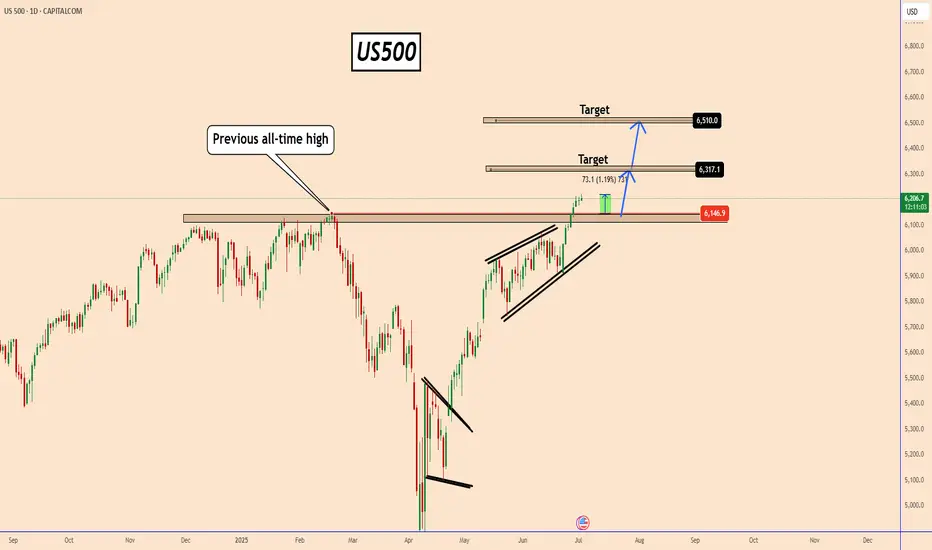
US500 Eyes 6317 and 6510 After Historic BreakoutUS500 Eyes 6317 and 6510 After Historic Breakout
The US500 has broken out above its previous all-time high near 6147, following news of a ceasefire agreement between the U.S., Israel, and Iran.
Since then, equity markets have surged, with indices leading the rally.
US500 has now reached a fresh all-time high at 6220, confirmed by a strong weekly candle close above the former peak, adding technical value to the breakout.
Looking ahead, the US500 appears poised to extend its gains toward the 6317 and 6510 levels on the daily chart.
A stronger-than-expected Non-Farm Payroll (NFP) report could further fuel this bullish momentum.
You may find more details in the chart!
Thank you and Good Luck!
PS: Please support with a like or comment if you find this analysis useful for your trading day
Wind of Change - VOO ETFPlease watch this interesting article and feel the cool nice breeze blowing along...........
Nice , isn't it ?
As I read this article, I can't help as if a REAL giant fan was blowing at me although I know it is not REAL, just an image in my mind, magnified by the LED image and the sound as well.
And for a moment, I allowed it to play with my mind and instantly, I felt cooler.........
It is the same for reporters/journalists worldwide who made a living covering news and writing sensational news headlines to capture your eyeballs. Although we are not in Israel/Iran war, we too feel the pain and tragedy suffered by the innocent people.
How about the numerous floods happening in China ? I can't help but feel a sense of gratitude for where I am born - Singapore , free from natural disasters.
It is the same as INVESTING/TRADING. If you look at your P&L statement on a daily/hourly basis, it somehow spurs you to take an impulsive action. This is especially if you have lost some money and you wanted to quickly recover your losses. On one hand , you wanted it to go along but afraid the pullback may be too strong and your profits turn to losses again.
I remembered the book I read about - it says yesterday result was history. Whatever had happened , leave it there. Today is a fresh start and if you want to trade, you must have a brave heart and start afresh , look at your available capital (not including what you had lost) and do what you are supposed to do in the moment.
Social media is a double edge sword and every day, there are doomsday porns including marketing gurus telling you that the stock market is overvalued, tariffs this , tariffs that and you should sell. Did you ?
And there are also Asia bulls or rather China bulls that claims US funds are shifting to China and the price is going to the moon. I have often said treat this as entertainment , as reference but do your own due diligence.
A safer and lower risk is to get exposed to the VOO ETF where it is more diversified and you need not worry about a single company performance dragging the rest down.
Position sizing is also important - just because you had made some money (could be luck), it does not mean you should increase your position size (increase in risk) due to your greed. Consistency is the game in trading not BIG IN BIG OUT.

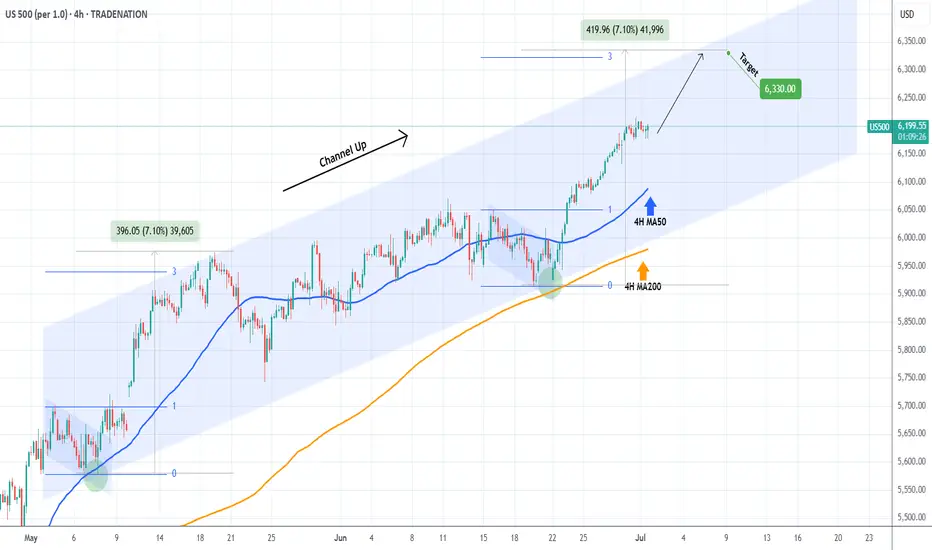
S&P500 Bullish Leg not over yet.The S&P500 index (SPX) has been trading within a Channel Up since the May 07 Low and is currently unfolding the latest Bullish Leg.
As you can see, it is far from having topped, not just by a plain trend-line (Higher Highs) perspective but also based on the Fibonacci and % rise terms relative to the previous Bullish Leg.
That peaked after a +7.10% rise, a little above the 3.0 Fibonacci extension. As a result, a 6330 Target on the short-term is more than fitting.
-------------------------------------------------------------------------------
** Please LIKE 👍, FOLLOW ✅, SHARE 🙌 and COMMENT ✍ if you enjoy this idea! Also share your ideas and charts in the comments section below! This is best way to keep it relevant, support us, keep the content here free and allow the idea to reach as many people as possible. **
-------------------------------------------------------------------------------
Disclosure: I am part of Trade Nation's Influencer program and receive a monthly fee for using their TradingView charts in my analysis.
💸💸💸💸💸💸
👇 👇 👇 👇 👇 👇
The market bias stays up, MJ stocks may be a buy here. The market continues to be biased up, and the target is likely the weekly B. MJ stocks are showing technical signs that a reversal may come. There may be other sectors similar as I think the summer bottom gamblers will start appearing now that everything else is at the highs. Gold looks like it will eventually go lower. Nat gas lost support and is likely to go lower. USOIL is bear flagging.

S&P500 key trading level at 6130Trade Tensions:
Trump has threatened higher tariffs on Japan, criticising its refusal to import U.S. rice.
The EU is open to a trade deal with the U.S. involving a 10% universal tariff on many exports, but seeks lower rates for key sectors like pharmaceuticals and semiconductors.
Markets:
U.S. equity futures are steady after the S&P 500 posted its best quarter since 2023.
Focus remains on trade developments and ongoing disputes in Washington over a major $3.3 trillion tax bill.
Canadian stocks are outperforming, led by gold miners, as investors seek safe-haven hedges amid tariff risks.
U.S. Tax Bill:
Republican leaders are struggling to secure votes.
A controversial AI regulation amendment was rejected.
Yale economists estimate the bill would cost the bottom 20% of earners $560/year, while the top 20% gain $6,055/year on average.
Corporate News:
Apple may use OpenAI or Anthropic’s AI to upgrade Siri, potentially sidelining its own AI models.
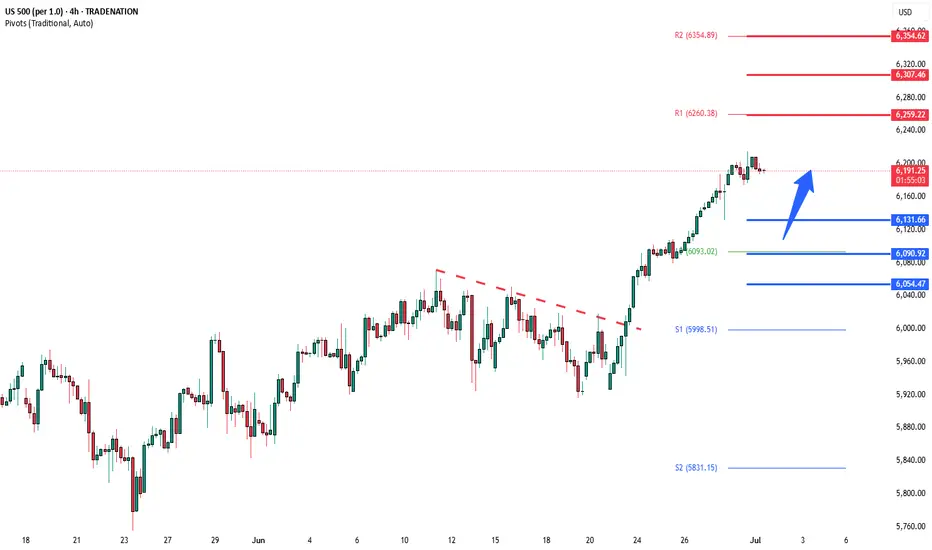
Key Support and Resistance Levels
Resistance Level 1: 6260
Resistance Level 2: 6310
Resistance Level 3: 6350
Support Level 1: 6130
Support Level 2: 6090
Support Level 3: 6055
This communication is for informational purposes only and should not be viewed as any form of recommendation as to a particular course of action or as investment advice. It is not intended as an offer or solicitation for the purchase or sale of any financial instrument or as an official confirmation of any transaction. Opinions, estimates and assumptions expressed herein are made as of the date of this communication and are subject to change without notice. This communication has been prepared based upon information, including market prices, data and other information, believed to be reliable; however, Trade Nation does not warrant its completeness or accuracy. All market prices and market data contained in or attached to this communication are indicative and subject to change without notice.
SPX partial profit pivot approaching Looks like we are entering a choppy 4-5, 4-5 topping pattern will likely take 1-2 week to play out to a point where we can see the waves more clearly. This is slightly more bullish option.
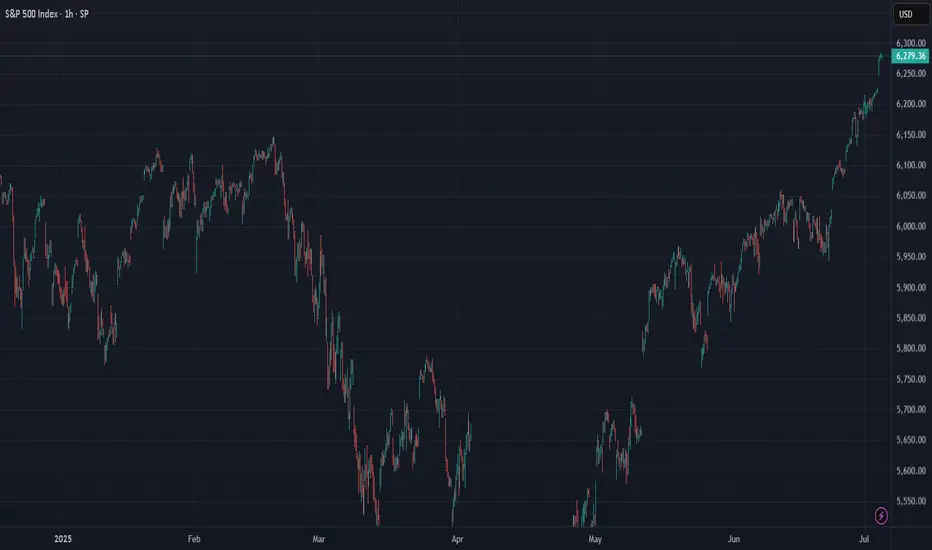
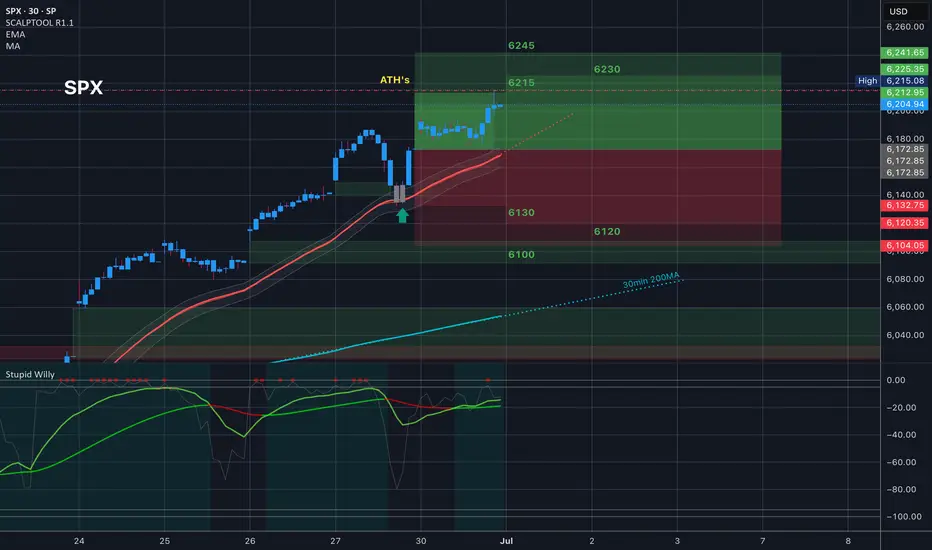
$SPX Made new ATH’s
Yesterday’s price action was flat near previous ATH’s for the first part of the day and then the second part of the day we had some nice volatility that tapped the top of the implied move at 6215 and made new ATH’s just above that at 6215.08 and then pulled back. It’s worth knowing where the top of the implied move is.
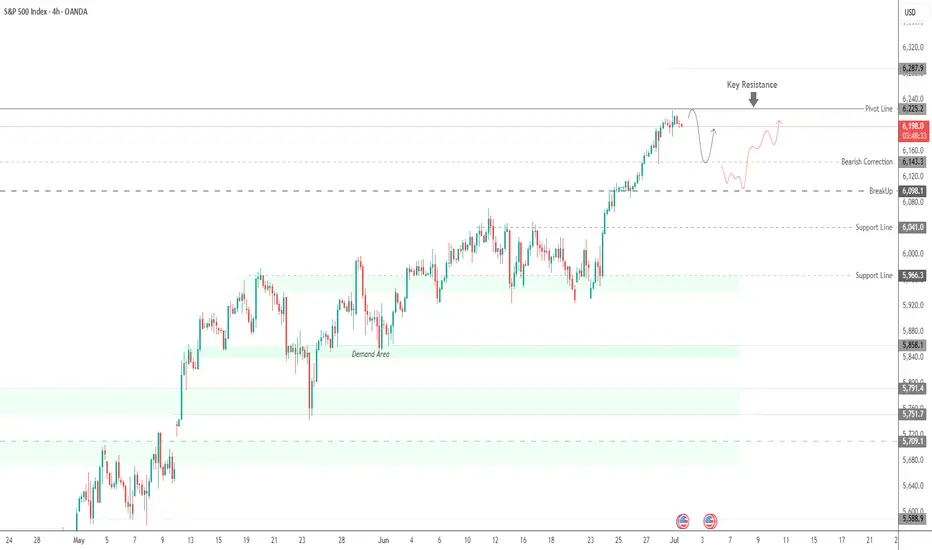
SPX500 | Bulls Need Break Above 6225 to Regain ControlSPX500 | Market Overview
The price has reached the previously mentioned resistance level at 6225.
As long as it trades below 6225, a technical correction is likely, with downside targets at 6161 and 6143. From there, the index would need to stabilize above 6143 to resume a bullish structure.
However, a 1H candle close below 6143 would confirm a deeper bearish move toward 6098.
On the upside, a 1H close above 6225 would reinforce bullish momentum, with potential to reach 6250 and 6287.
Key Technical Levels
Pivot Level: 6191
Support: 6161 / 6143 / 6098
Resistance: 6225 / 6250 / 6287
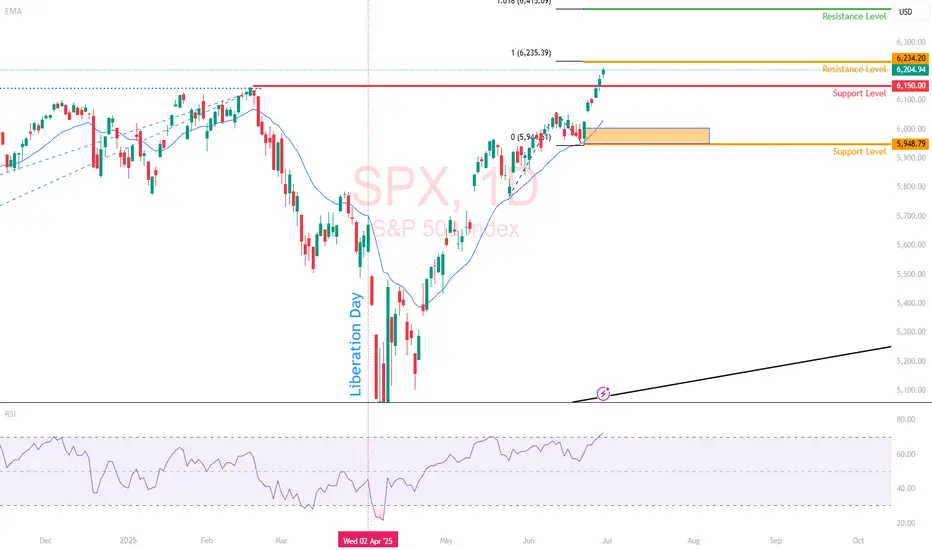
S&P 500 Outlook. Best Quarter Since 2023… But What Next?The S&P 500 just logged its best quarterly performance since Q4 2023 , surging on optimism around global trade negotiations and growing expectations that the Fed may begin cutting rates as early as September. US futures are green this morning, thanks to developments like Canada backing off digital taxes, ongoing dialogues with China ahead of the July 9 deadline, and risk-on sentiment is pushing yields and the dollar lower.
But as traders, we need to ask:
Are we witnessing a genuine economic inflection point? Or is this just a liquidity-driven rally that’s pricing in a best-case scenario?
Technical View
Support Zone: 6,150 was just broken through. And 6000, the round number level, coinciding with the 20-day EMA and previous swing level.
Resistance Levels: 6,235 is the next critical ceiling, a clean breakout could see price reach the extension level of 6,415.
Momentum Indicators: RSI remains elevated and is creeping toward the overbought. While momentum is strong, watch out for the possible development of a divergence.
Possible Scenarios
The 'Soft Landing’ Is Now the Base Case
Markets are trading as if the Fed has successfully engineered a soft landing. But that’s now fully priced in, and historically, the most dangerous trades are the ones everyone agrees on. If trade talks stall, inflation re-accelerates, or earnings disappoint, the reversal could be brutal and fast.
Risk-on Sentiment Without Volume Is a Yellow Flag
Despite the price strength, volume has been tapering off. The S&P’s recent leg up occurred on lighter-than-average participation, suggesting institutions may be watching, not chasing. That’s often the case in low-volatility summers, but it also implies that any negative catalyst could cause outsized downside moves.
Macro-Fundamentals May Not Justify Valuation Expansion
Yes, inflation is slowing, and the Fed might cut. But if they do, it’s likely because growth is weakening, not because the economy is roaring. So the very condition that triggers rate cuts could also cap earnings growth!
Projection
Bullish Scenario: A confirmed breakout above 6,280 could carry us toward 6,400–6,500 by mid-Q3, especially if the trade deals progress, July inflation comes in soft, and the Fed signals accommodation.
Bearish Risk: If price fails to hold above 6,120, especially if trade optimism fades, or inflation growth spikes or Fed rhetoric shifts hawkish again, this could then open a quick pullback toward 6,000 or lower, which also aligns with the 50-day SMA.
Key Events to Watch
July 9 Trade Talks Deadline: Any sign of stalling could bring volatility back fast.
June CPI Print (July 10): Crucial for confirming the Fed's next move.
Earnings Season Kickoff (mid-July): Tech-heavy expectations may not be easy to beat after such a strong run.
Conclusion
A record-setting quarter is impressive but not necessarily predictive. This quarter’s rally has been built more on relief and expectations than hard data. When expectations (not earnings) are doing the heavy lifting, any misstep from central banks or geopolitics could unravel gains rapidly.
A rate cut might be delayed, or inflation re-accelerates, or trade talks stall; any of these could leave equities hanging. Remember: the higher the climb without real earnings growth, the harder the fall when sentiment shifts. It's not just about the chart. It is about the narrative behind the price.
What’s your bias for Q3?
Are you buying this breakout or fading the optimism? Drop your thoughts below.
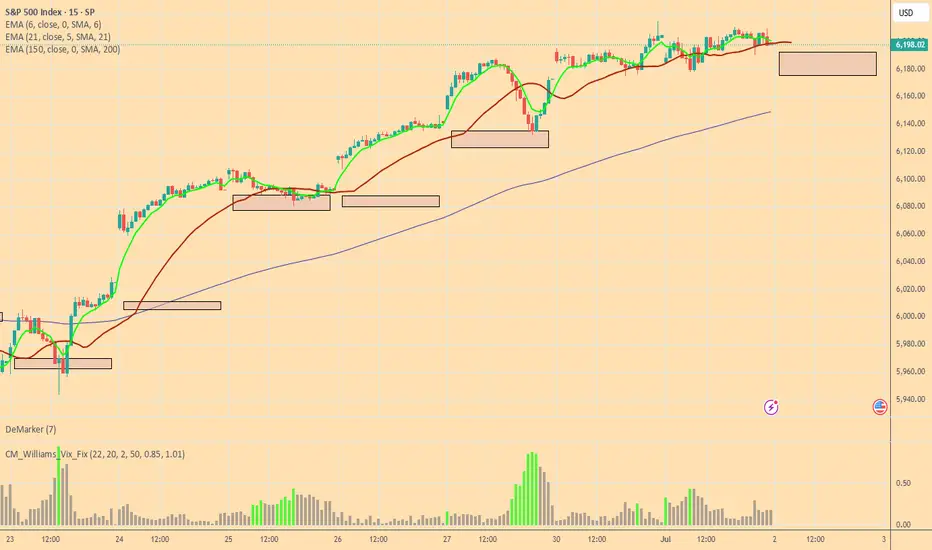
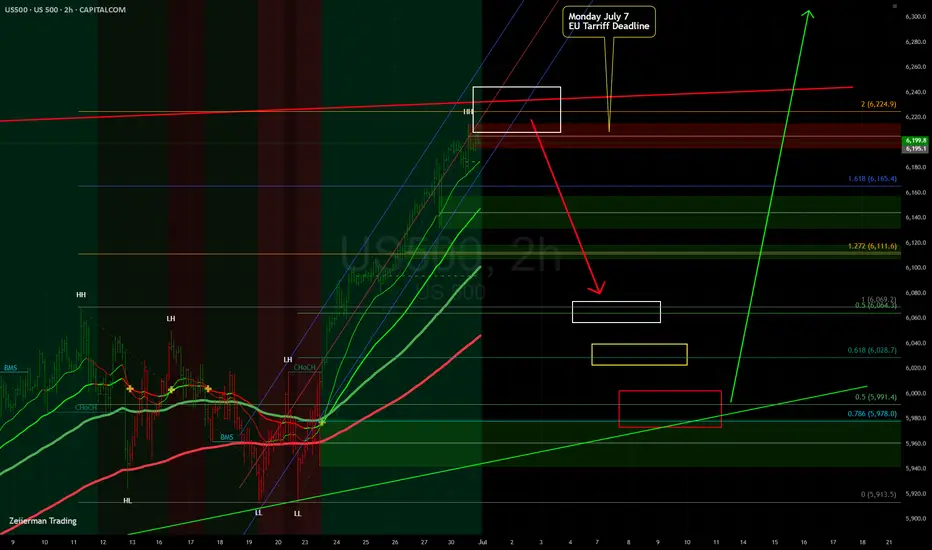
Possible "DIP" into Monday July 7 Tarrif DeadlineHello everyone,
Well we made it. ATH! Well all things must eventually dip. I see a good possibility into next Monday July 7 Tarif deadline plus we are hitting the ATH's prior tops trendline (Red Line)....
I highlight with colored boxes 3 different price targets I think it could dip to before resuming its march higher.
Let's see what happens!
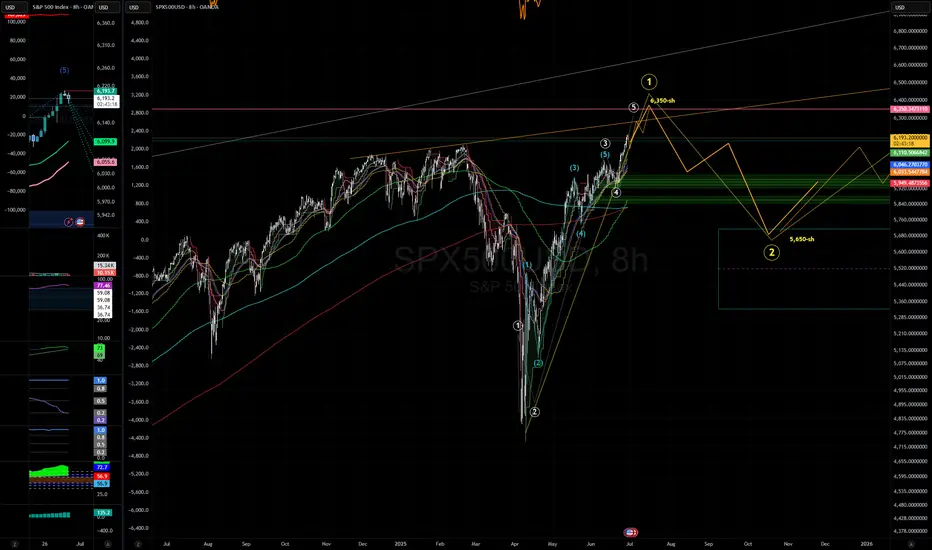
SPX nearing profit pivotSeems SPX is nearing profit pivot. expect a few more waves higher. Then a larger 8%-10% correction. will likely hold through or with some profit around 6350-ish. This expected wave-02 correction will likely be the last real opportunity to close any remaining short positions.
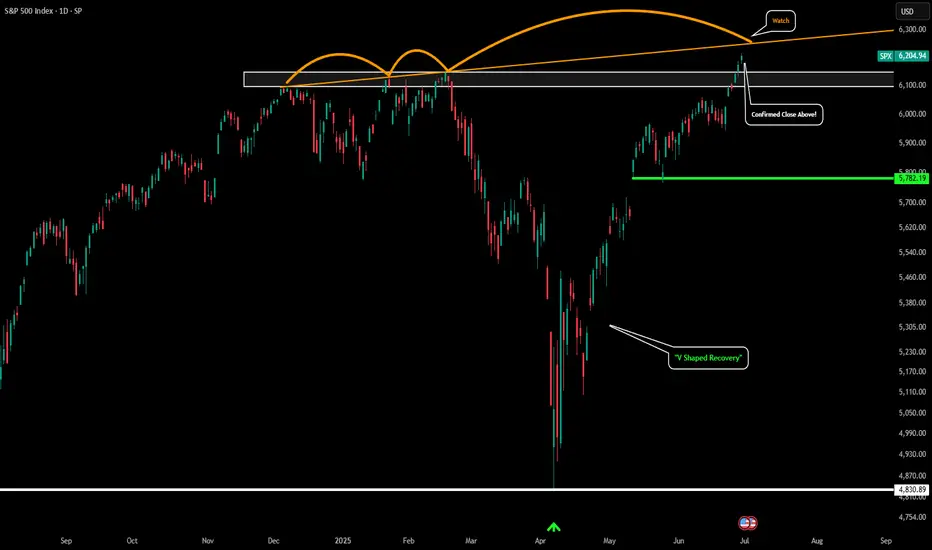
S&P 500 - Confirmed New All Time HighPlease refer to our last post:
The S&P could now be gearing up for the run towards our 1.618 extension around $7k.
We just had a confirmed daily candle breakout above our white box which we have been eyeing for so long. This is the first signal of a major ATH breakout rally for the S&P.
However there is only one thing that could potentially hinder this rally. That would be the orange trendline I have drawn. If price gets rejected somewhere along this orange trendline and price falls back below the white box that would signal a few warning signs. The first would be a failed breakout and the second would be a massive bearish divergence forming on the HTF. With higher highs in price but strength continuing to get weaker keep an eye out for that.
So far things just look great, but just wanted to point that out as a potential scenario.