Crude oil moves up alternately during the day
💡Message Strategy
WTI crude oil prices snapped a three-day winning streak and were trading around $66.00 a barrel in early European trading Thursday. Crude oil prices fell as rising U.S. crude inventories heightened concerns about weak demand in the United States, the world's largest oil consumer.
📊Technical aspects
From the daily chart level, crude oil fluctuates upward in the medium term and tests around 78. The K-line closes with a large real negative line, which has not yet destroyed the moving average system and is still supported. The medium-term objective upward trend remains unchanged.
However, from the perspective of momentum, the MACD indicator crosses downward above the zero axis, indicating that the bullish momentum is weakening. It is expected that the medium-term trend of crude oil will fall into a high-level oscillation pattern.
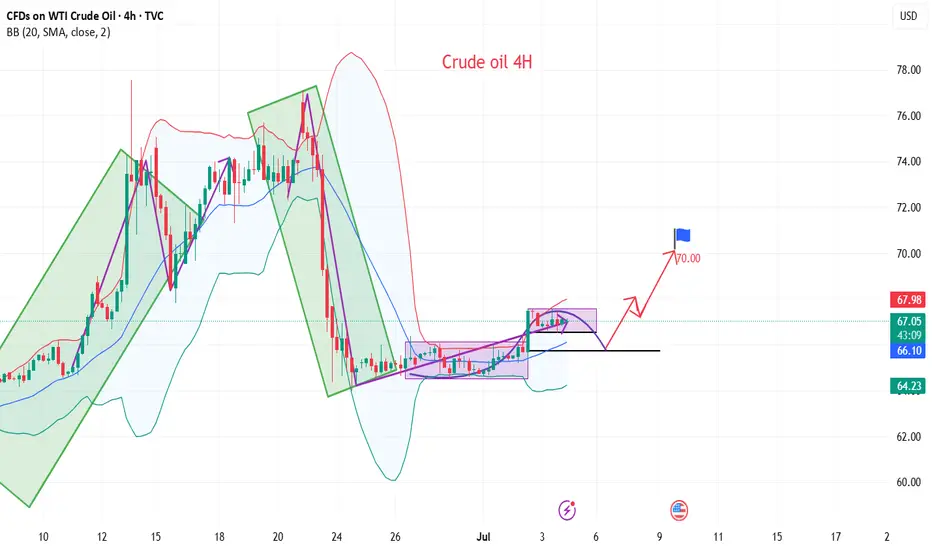
The short-term trend of crude oil (4H) fluctuated and consolidated for two trading days. The oil price repeatedly crossed the moving average system, and the objective trend direction fluctuated. From the perspective of the primary and secondary rhythms, the current rhythm is a secondary oscillation rhythm. According to the law of primary and secondary alternation, the subjective trend still maintains an upward direction. In terms of momentum, there are signs of weakening upward momentum, and it is expected that the crude oil trend will continue to be mainly upward.
💰Strategy Package
Long Position:65.50-66.00,SL:64.50,Target:69.00-70.00
USCRUDEOIL trade ideas
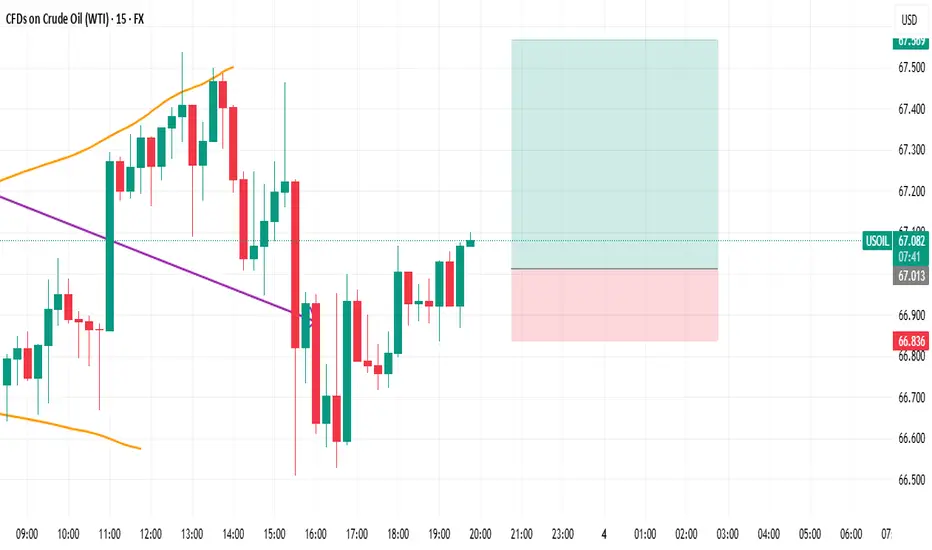
SCALPING POSSITION US IOLus now on way to finish wave z
stp loss: 66.836
tp :67582
Like and folow our profile for more free analyse forex crypto stocks future anything
note :for help or ask for the best place fore entre just inbox me
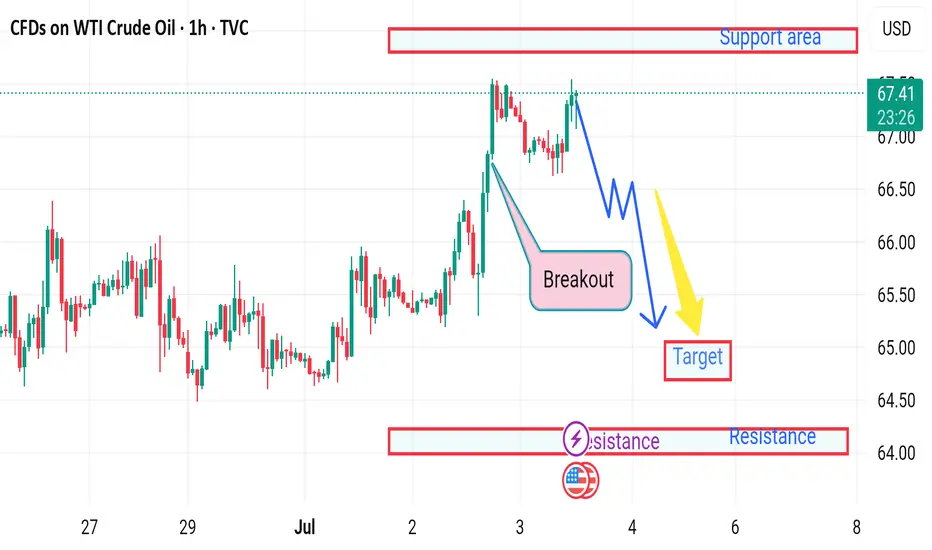
Market next move ❗ Disrupted Market Outlook:
⚠️ False Breakout Risk:
The recent "Breakout" above previous highs may be a bull trap. Although price surged, the follow-up candles are showing lower highs, suggesting weakening bullish momentum.
📉 Bearish Divergence (not shown but likely):
Based on the price action, there's a potential bearish divergence with RSI/MACD (if overlaid), as price makes higher highs while momentum likely weakens.
🔄 Resistance Reversal Zone:
The area labeled as "Support area" at the top (near $67.50) is actually acting as resistance again — the market is failing to hold above this level.
🔁 Retest Failure:
After the breakout, price failed to establish strong support and is consolidating below the highs, hinting at a potential breakdown below $66.
---
🔻 Disruption Path:
1. Drop to $66.00 - immediate pullback from failed breakout.
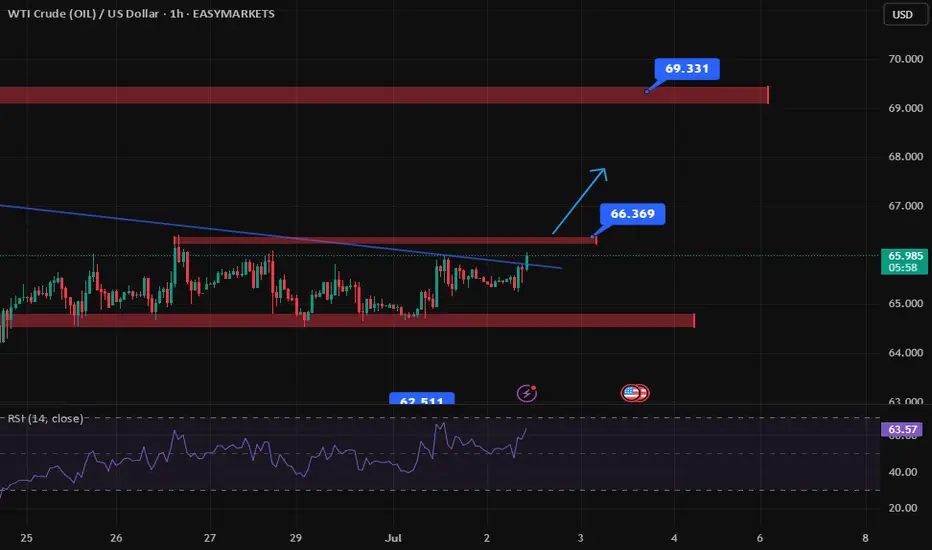
Oil (WTI) – Preparing for Potential Fresh VolatilityThe price of Oil (WTI) fell dramatically last week, from a high of 78.88 on Monday June 23rd to a low of 65.21 on Tuesday June 24th, as a ceasefire was first agreed and then held between Israel and Iran. This shifted the focus for traders back to US trade talks and looming tariffs, the direction of US economic growth and the potential for another OPEC+ production increase. Although, it must be said that nervousness about the sustainability of the ceasefire is still drawing the focus of traders this week and may continue to do so.
In terms of trade, Oil prices jumped higher yesterday as a trade deal between the US and Vietnam was announced, but the question remains, could this rally be short lived?
President Trump stated on Tuesday that he doesn’t expect to delay his July 9th tariff deadline, which could see higher import penalties reimposed on key trading partners, such as Japan and the EU. While it seems that traders may still be unsure whether he really means this, any potential impact on Oil prices could increase the closer we move to the deadline.
Today’s data releases could provide some key insights into the health of the US economy, with Non-farm payrolls released at 1330 BST and the US ISM Services PMI due at 1500 BST. Traders expect jobs growth to continue to moderate, so any bigger downside surprises could increase Oil price volatility, and the direction of service activity (bars, restaurants etc), the main driver of US growth for many months, may also be crucial for sentiment. Traders may be watching for whether there has been any major deterioration in this services PMI reading, back towards, or below 50, which is the dividing line between economic contraction and expansion.
Then, Sunday’s (July 6th) OPEC+ meeting, where the group is expected to agree to an August supply increase for a fourth month in a row, moves into focus. Depending on this OPEC+ decision and any tariff or geo-political developments over the weekend, Oil prices could potentially open up at very different levels on Monday morning.
Technical Update: Breaking Higher From Range?
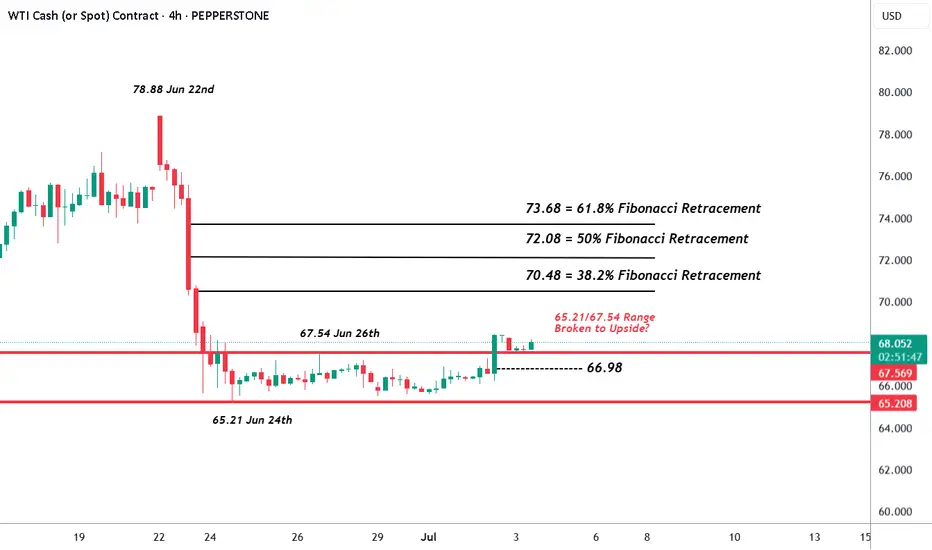
Following the aggressive sell-off in the price of Oil from the 78.88 June 22nd high into the 65.21 June 24th low, a period of stability materialised as traders assessed the developing geo-political backdrop.
This saw price activity held by support offered by the 65.21 price low and resistance by the 67.54 June 26th high. However, as the 4 hourly chart above shows, the latest activity has now seen prices move out of this range, with a closing break above the previous 67.54 high.
While a break higher from such a sideways range in price is not a guarantee of continued upside, traders may now be viewing this type of activity as reflecting potential for a more extended phase of price strength.
Next Possible Resistance Levels.
If further price strength is to emerge, it might now suggest possibilities to test the 70.48 level, which is equal to the 38.2% Fibonacci retracement of the June 22nd to June 24th decline.
Closing breaks above this resistance may then lead to further attempts at price strength towards 72.08, which is the higher 50% retracement level.
Next Possible Support Levels
While some traders might view a move back into the old sideways price range, which would be represented by closes back under the 67.54 recent high, as marking the possibility of increasing downside pressure again, it might in fact be breaks under the 66.98 level, which is equal to half latest strength, that indicates the potential of further price declines.
Such downside closing breaks may well suggest potential to retest the 65.21 June 24th low trade, possibly further if this in turn gives way.
The material provided here has not been prepared accordance with legal requirements designed to promote the independence of investment research and as such is considered to be a marketing communication. Whilst it is not subject to any prohibition on dealing ahead of the dissemination of investment research, we will not seek to take any advantage before providing it to our clients.
Pepperstone doesn’t represent that the material provided here is accurate, current or complete, and therefore shouldn’t be relied upon as such. The information, whether from a third party or not, isn’t to be considered as a recommendation; or an offer to buy or sell; or the solicitation of an offer to buy or sell any security, financial product or instrument; or to participate in any particular trading strategy. It does not take into account readers’ financial situation or investment objectives. We advise any readers of this content to seek their own advice. Without the approval of Pepperstone, reproduction or redistribution of this information isn’t permitted.
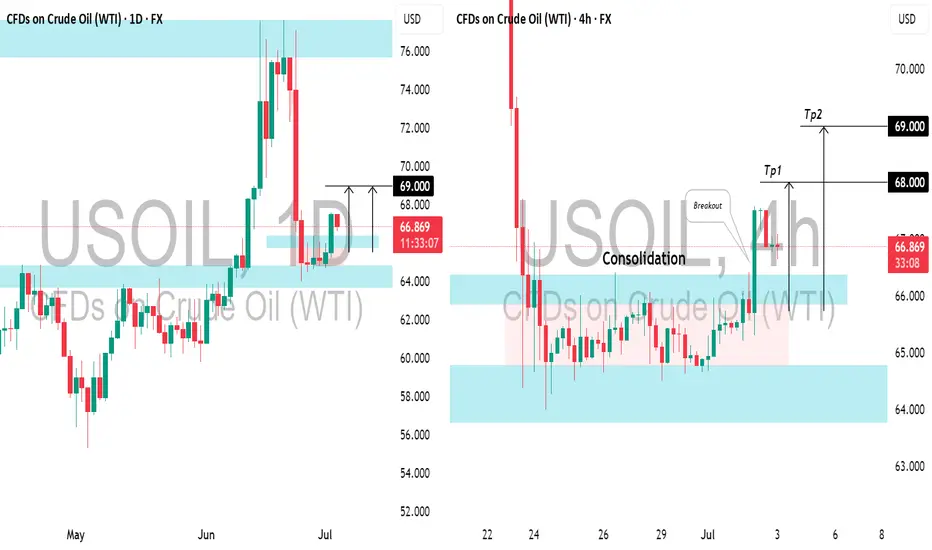
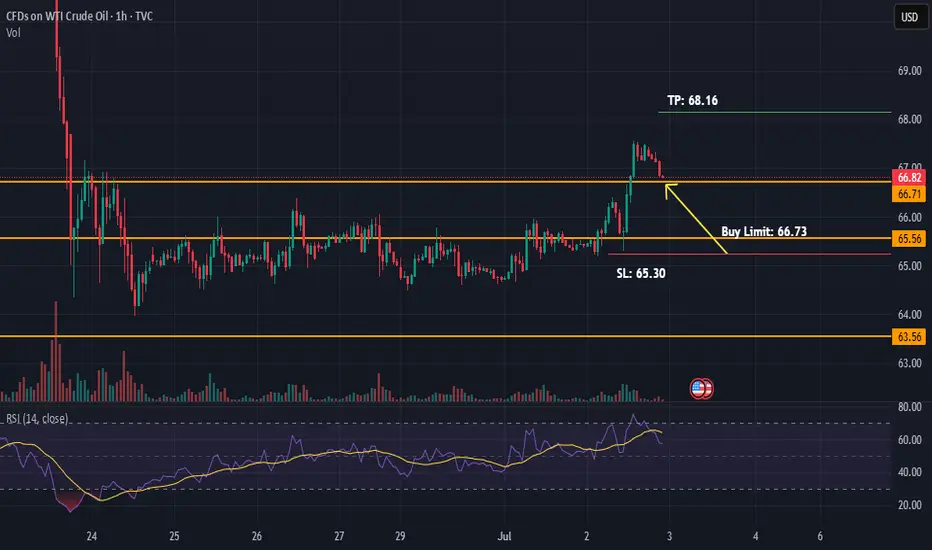
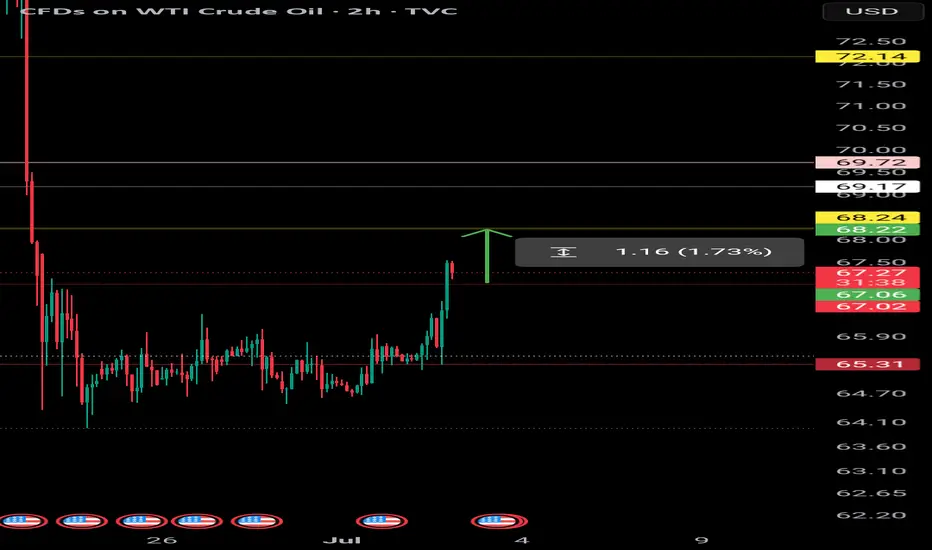
US CRUDE OIL (WTI): Bullish Move From Support📈USOIL appears to be bullish following a consolidation at a significant daily support level.
The emergence of a bullish imbalance candle reinforces this positive outlook.
I anticipate the price will rise to at least 68.00, potentially reaching 69.00.
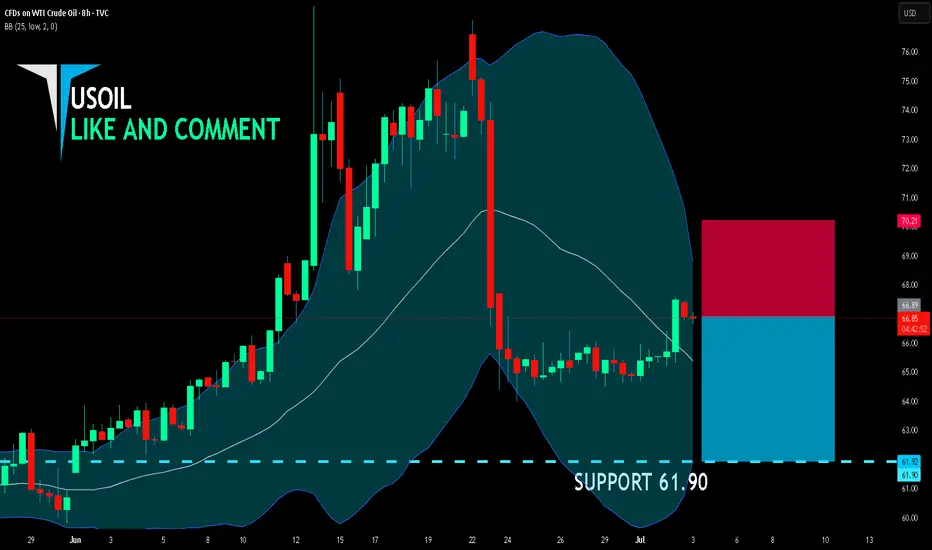
USOIL BEARS ARE GAINING STRENGTH|SHORT
USOIL SIGNAL
Trade Direction: short
Entry Level: 66.89
Target Level: 61.90
Stop Loss: 70.21
RISK PROFILE
Risk level: medium
Suggested risk: 1%
Timeframe: 8h
Disclosure: I am part of Trade Nation's Influencer program and receive a monthly fee for using their TradingView charts in my analysis.
✅LIKE AND COMMENT MY IDEAS✅
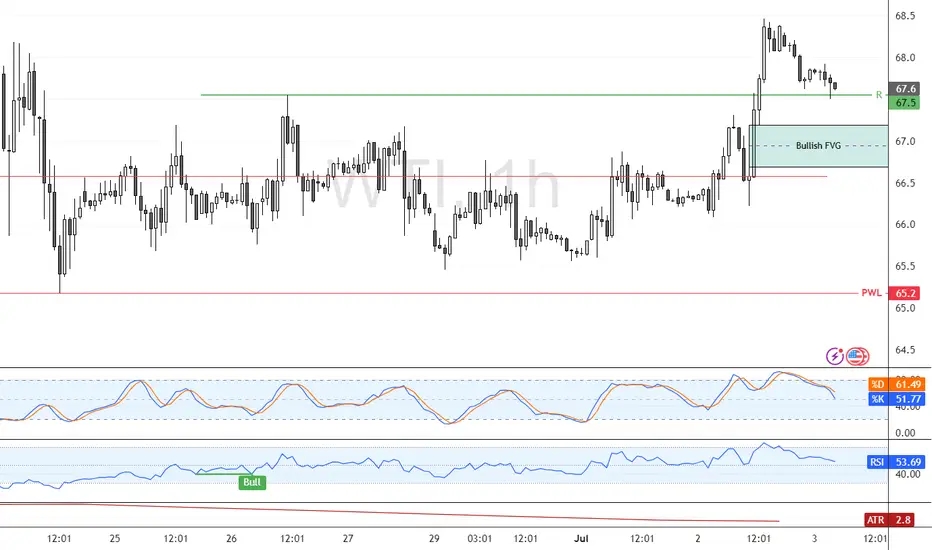
Short-Term Overpricing Signals Oil ConsolidationFenzoFx—Crude Oil is retesting broken resistance at $67.5 while the Stochastic remains overbought, suggesting short-term pricing pressure.
A pullback into the Bullish Fair Value Gap may offer a low-risk entry before the uptrend resumes.
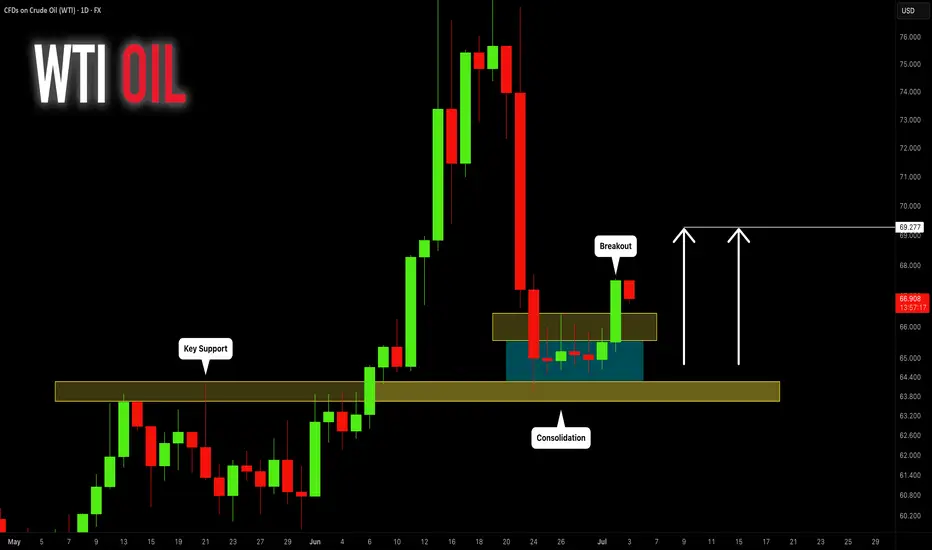
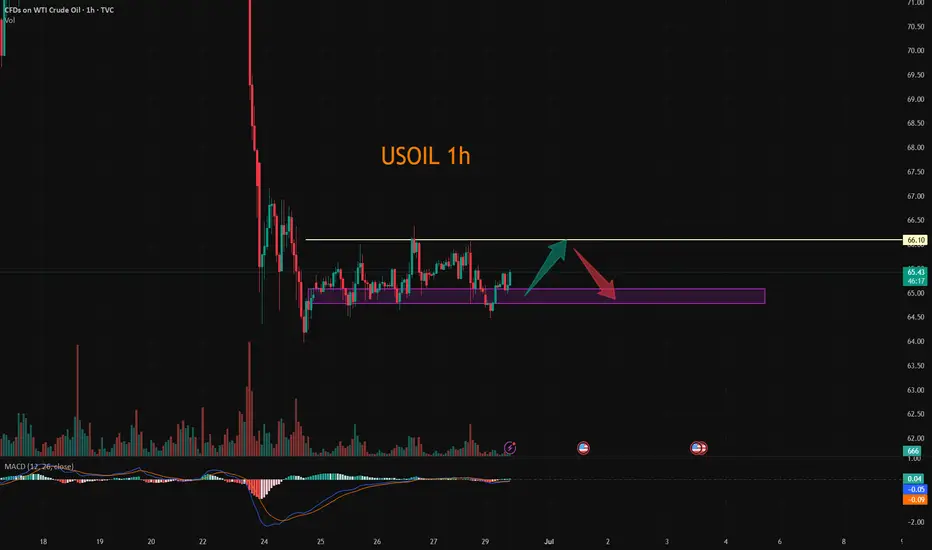
CRUDE OIL (WTI): Consolidation is Over
Crude Oil was consolidating for 6 trading days in a row
after a test of a key daily support.
The yesterday's Crude Oil Inventories data made the market bullish
and the price successfully violated a minor resistance of a sideways movement.
We can expect that the market will grow more.
Next resistance - 69.27
❤️Please, support my work with like, thank you!❤️
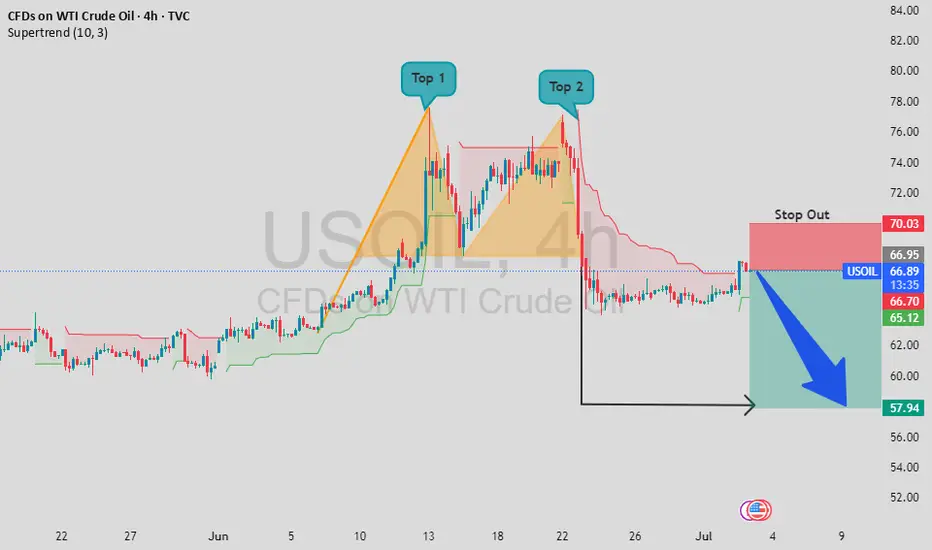
USOIL Double Top Breakdown | Short Setup Alert!USOIL Double Top Breakdown | Short Setup Alert!
Hey traders! A classic Double Top pattern has formed on the 4H USOIL chart (Top 1 & Top 2), signaling a potential trend reversal. After breaking the neckline, price action confirms bearish momentum. The stop-out level is clearly marked at 70.00 , while the target zone is set around 58.00. This setup offers a great risk-reward ratio.
📍 Supertrend also aligns with bearish confirmation.
💬 Drop your thoughts in the comments section – let's discuss the trade!
❤️ If you find this helpful, don’t forget to support with a like and follow!
Stay sharp and trade safe!
DON'T TRADE THE NOISE - Trade what the chart is telling you!All the information you need to find a high probability trade are in front of you on the charts so build your trading decisions on 'the facts' of the chart NOT what you think or what you want to happen or even what you heard will happen. If you have enough facts telling you to trade in a certain direction and therefore enough confluence to take a trade, then this is how you will gain consistency in you trading and build confidence. Check out my trade idea!!
tradingview.sweetlogin.com

USOIL is Nearing the Daily TrendHey Traders, in tomorrow's trading session we are monitoring USOIL for a buying opportunity around 64.30 zone, USOIL is trading in an uptrend and currently is in a correction phase in which it is approaching the trend at 64.30 support and resistance area.
Trade safe, Joe.

Sudden Oil Spike - what you need to know!Iran suspended cooperation with the U.N. nuclear watchdog, amid a surprise build in US crude inventories.
Iran’s move added a modest risk premium to prices, though analysts noted that no actual supply disruptions have occurred.
$66 is a key level for WTI crude to hold above.
If it can maintain this area, we will likely see higher price. $66 is a multi year trendline of support going back to 2021.
Energy stocks / XLE basket is showing some bullish divergence, perhaps indicating this oil move has legs.

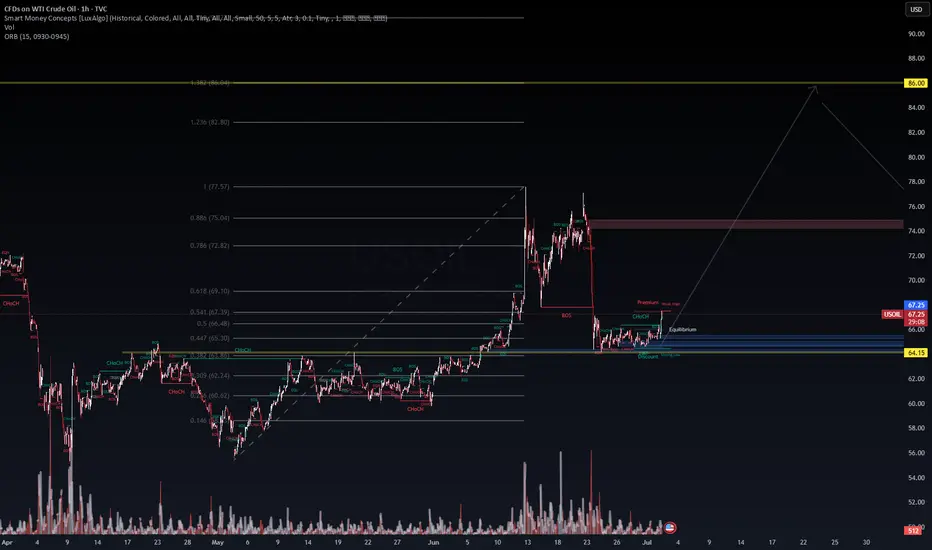
WTI Surge Incoming? $67 Base Could Launch Prices Toward $86Wavervanir_Intl created with TradingView.com, Jul 02, 2025 12:27 UTC‑7
CFDs on WTI Crude Oil · 1h · TVC 67.26 H67.41 L67.26 C67.27 +0.02 (+0.02%)
---
**🎯 Short‑Term Outlook (1 h)**
• Price rebounding from demand zone at $64.15 & equilibrium
• Break of 0.447–0.5 fib (~65.30–66.48) → targeting 70.00 then 72.82
• Entry: 67.30–67.50 | SL: <65.50 | TP1: 70.00 | TP2: 72.80
**📊 Mid‑Term (Daily/Weekly)**
• Weekly Heikin‑Ashi confirms bullish reversal, testing long-term resistance near $74–76
• Breakout clears range → potential extension to $86 (1.382 fib)
• If rejected → expect pullback to 67–70 base zone
**⚠️ Macro Catalysts & Risk**
• Bullish from inventory draws & Middle East tensions
• Upcoming OPEC+ July 6 meeting could shift supply dynamics
**🏁 Summary**
- Play for short‑term lift to fib targets
- Monitor mid‑term breakout above ~$75.60 for extended rally
- Place stops below structured support for controlled risk
Stay agile—conditions remain fluid with macro implications in control.
#Oil #WTI #Fib #Demand #Supply #OPEC #WaverVanir
WTI : Could rise to this resistance by the end of today.It is standing between its own important support and resistance, which is expected to advance given the news surrounding the Strait of Hormuz.
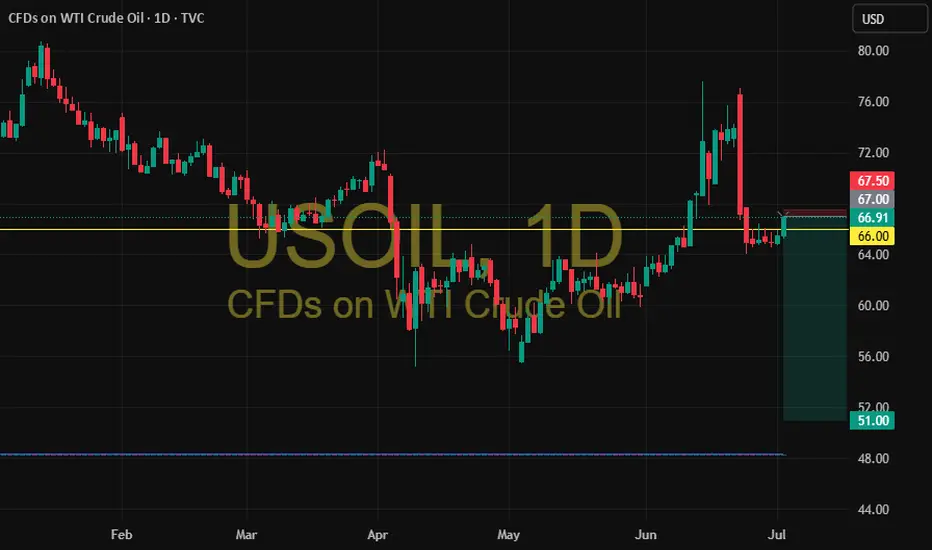
Classic Bear Flag on Oil 🚩 Classic Bear Flag on Oil 🛢
A textbook bear flag has formed on the oil chart:
📏 Flagpole: From $77 down to $64 – a move of 13 points
📉 If price breaks below the lower support of the flag:
🎯 Target = $64 − $13 = $51
⚠️ This sets a bearish target at $51,
assuming momentum continues and there's no invalidation.
usoil 67
sl 67.5
tp1 66
tp2 65.5
tp3 65
tp4 64.5
tp5 open
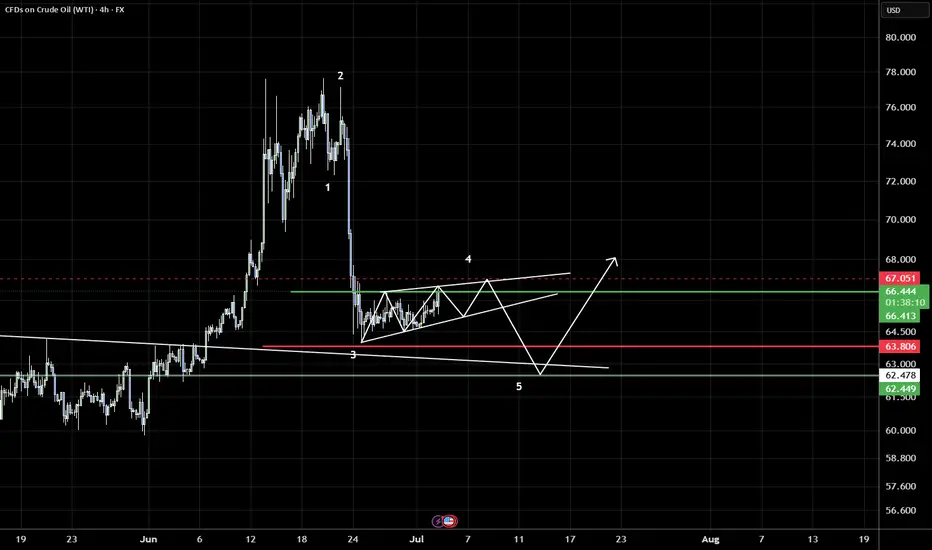
crude carving out shallow complex w4 to at least a 6708 print? crude looks to be carving out a complex wave 4 in an ascending wedge that should extend toward 6708. I'm looking for the D wave down to commence anytime now. lets see if this will play out.
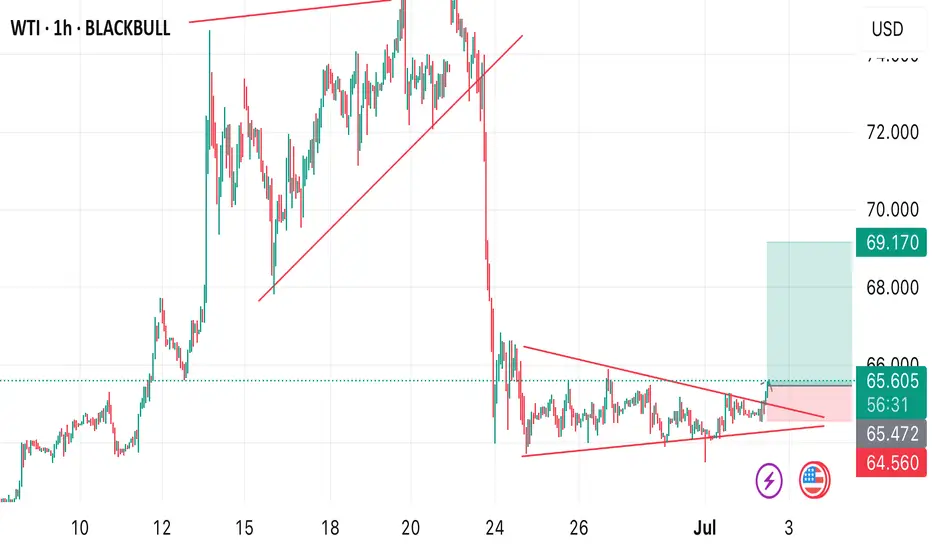
WTI BUY OPPORTUNITY!!!Price just offered a buy opportunity as it trades at $65.605 per barrel. I anticipate a bullish price action to develop away from the current market price. The massive pullback that occurred from the daily timeframe is completed and it’s due for a buy.
Take advantage of this opportunity now!
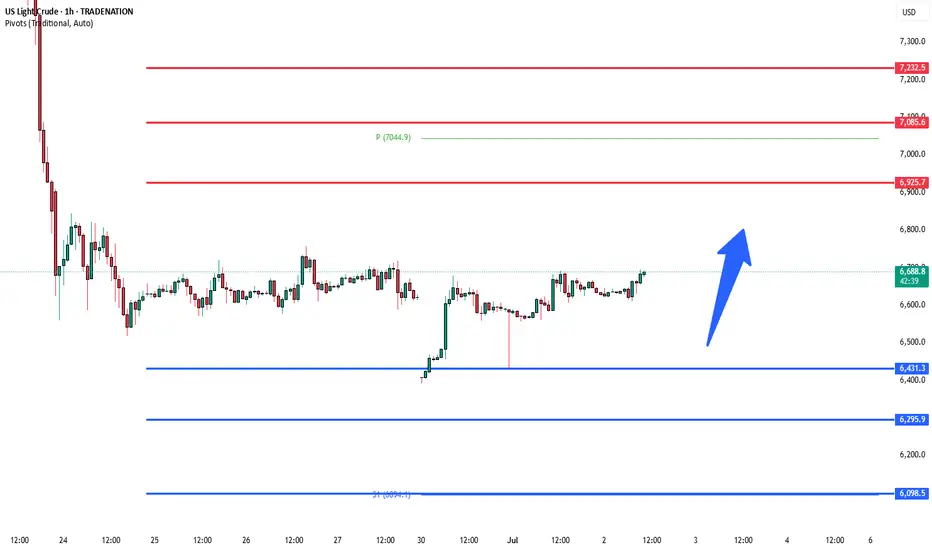
WTI Crude Oil sideways consolidation support at 6460Crude oil prices remain under pressure as easing geopolitical tensions between Iran and Israel reduce fears of supply disruptions in the Middle East. Adding to the bearish tone, the anticipated output increase by OPEC+—expected to raise August production by 411,000 bpd—acts as a supply-side headwind. Meanwhile, a modest rebound in the US Dollar from multi-year lows also weighs on oil demand, given its inverse relationship with USD-denominated commodities.
However, expectations that the Federal Reserve may soon resume rate cuts could limit USD upside, offering some support to oil prices. Traders are likely to stay cautious ahead of key US economic data, including Wednesday’s ADP report and Thursday’s Nonfarm Payrolls, which will shape Fed policy expectations. Additionally, the latest EIA stockpile data will be closely watched for immediate supply signals.
Conclusion:
WTI Crude Oil is likely to trade with a neutral-to-bearish bias in the near term, pressured by rising supply and a firmer dollar. However, Fed rate cut expectations and upcoming US labor and inventory data may help cushion the downside. Traders may remain on the sidelines until clearer direction emerges post-NFP and OPEC+ decisions.
Key Support and Resistance Levels
Resistance Level 1: 6925
Resistance Level 2: 7080
Resistance Level 3: 7230
Support Level 1: 6460
Support Level 2: 6300
Support Level 3: 6100
This communication is for informational purposes only and should not be viewed as any form of recommendation as to a particular course of action or as investment advice. It is not intended as an offer or solicitation for the purchase or sale of any financial instrument or as an official confirmation of any transaction. Opinions, estimates and assumptions expressed herein are made as of the date of this communication and are subject to change without notice. This communication has been prepared based upon information, including market prices, data and other information, believed to be reliable; however, Trade Nation does not warrant its completeness or accuracy. All market prices and market data contained in or attached to this communication are indicative and subject to change without notice.
USOIL:Narrow trading strategy
USOIL: There is no update in the past two days, because the oil price still continues to fluctuate in a narrow range, and the space for volatility is gradually reduced, which is not very different from our overall trading idea. The original long target of 65.9-66.4 can be adjusted to 65.8-66.2 with the reduction of the space for volatility. It is expected that the trend will come out this week, and we will adjust our thinking then.
Friends who do not trade at present can refer to the interval trading strategy within a day:
BUY@64.7-65
TP: 65.8 to 66.2
SELL@65.8-66.2
TP: 64.7-65
More detailed strategies and trading will be notified here ↗↗↗
Keep updated, come to "get" ↗↗↗
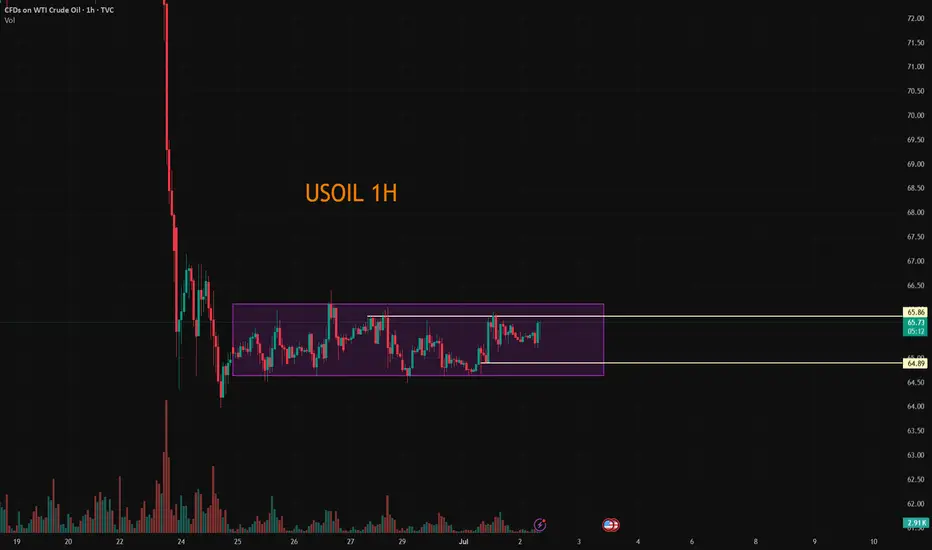
USOIL:Today's trading strategy
Oil prices have been sideways for the fourth trading day, volatility began to narrow, the market is brewing a new round of trend, short-term range 64-66.4. Today you can sell high and buy low around a narrow range.
Trading Strategy:
BUY@64.7-65.1
TP: 65.9-66.4
SELL: 66-66.4
TP: 65.1-64.5
More detailed strategies and trading will be notified here ↗↗↗
Keep updated, come to "get" ↗↗↗
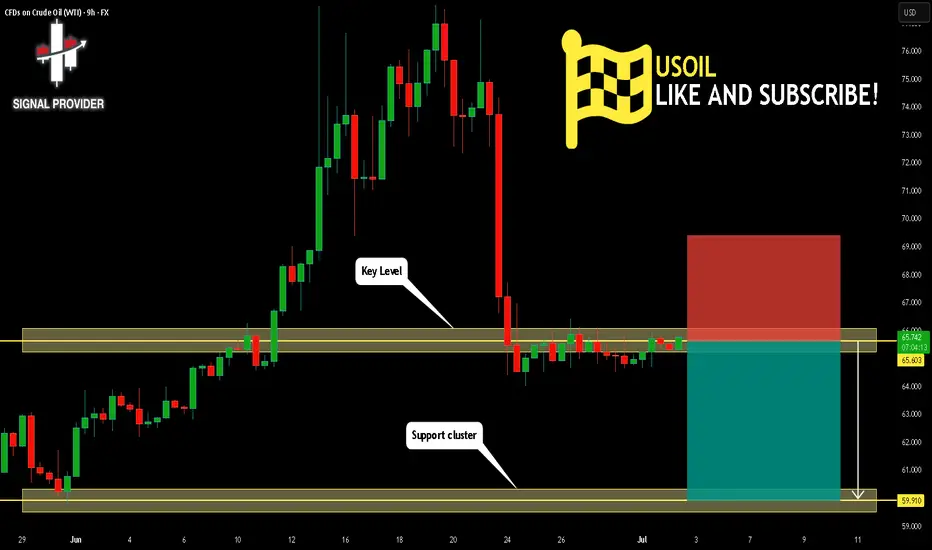
USOIL Will Fall! Sell!
Take a look at our analysis for USOIL.
Time Frame: 9h
Current Trend: Bearish
Sentiment: Overbought (based on 7-period RSI)
Forecast: Bearish
The market is testing a major horizontal structure 65.603.
Taking into consideration the structure & trend analysis, I believe that the market will reach 59.910 level soon.
P.S
The term oversold refers to a condition where an asset has traded lower in price and has the potential for a price bounce.
Overbought refers to market scenarios where the instrument is traded considerably higher than its fair value. Overvaluation is caused by market sentiments when there is positive news.
Disclosure: I am part of Trade Nation's Influencer program and receive a monthly fee for using their TradingView charts in my analysis.
Like and subscribe and comment my ideas if you enjoy them!