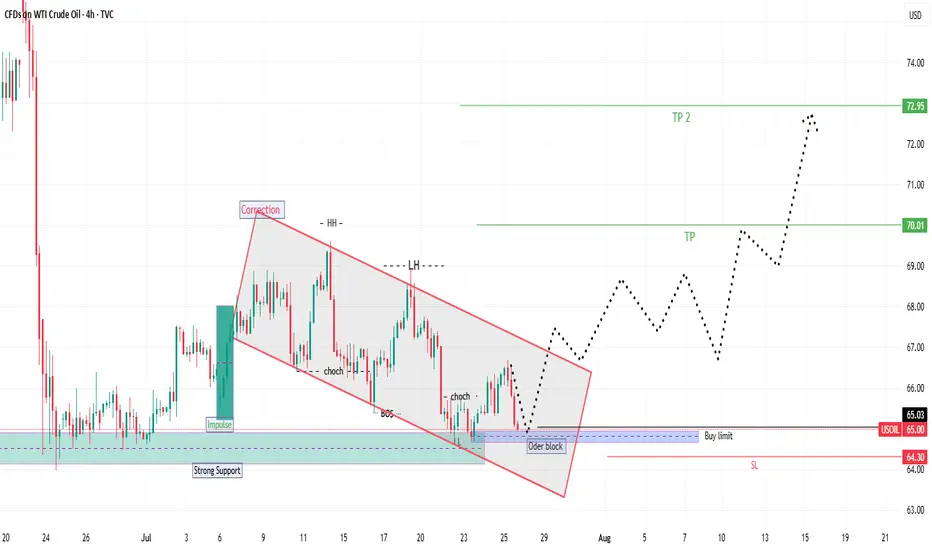
USOIL BUY Smart Money + trend analysis expecting bullish Smart Money + Elliott Wave analysis expecting bullish move after corrective wave (C) completes at demand zone with Order Block, FVG, and liquidity sweep confluence
USCRUDEOILCFD trade ideas
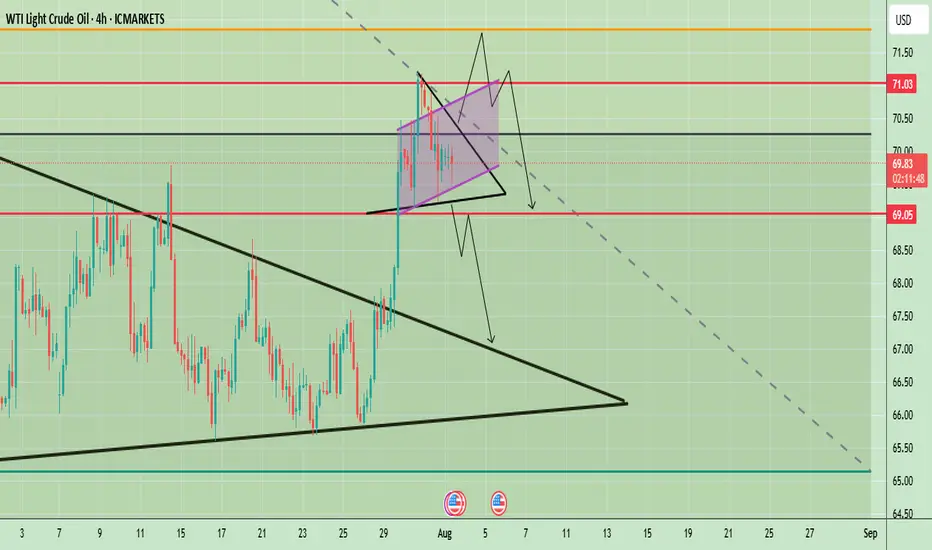
WTI Crude Oil Technical Outlook – Key Breakout or BreakdownWTI Crude Oil 4-hour chart suggests a potential inflection point after a strong bullish breakout from a larger symmetrical triangle pattern in late July. The price surged past key resistance levels and is now consolidating in a smaller symmetrical triangle formation just below the psychological $70 mark. This indicates a phase of indecision following a strong move, with market participants awaiting further confirmation.
Price is currently hovering around $69.82, with key levels marked at $71.03 (resistance) and $69.05 (support). The short-term price action within the tight triangle could determine the next move, with both bullish continuation and bearish reversal scenarios on the table.
Prices remain supported by supply concerns after Trump threatened to impose 100% secondary tariffs on buyers of Russian crude and warned China, a major oil consumer of severe penalties if it continues its purchases of Russian oil.
🔍 Potential Scenarios
- Bullish Breakout Scenario
If price breaks out of the smaller symmetrical triangle to the upside and clears the $70 resistance level with strong momentum, it may quickly test the $71.03 zone. A clean break above $71.03 would confirm the continuation of the previous uptrend, potentially opening room toward $72.50 and beyond in the medium term. The pattern would resemble a bullish pennant — a continuation pattern following the late July rally.
-Bearish Rejection and Breakdown
Conversely, a failure to sustain above $70 followed by a break below the lower boundary of the smaller triangle could lead to a sharper decline. The first critical level to watch would be $69.05; a break below this would likely invalidate the bullish setup and initiate a retest of the previously broken upper trendline of the larger triangle near $67.50. A further breakdown could lead price towards the larger support zone around $65–$66.
📈 Trend Outlook
- Short-Term: Neutral to Bullish — Consolidation in a smaller symmetrical triangle suggests a pause before continuation. However, the structure is still technically bullish unless $69.05 is broken.
- Medium-Term: Bullish Bias — The breakout from the large symmetrical triangle in late July indicates a shift in market sentiment, favoring higher prices unless the price fails to hold above $67.50.
- Long-Term: Cautiously Bullish — As long as WTI holds above the $65–$66 structural support area, the longer-term outlook remains constructive.
Note
Please risk management in trading is a Key so use your money accordingly. If you like the idea then please like and boost. Thank you and Good Luck!
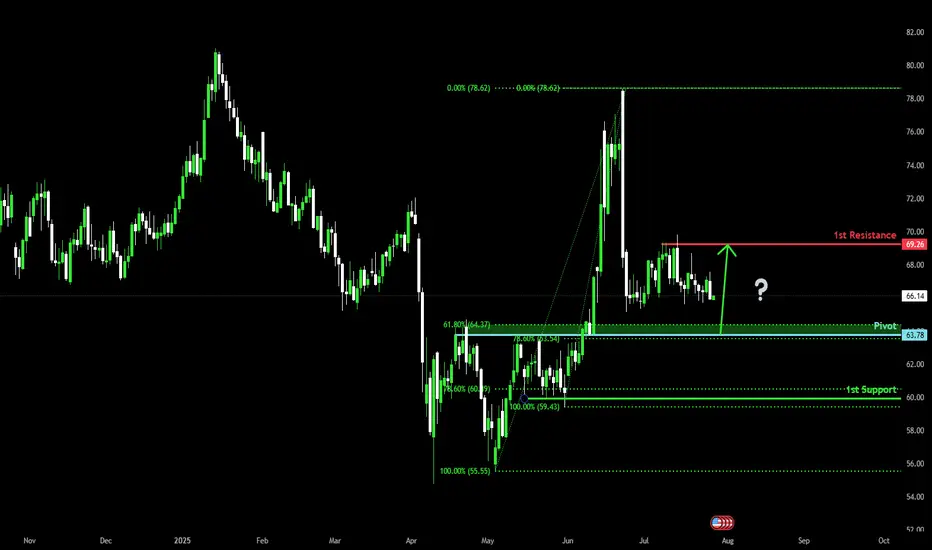
Bullish bounce off pullback support?WTI Oil (XTI/USD) is falling towards the pivot, which has been identified as a pullback support and could bounce to the 1st resistance.
Pivot: 63.78
1st Support: 59.94
1st Resistance: 69.26
Risk Warning:
Trading Forex and CFDs carries a high level of risk to your capital and you should only trade with money you can afford to lose. Trading Forex and CFDs may not be suitable for all investors, so please ensure that you fully understand the risks involved and seek independent advice if necessary.
Disclaimer:
The above opinions given constitute general market commentary, and do not constitute the opinion or advice of IC Markets or any form of personal or investment advice.
Any opinions, news, research, analyses, prices, other information, or links to third-party sites contained on this website are provided on an "as-is" basis, are intended only to be informative, is not an advice nor a recommendation, nor research, or a record of our trading prices, or an offer of, or solicitation for a transaction in any financial instrument and thus should not be treated as such. The information provided does not involve any specific investment objectives, financial situation and needs of any specific person who may receive it. Please be aware, that past performance is not a reliable indicator of future performance and/or results. Past Performance or Forward-looking scenarios based upon the reasonable beliefs of the third-party provider are not a guarantee of future performance. Actual results may differ materially from those anticipated in forward-looking or past performance statements. IC Markets makes no representation or warranty and assumes no liability as to the accuracy or completeness of the information provided, nor any loss arising from any investment based on a recommendation, forecast or any information supplied by any third-party.
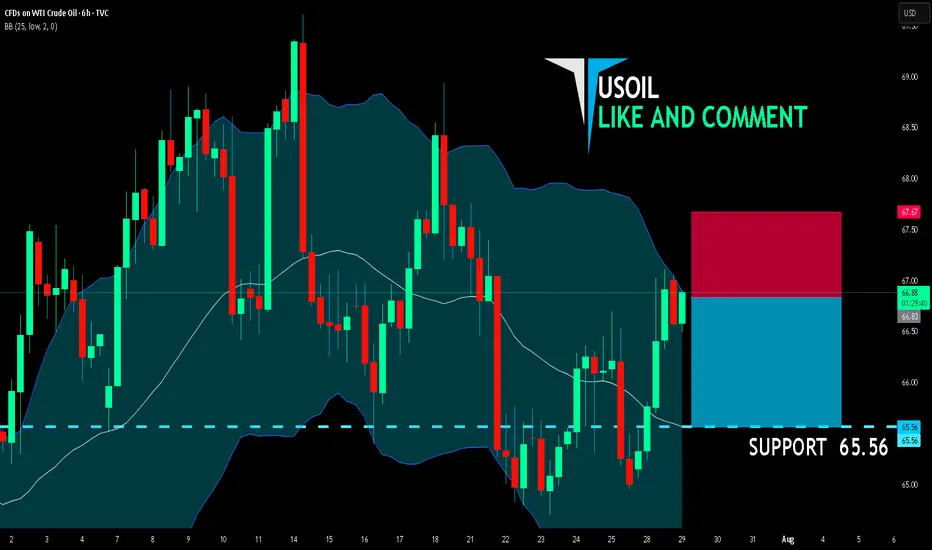
USOIL BEST PLACE TO SELL FROM|SHORT
USOIL SIGNAL
Trade Direction: short
Entry Level: 66.83
Target Level: 65.56
Stop Loss: 67.67
RISK PROFILE
Risk level: medium
Suggested risk: 1%
Timeframe: 6h
Disclosure: I am part of Trade Nation's Influencer program and receive a monthly fee for using their TradingView charts in my analysis.
✅LIKE AND COMMENT MY IDEAS✅
USOIL WTIWest Texas Intermediate (WTI) oil is a major benchmark for crude oil pricing, known for its high quality—being both light and sweet due to its low sulfur content and low density. WTI is sourced primarily from inland Texas and is the underlying commodity for oil futures traded on the New York Mercantile Exchange (NYMEX). The main physical delivery point is Cushing, Oklahoma, a critical U.S. oil storage and trading hub.
Current Price (as of August 1, 2025)
WTI crude oil is trading around $69.15–$69.36 per barrel.
Recently, WTI prices have seen volatility due to global economic factors, including U.S. tariffs, OPEC+ production, and shifts in oil demand. Despite a small decline on the day, oil prices have posted their strongest weekly performance since June, rising over 6% for the week.
Market and Outlook
Recent price movement reflects concerns about global trade tensions, new tariffs, and their impact on economic growth and energy demand. At the same time, supply risks remain due to geopolitical factors such as potential sanctions on Russian oil and U.S.-China trade developments.
Analyst forecasts for the remainder of 2025 suggest continued volatility, with WTI potentially ranging between $56 and $73 per barrel, influenced by demand, OPEC+ decisions, and geopolitical events.
Quick Facts Table
Feature Detail
Type Light, sweet crude
Benchmark NYMEX (U.S.), major global reference
Main Delivery Point Cushing, Oklahoma
Latest Price (Aug 1, 2025) $69.15–$69.36 per barrel
Typical Drivers U.S. tariffs, OPEC+ decisions, trade policy, supply risks, global demand
WTI oil plays a central role in global energy markets, serving as a benchmark for North American and international oil pricing. Its price reflects both supply fundamentals and broader macroeconomic and geopolitical developments.
#OIL #WTI

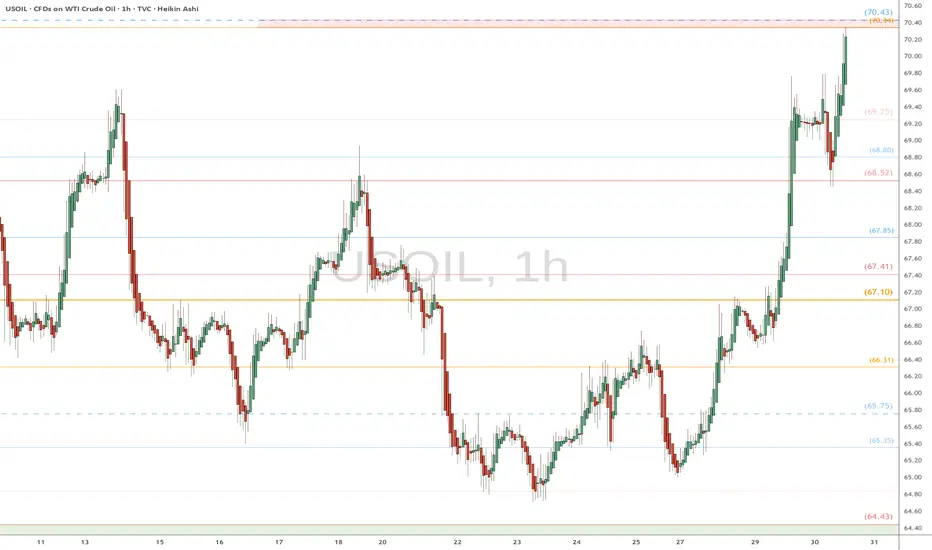
WTI watch $70.34-70.43: Resistance zone that may STOP the surgeUSOIL spiked on Trump/Russia/Iran tariff threats.
Just hit a significant resistance at $70.34-70.43
Look for a Dip-to-Fib or Break-n-Retest for longs.
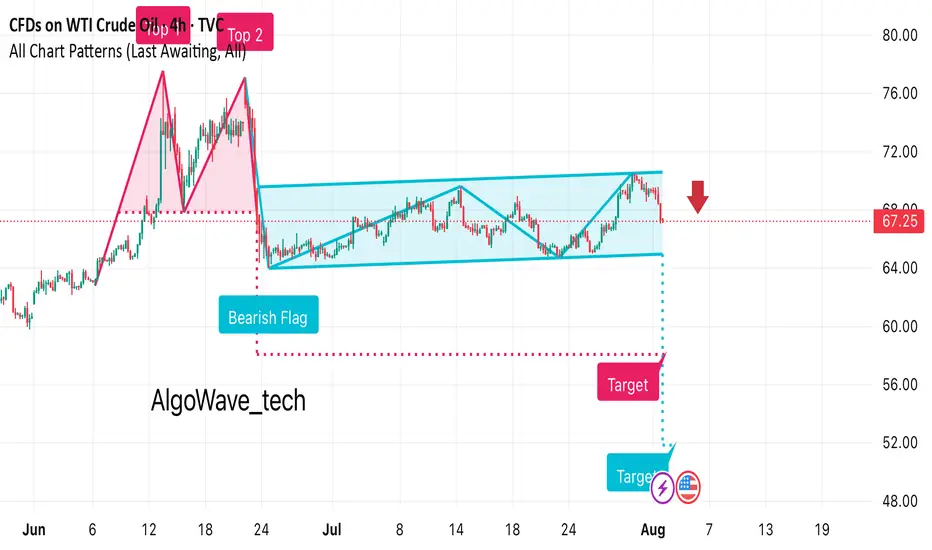
It looks like this chart for WTI Crude Oil is showing a bearish • Previous Move: There’s a strong downward leg before the flag formation, indicating bearish momentum.
• Flag Pattern: Price consolidates in an upward-sloping channel after the drop.
• Breakout: The chart suggests a bearish breakout below the channel, marked with a red arrow at around $67.25.
• Target Projection: The measured move target appears to be around the $53–54 range, based on the flagpole height.
WTI OIL The federal funds rate is the interest rate at which U.S. banks and credit unions lend their excess reserve balances to other banks overnight, usually on an uncollateralized basis. This rate is set as a target range by the Federal Open Market Committee (FOMC), which is the policymaking arm of the Federal Reserve. The current target range as of July 2025 is approximately 4.25% to 4.5%.
The federal funds rate is a key benchmark that influences broader interest rates across the economy, including loans, credit cards, and mortgages. When the Fed changes this rate, it indirectly affects borrowing costs for consumers and businesses. For example, increasing the rate makes borrowing more expensive and tends to slow down economic activity to control inflation, while lowering the rate stimulates growth by making credit cheaper.
The Fed adjusts this rate based on economic conditions aiming to maintain stable prices and maximum employment. It is a vital tool of U.S. monetary policy, impacting economic growth, inflation, and financial markets.
In summary:
It is the overnight lending rate between banks for reserve balances.
It is set as a target range by the Federal Reserve's FOMC.
It influences many other interest rates in the economy.
Current range (July 2025) is about 4.25% to 4.5%.
1. ADP Non-Farm Employment Change (Forecast: +82K, Previous: -33K)
Above Forecast:
If ADP employment is much stronger than expected, the Fed would see this as a sign of ongoing labor market resilience. Robust job growth would support consumer spending, potentially keep wage pressures elevated, and could make the Fed less likely to ease policy soon. This reinforces the case for holding rates steady or staying data-dependent on further cuts.
Below Forecast or Negative:
If ADP jobs gain falls short or is negative again, the Fed may interpret it as a weakening labor market, raising recession risk and reducing inflationary wage pressures. This outcome could increase the chances of a future rate cut or prompt a more dovish tone, provided it aligns with other softening indicators.
2. Advance GDP q/q (Forecast: +2.4%, Previous: -0.5%)
Above Forecast:
A GDP print above 2.4% signals surprisingly strong economic growth and likely sustains the Fed’s view that the U.S. economy is avoiding recession. The Fed may delay rate cuts or take a more cautious approach, as stronger growth can support higher inflation or at least reduce the urgency for support.
Below Forecast or Negative:
Weak GDP—especially if close to zero or negative—would signal that the economy remains at risk of stagnation or recession. The Fed may then pivot to a more dovish stance, become more willing to cut rates, or accelerate discussions on easing to avoid a downturn.
3. Advance GDP Price Index q/q (Forecast: 2.3%, Previous: 3.8%)
Above Forecast:
A significantly higher-than-expected GDP Price Index (an inflation measure) points to persistent or resurgent inflationary pressures in the economy. The Fed might see this as a reason to delay cuts or maintain restrictive rates for longer.
Below Forecast:
If the Price Index prints well below 2.3%, it suggests that inflation is cooling faster than anticipated. This outcome could allow the Fed to move toward easing policy if other conditions warrant, as price stability is more clearly in hand.
Bottom Line Table: Data Surprises and Likely Fed Reaction
Data Surprise Fed Outlook/Action
All above forecast Hawkish bias, rate cuts delayed or on hold
All below forecast Dovish bias, higher chances of rate cut
Mixed Data-dependent, further confirmation needed
Summary:
The Fed’s interpretation hinges on how these figures compare to forecasts and to each other. Stronger growth, jobs, and inflation = less rush to cut; weaker numbers = lower rates sooner. If growth or jobs are especially weak or inflation falls sharply, expect more dovish Fed commentary and a greater likelihood of future easing. Conversely, if the data all surprise to the upside, hawkish (rate-hold) messaging is likely to persist.
The U.S. Dollar Index (DXY) is a financial benchmark that measures the value of the United States dollar relative to a basket of six major foreign currencies. It provides a weighted average reflecting the dollar's strength or weakness against these currencies. The DXY is widely used by traders, investors, and economists to gauge the overall performance and health of the U.S. dollar on the global stage.
Key Features of the DXY:
Currencies included and their weights:
Euro (EUR) – 57.6%
Japanese Yen (JPY) – 13.6%
British Pound (GBP) – 11.9%
Canadian Dollar (CAD) – 9.1%
Swedish Krona (SEK) – 4.2%
Swiss Franc (CHF) – 3.6%
It was established in 1973 after the collapse of the Bretton Woods system to serve as a dynamic measure of the dollar's value.
The index reflects changes in the exchange rates of theses versus the U.S. dollar, with a higher DXY indicating a stronger dollar.
The DXY influences global trade dynamics, commodity prices (like oil and gold)
#SHAVYFXHUB #USOIL #WTI #OIL

Pattern targetIn the previous analysis, we spotted a head and shoulders pattern and mentioned that if it gets activated, it will hit the pattern target — and that’s exactly what happened.
A clean and beautiful setup.
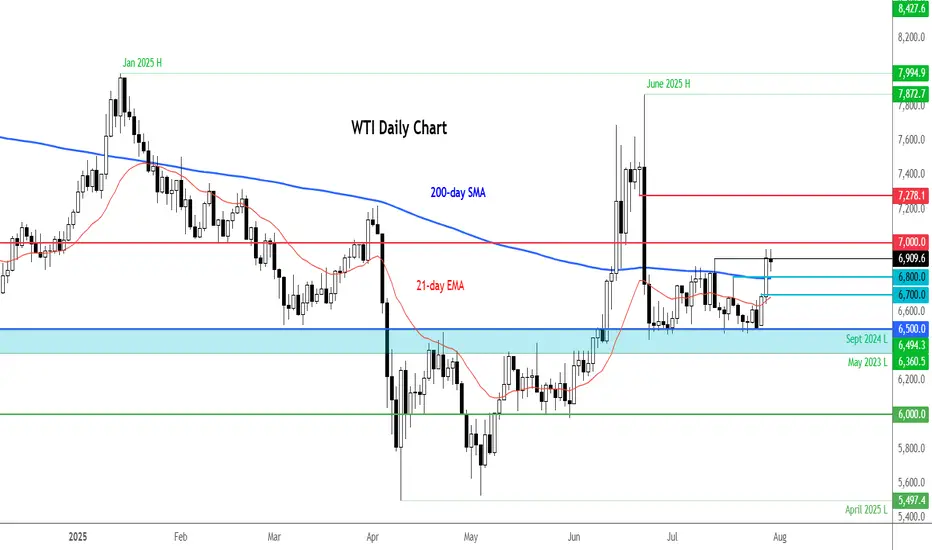
WTI remains supported on Russia sanctions threatIt is worth keeping an eye on the energy markets, given the recent bounce from a key support area around $65.00. With WTI moving back above the 200-day average at $68.00, this is an additional bullish sign from a technical standpoint. This level is now the first support to watch, followed by $67.00 and then that $65.00 key level.
Resistance comes in at $70.00 followed by $72.80.
From a macro point of view, President Trump’s decision to bring forward the deadline for Russia to agree to a ceasefire has ever so slightly heightened the prospect of secondary sanctions being imposed on foreign purchasers of Russian crude — namely China, India, and Turkey. There is a risk we could see a spike in oil prices, if fears of Russian supply being curtailed, intensifies. At the same time, fears about demand have receded with the announcement of a few trade deals by the US and recent economic data from Europe and the US both showing mild strength.
By Fawad Razaqzada, market analyst with FOREX.com.
OIL-SELL strategy 6 hourly chart Reg. ChannelOIL has moved up sharply and we are moving beyond the regression channel. This usually will not last especially when overbought status.
Stragtegy SELL @ $ 70.90-71.30 and take profit near 69.37 for now.
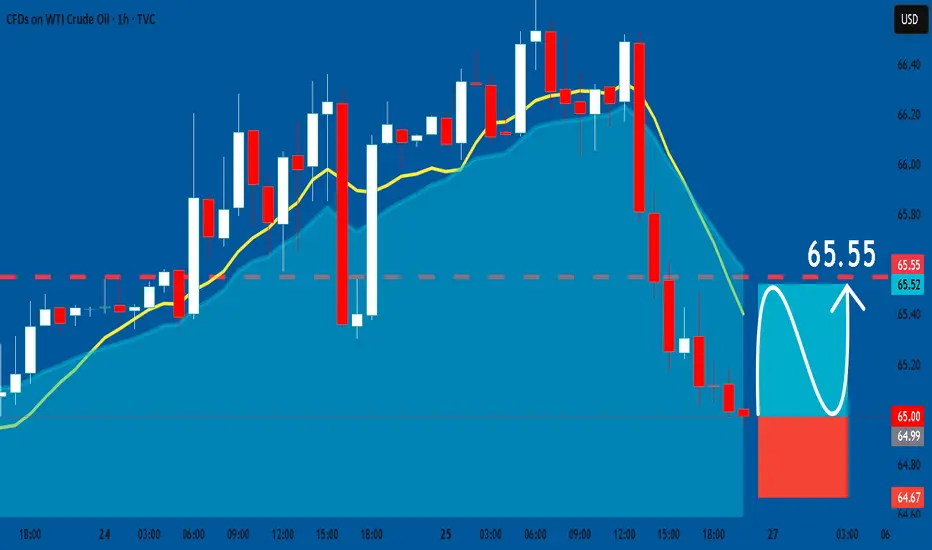
USOIL: Long Trade with Entry/SL/TP
USOIL
- Classic bullish setup
- Our team expects bullish continuation
SUGGESTED TRADE:
Swing Trade
Long USOIL
Entry Point - 65.00
Stop Loss - 64.67
Take Profit - 65.55
Our Risk - 1%
Start protection of your profits from lower levels
Disclosure: I am part of Trade Nation's Influencer program and receive a monthly fee for using their TradingView charts in my analysis.
❤️ Please, support our work with like & comment! ❤️
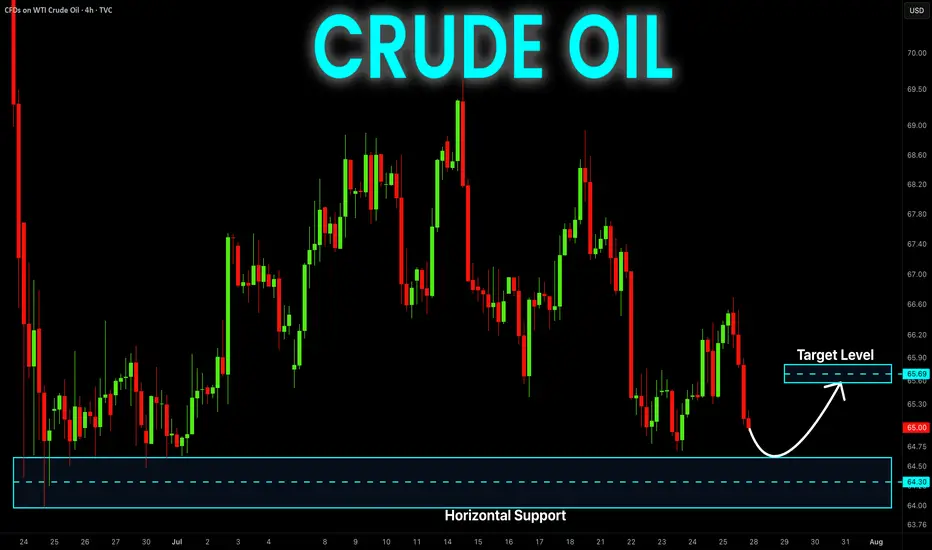
CRUDE OIL Risky Long! Buy!
Hello,Traders!
CRUDE OIL will soon hit
A horizontal support
Of 64.50$ and as it is
A strong level we will be
Expecting a local bullish
Rebound on Monday
Buy!
Comment and subscribe to help us grow!
Check out other forecasts below too!
Disclosure: I am part of Trade Nation's Influencer program and receive a monthly fee for using their TradingView charts in my analysis.
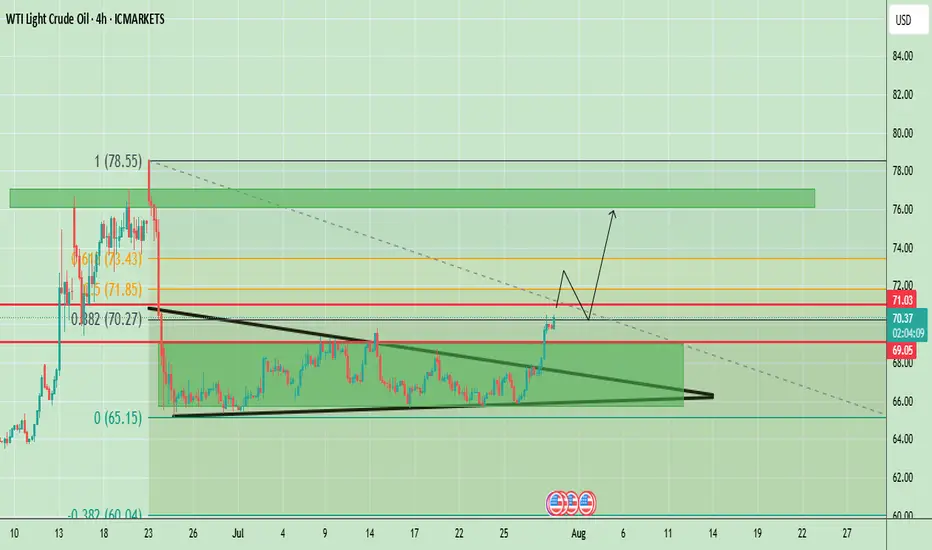
WTI Crude Oil Breaks Out of Symmetrical Triangle, $73-$76 ZoneThe WTI Crude Oil chart shows a strong breakout from the symmetrical triangle pattern that was forming for several weeks. Price has decisively broken above the descending resistance trendline and is now testing the $70–$71 area, which aligns with the 0.382 Fibonacci retracement level (around $70.27) and an important horizontal resistance ($71.03). This breakout indicates strong bullish momentum, supported by the recent series of higher lows and a sharp upward move in recent sessions.
If price sustains above $69.05 (previous breakout zone), we could see a bullish continuation towards $73.40 (0.118 Fibonacci) and potentially to $76.00–$76.50, which is the upper resistance block marked on the chart. However, if the price fails to hold above $69.00, there could be a pullback to retest the broken triangle resistance around $67–$68 before any next bullish leg.
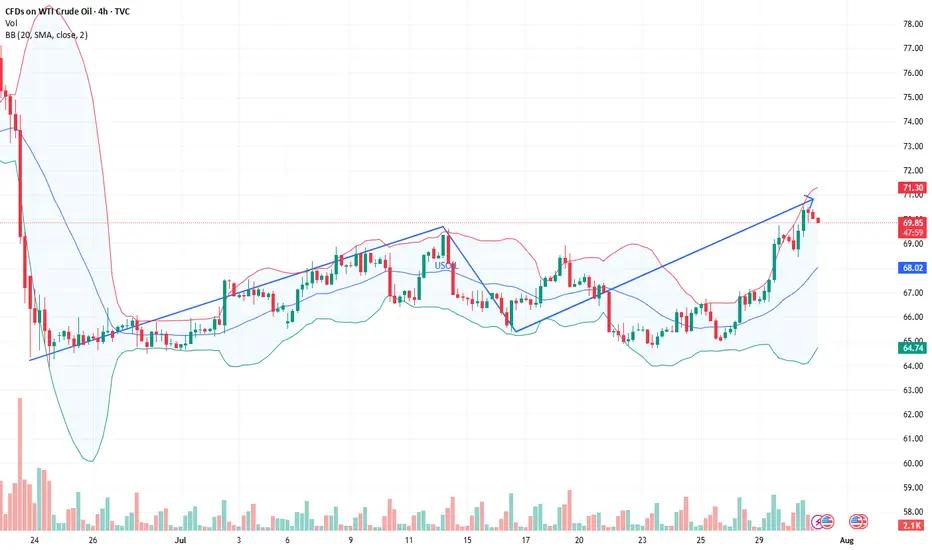
Weekly Chart
The weekly chart of WTI Crude Oil is showing a long-term downtrend channel, where price has been consistently making lower highs and lower lows since mid-2023. Currently, oil is trading around $69.96, showing a sharp bullish push of 6.13% for the week. However, the price is still inside the broader descending channel, which keeps the long-term trend bearish unless a confirmed breakout occurs.
Key Resistance Levels:
- $70.27, $71.03, $73.43
Support Levels:
- $69.05 (previous breakout zone)
- $67.00–$68.00 (triangle retest area)
Trend Outlook:
- Short-Term: Bullish momentum; pullbacks likely to hold above $69.05.
- Medium-Term: If $71.85 breaks, price may target $76.00–$76.50 resistance.
Note
Please risk management in trading is a Key so use your money accordingly. If you like the idea then please like and boost. Thank you and Good Luck!
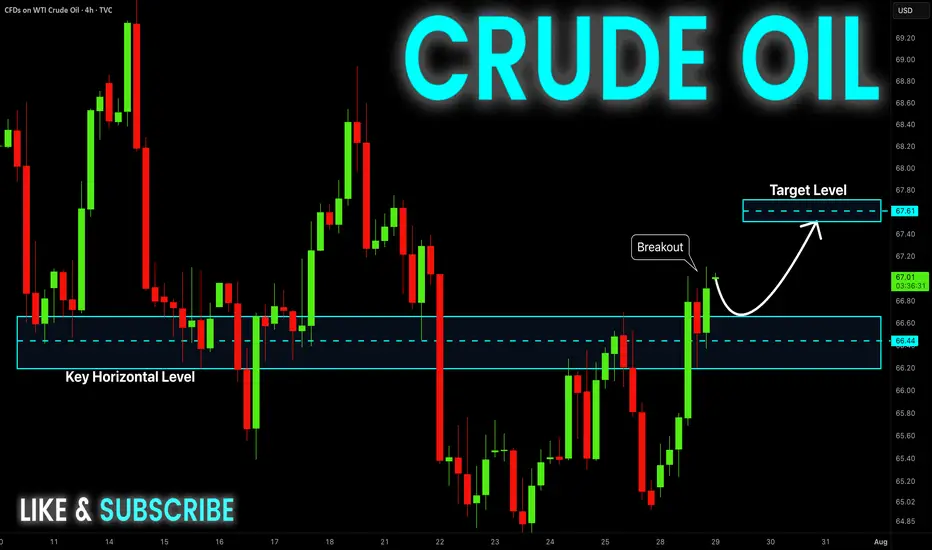
CRUDE OIL Bullish Continuation! Buy!
Hello,Traders!
CRUDE OIL made a rebound
From the support just as
I predicted and the price
Went further still and broke
The key horizontal level
Of 66.50$ and the breakout
Is confirmed so we are
Bullish biased and we will be
Expecting a further bullish
Move up!
Buy!
Comment and subscribe to help us grow!
Check out other forecasts below too!
Disclosure: I am part of Trade Nation's Influencer program and receive a monthly fee for using their TradingView charts in my analysis.
Is the surge in crude oil bulls here a comeback?The news-driven support for crude oil's recent rally is almost exhausted, so we'll continue to adopt a buy-low-sell-high strategy today, using a small stop-loss to maximize profits.
Short at $71.20, with a stop-loss at $71.70 and a take-profit at $69.20. (For aggressive shorting, try shorting at $70.95).
The above strategy is Charlie's personal opinion and is for reference only. If you follow suit, please be cautious and use a stop-loss to protect your position. TVC:USOIL FOREXCOM:USOIL TRADU:USOIL TRADU:USOIL
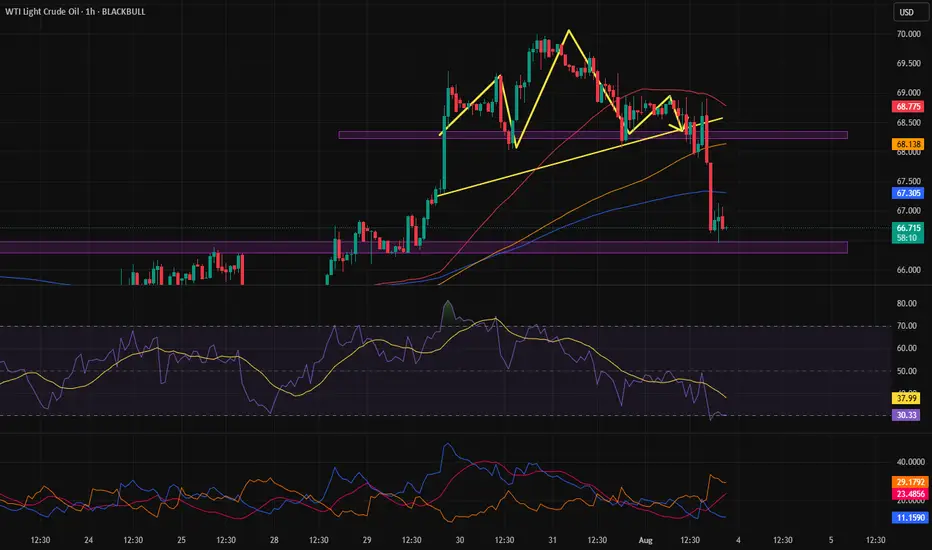
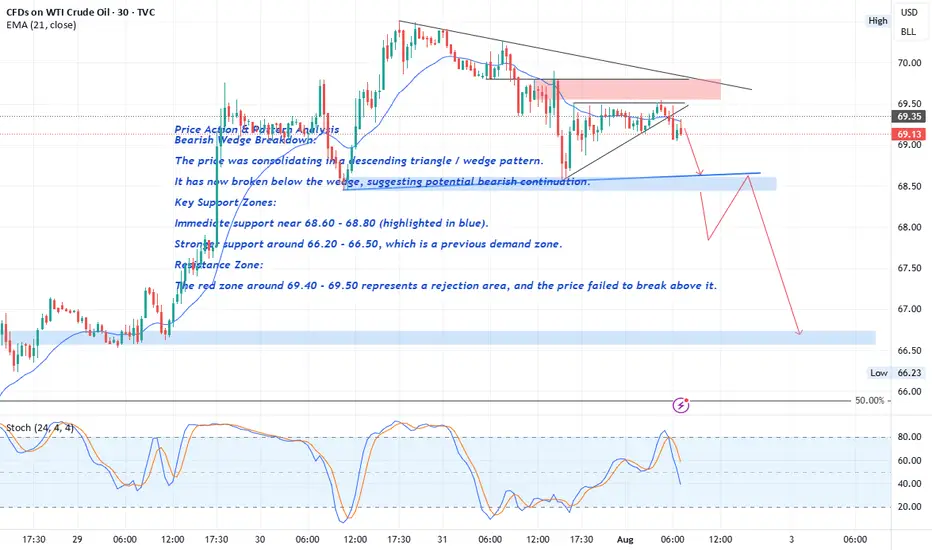
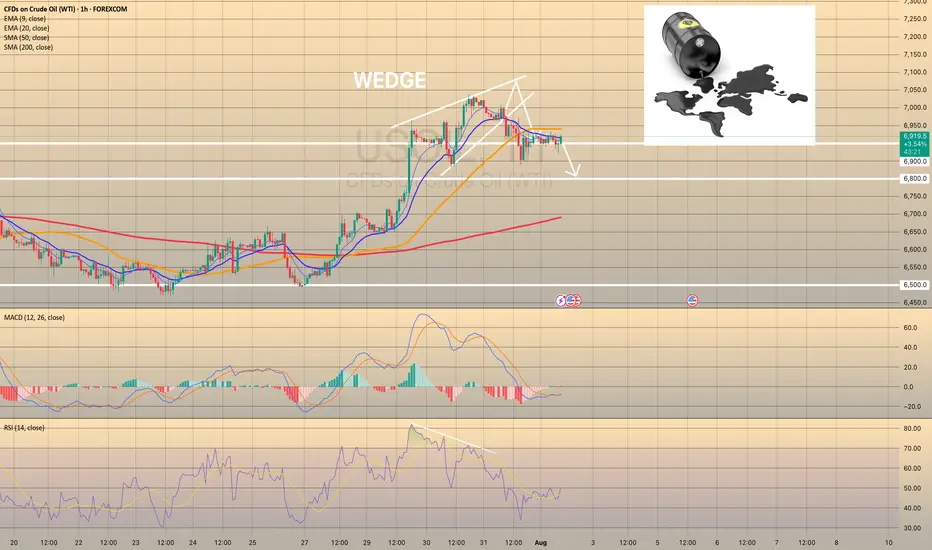
Crude Oil Price Action & Pattern Analysis
Bearish Wedge Breakdown:
The price was consolidating in a descending triangle / wedge pattern.
It has now broken below the wedge, suggesting potential bearish continuation.
Key Support Zones:
Immediate support near 68.60 - 68.80 (highlighted in blue).
FOREXCOM:USOIL
The break of the 68.60 level with a strong bearish candle would serve as confirmation of a Head and Shoulders (H&S) pattern , with solid bearish implications.
Stronger support around 66.20 - 66.50 , which is a previous demand zone.
Resistance Zone:
The red zone around 69.40 - 69.50 represents a rejection area , and the price failed to break above it.
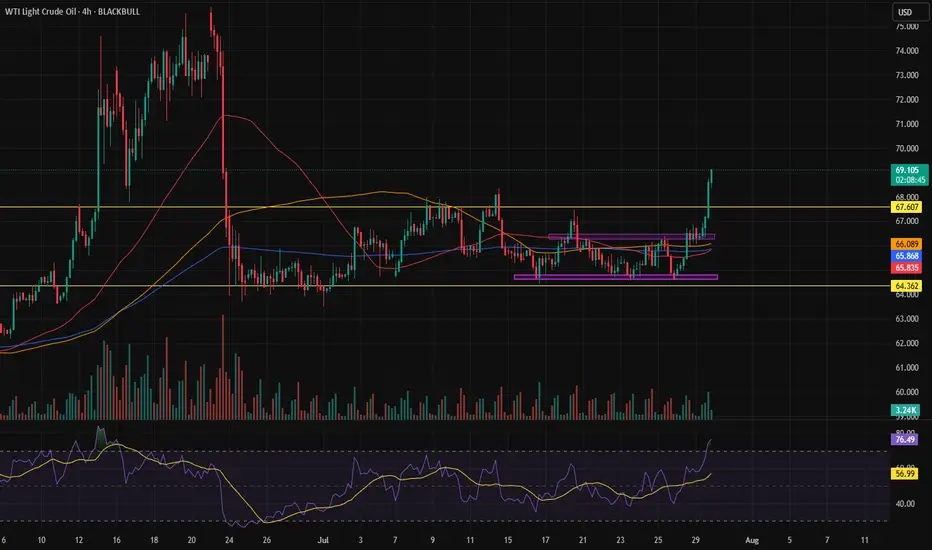
After 35 daysOil finally broke out of the range after 35 days, and now it’s time to wait for a trigger to enter and follow the trend.
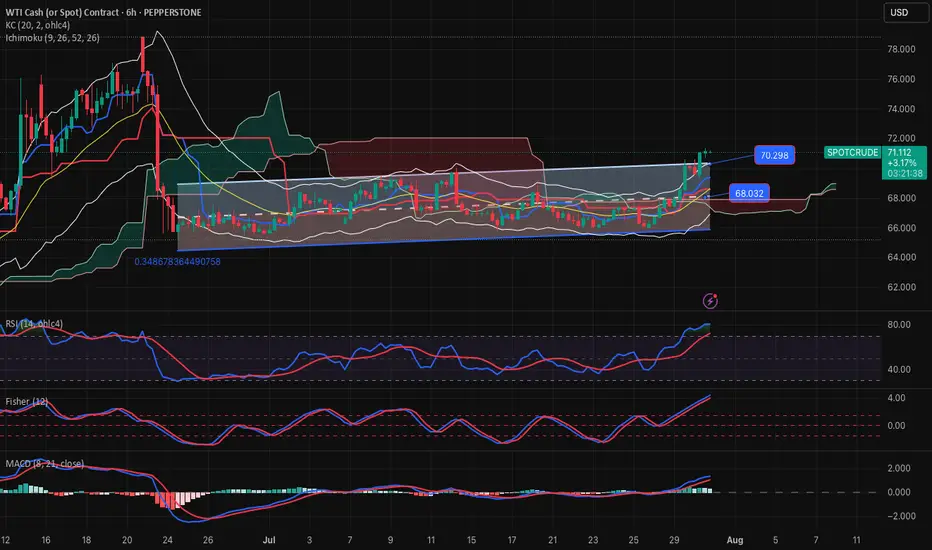
Crude Oil: Buying Pressure StrengthensFenzoFx—Crude Oil maintained its bullish trend with an ideal dip for entry on July 25. Stochastic and RSI 14 indicate overbought conditions, suggesting intensified buying pressure. A breakout seen yesterday reinforces the bullish bias.
Our projection remains optimistic, targeting a move toward the Fair Value Gap zone, extending to $73.8. However, if Oil closes below the $69.3 support, the bullish outlook will be invalidated.

XTIWith santions on Russia by EU and the projection of a saction by US which 50days ultimatum now reduced 12 days. This good fuel global demand having Russia as the 4th 3rd largest producer of crudeoil.

USOIL REACHED THE 6,900.00 SUPPORT LEVEL. WHAT'S NEXT?USOIL REACHED THE 6,900.00 SUPPORT LEVEL. WHAT'S NEXT?
As we told July 31, the price got reversed towards first support level of 6,900.00. Market participants are waiting for the OPEC+ meeting this week, expecting a significant output hike. Currently, the price sits slightly above the support level. Although, the asset trades above this level, considering the current weakness of the asset, further decline is expected. The 6,800.00 support level is the next target here.
USOILBullish senaorio
"BUY Call / Long – Strong upside trend across most timeframes, supported by disrupted supply, elevated oil prices due to real production losses, and renewed geopolitical risk."

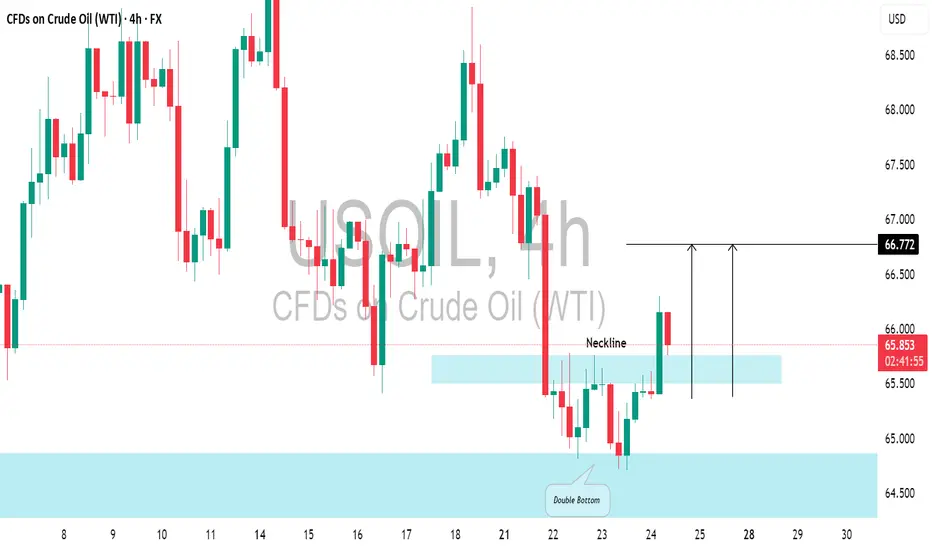
US CRUDE OIL (WTI): Pullback From Support📈USOIL responded well to the highlighted daily support level.
The price formed a double bottom pattern on that and broke above its neckline.
There's a strong likelihood that the price will continue to increase and reach 66.72 shortly.