AUDUSD TRADE IDEA Good day all. We seem to be in for a continuation trade on AUDUSD.
We seem to be in for a move to the upside.
We anticipate a pullback to our Fibonacci level and then a continuation move to the upside.
It's all about waiting at the moment
USDAUD trade ideas
AUDUSD reaches six-month highs8 July’s surprising hold by the RBA helped the Aussie dollar to recover lost ground against its American counterpart and push up to a new high. Sentiment seems to be mostly discounting the American governments announcements about upcoming tariffs while underlying data from Australia are somewhat positive or at least certainly not as negative as had been expected around the beginning of the year.
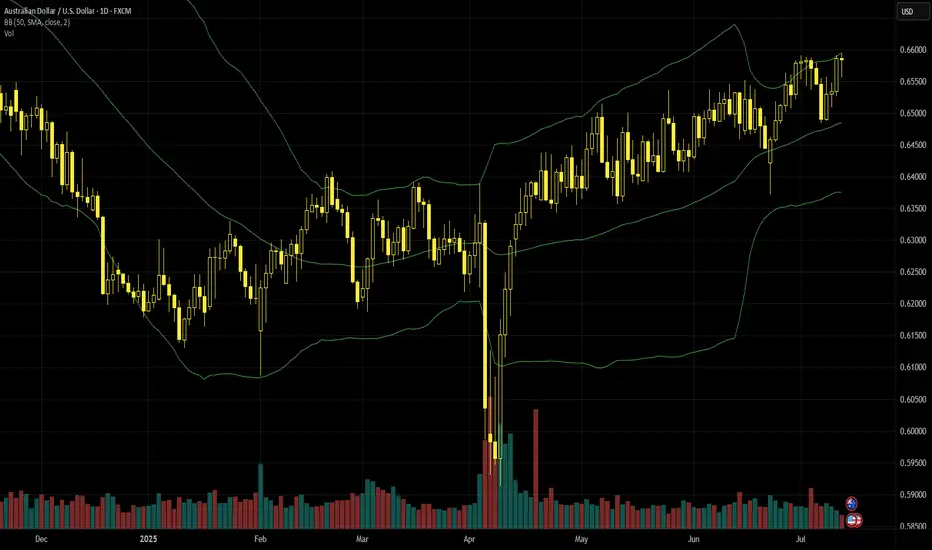
The 61.8% weekly Fibonacci retracement around 65.5c still seems to be a main technical reference because the price hasn’t decisively broken beyond this area yet. With extremely low volume compared to peaks in early April, ATR reaching new lows, the slow stochastic close to overbought and momentum from the chart seemingly lower, there’s a real possibility that the trend might change and the price try to push lower. The value area between the 20 and 50 SMA around 65c and particularly the 50 SMA itself look like possibly important supports in the short term.
If the uptrend continues, the next strong resistance isn’t obvious. 67c is the area of the 200 SMA on the weekly chart but that’s still quite a long way off. Equally, the price might consolidate in the runup to American inflation on Tuesday 15 July.
This is my personal opinion, not the opinion of Exness. This is not a recommendation to trade.
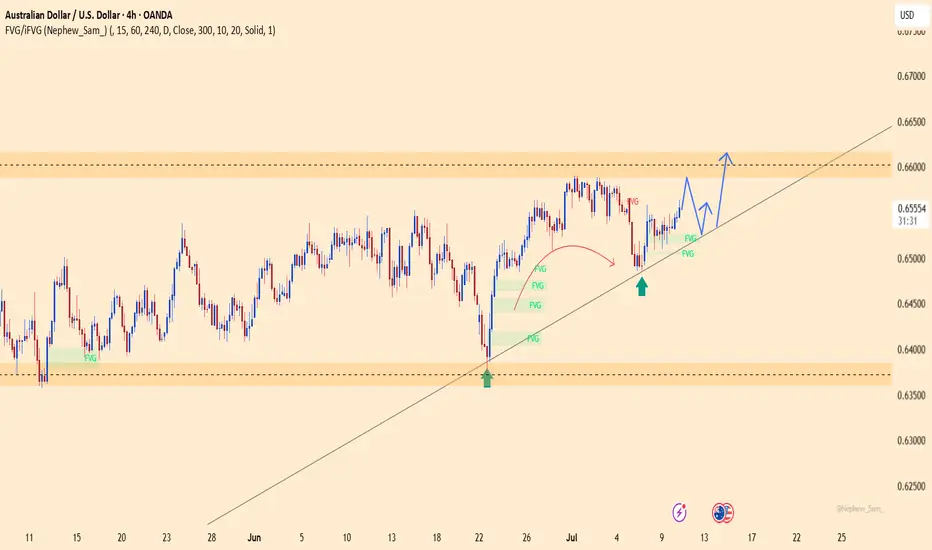
AUDUSD – The Spring Is Loading!AUDUSD has just pulled off an impressive rebound from the 0.6460 support zone, bouncing cleanly off the ascending trendline — like a compressed spring ready to launch. The repeated appearance of Fair Value Gaps after recent upward moves reveals a critical clue: smart money is stepping back in, and this time, they want control.
The price is now testing the familiar resistance at 0.6616 — a zone that has previously rejected several bullish attempts. But this time feels different. The US dollar is clearly losing steam after softer CPI data, pushing bond yields lower and giving AUD a tactical edge.
If the 0.6520 support holds strong, the next breakout won’t just be about overcoming resistance — it could be the spark for a new bullish wave. And when that wave hits... it won’t go unnoticed.
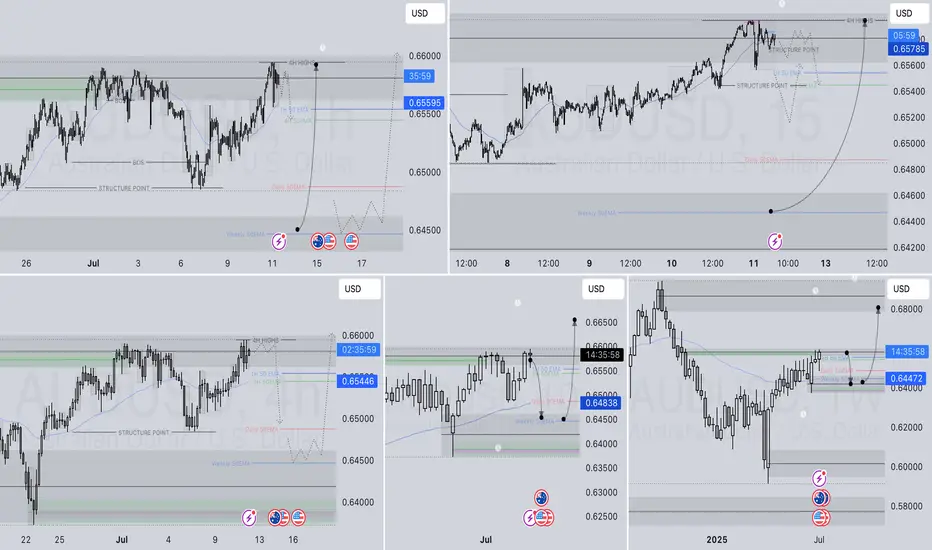
AUDUSD SHORT & LONG FORECAST Q3 D11 W28 Y25AUDUSD SHORT & LONG FORECAST Q3 D11 W28 Y25
It’s Fun Coupon Friday! 💸🔥
Professional Risk Managers👋
Welcome back to another FRGNT chart update📈
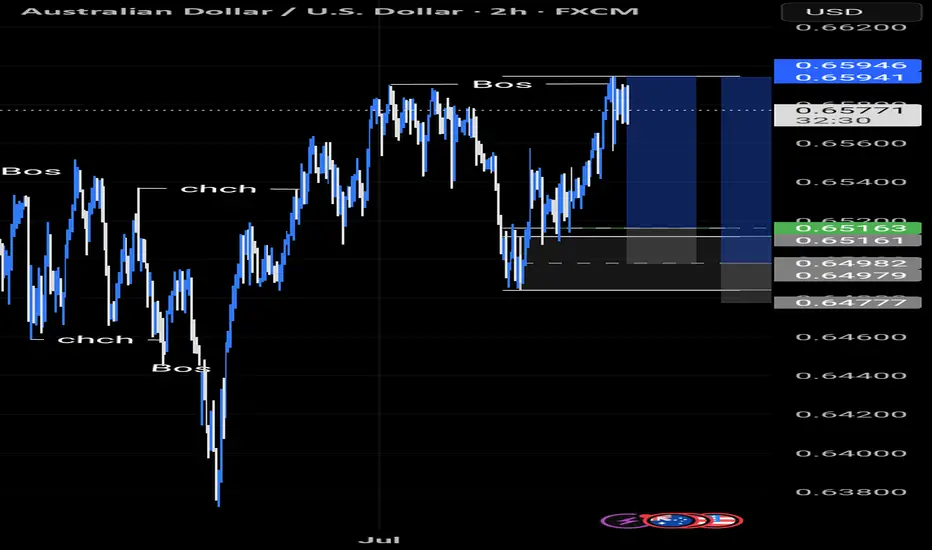
Diving into some Forex setups using predominantly higher time frame order blocks alongside confirmation breaks of structure.
Let’s see what price action is telling us today! 👀
💡Here are some trade confluences📝
✅Daily Order block identified
✅4H Order Block identified
✅1H Order Block identified
🔑 Remember, to participate in trading comes always with a degree of risk, therefore as professional risk managers it remains vital that we stick to our risk management plan as well as our trading strategies.
📈The rest, we leave to the balance of probabilities.
💡Fail to plan. Plan to fail.
🏆It has always been that simple.
❤️Good luck with your trading journey, I shall see you at the very top.
🎯Trade consistent, FRGNT X
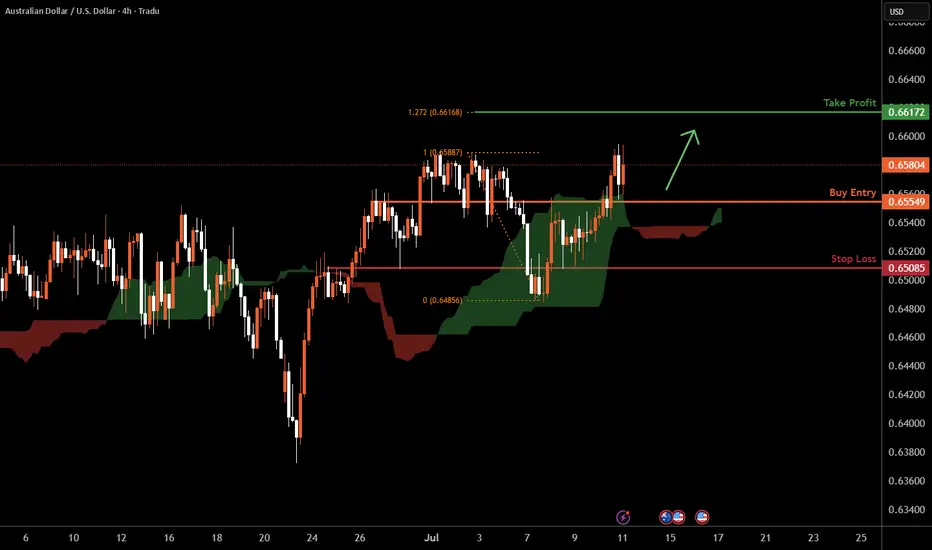
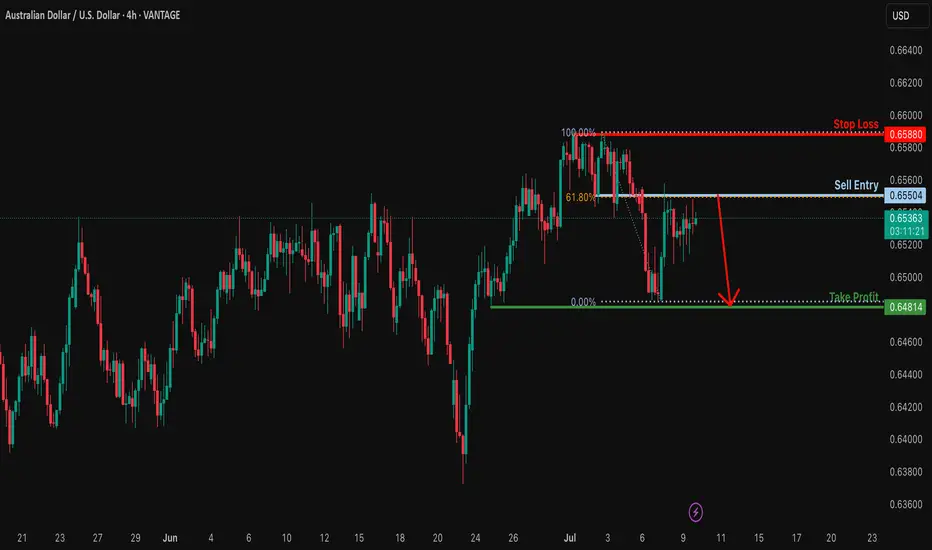
AUDUSD H4 I Bullish Bounce Off Based on the H4 chart, the price could fall toward our buy entry level at 0.6554, a pullback resistance.
Our take profit is set at 0.6617, aligning with the 127.2% Fib extension.
The stop loss is set at 0.6508, an overlap support.
High Risk Investment Warning
Trading Forex/CFDs on margin carries a high level of risk and may not be suitable for all investors. Leverage can work against you.
Stratos Markets Limited (tradu.com ):
CFDs are complex instruments and come with a high risk of losing money rapidly due to leverage. 63% of retail investor accounts lose money when trading CFDs with this provider. You should consider whether you understand how CFDs work and whether you can afford to take the high risk of losing your money.
Stratos Europe Ltd (tradu.com ):
CFDs are complex instruments and come with a high risk of losing money rapidly due to leverage. 63% of retail investor accounts lose money when trading CFDs with this provider. You should consider whether you understand how CFDs work and whether you can afford to take the high risk of losing your money.
Stratos Global LLC (tradu.com ):
Losses can exceed deposits.
Please be advised that the information presented on TradingView is provided to Tradu (‘Company’, ‘we’) by a third-party provider (‘TFA Global Pte Ltd’). Please be reminded that you are solely responsible for the trading decisions on your account. There is a very high degree of risk involved in trading. Any information and/or content is intended entirely for research, educational and informational purposes only and does not constitute investment or consultation advice or investment strategy. The information is not tailored to the investment needs of any specific person and therefore does not involve a consideration of any of the investment objectives, financial situation or needs of any viewer that may receive it. Kindly also note that past performance is not a reliable indicator of future results. Actual results may differ materially from those anticipated in forward-looking or past performance statements. We assume no liability as to the accuracy or completeness of any of the information and/or content provided herein and the Company cannot be held responsible for any omission, mistake nor for any loss or damage including without limitation to any loss of profit which may arise from reliance on any information supplied by TFA Global Pte Ltd.
The speaker(s) is neither an employee, agent nor representative of Tradu and is therefore acting independently. The opinions given are their own, constitute general market commentary, and do not constitute the opinion or advice of Tradu or any form of personal or investment advice. Tradu neither endorses nor guarantees offerings of third-party speakers, nor is Tradu responsible for the content, veracity or opinions of third-party speakers, presenters or participants.
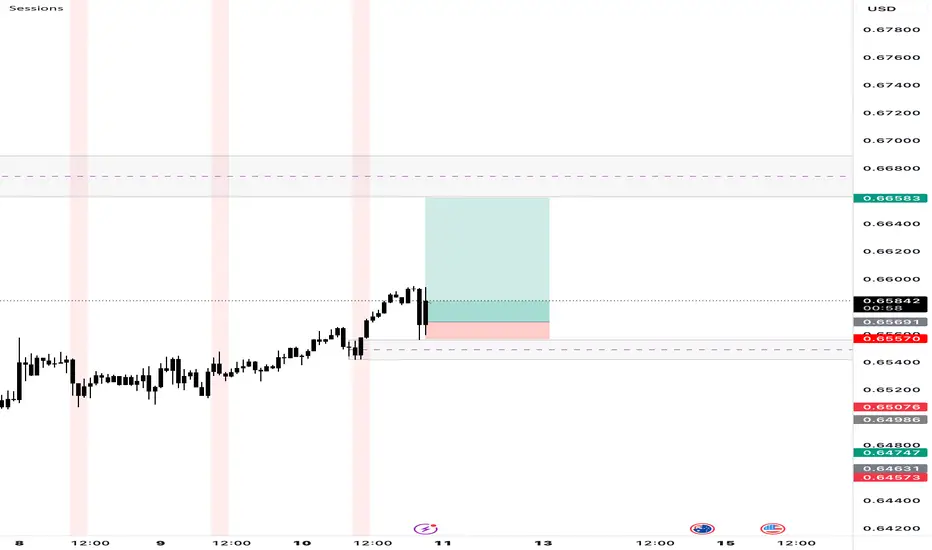
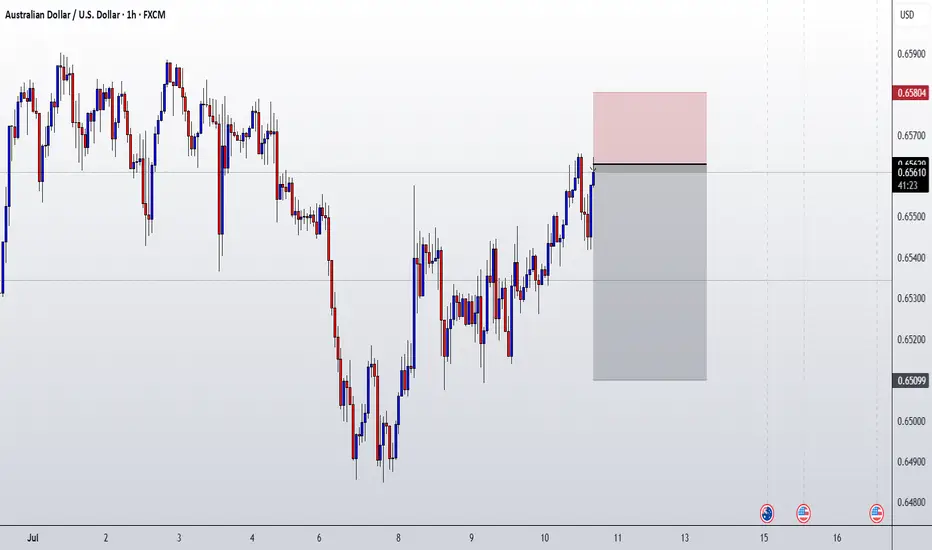
AUD/USD Long Setup – 1H Demand to 4H Supply 🧠 Trade Breakdown:
Price tapped into a clear 1H demand zone and showed bullish reaction. The setup is targeting a 4H supply zone above. This is a classic demand-to-supply flow with room for clean upside.
⸻
📍 Key Confluences:
• Strong 1H demand (reaction zone clearly respected)
• Clear bullish structure: Higher highs + higher lows
• 4H supply zone above as natural target zone
• Momentum supported by clean bullish candles on the way up
• Entry aligns with a pullback to demand zone wick rejection
⸻
📈 Trade Setup:
• Pair: AUD/USD
• Entry: 0.65881
• Stop Loss: 0.65570 (below demand wick)
• Take Profit: 0.66583 (4H supply zone)
• Risk-to-Reward (RR): ~1:6
⸻
🧠 Mindset:
Let this setup breathe — it’s demand into higher timeframe supply. No need to panic on minor retracements. Trust your bias. Let the setup develop. Protect your capital, but don’t micromanage the trade.
“Trade Simple. Live Lavish.”
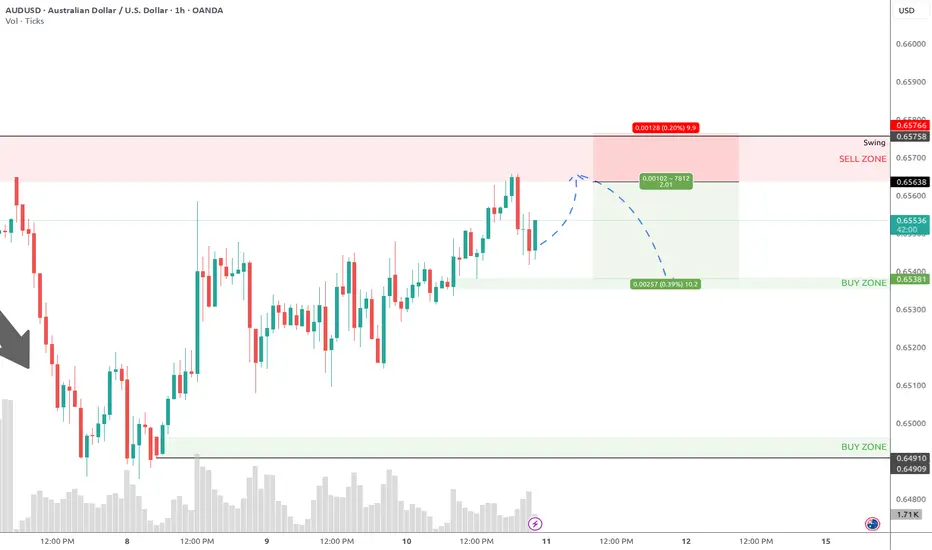
AUDUSD 60/5 Pullback Short1-hr chart showing bear and now the price is at sell zone. Wait for pull up and short.
RRR could be higher than +2R is the pull up is greater.
AUD/USD: Short Setup to 0.6450This trade idea is rooted in a data-driven approach, leveraging a rare asymmetry in the economic calendar and specific quantitative models to identify a high-clarity opportunity.
📊 The Thesis by the Numbers
My model assigns clear probabilities to the potential scenarios for this week, based on the scheduled U.S. data releases.
60% Probability: Base Case (USD Strength). Triggered by a U.S. Core CPI reading at or above 0.3% MoM.
30% Probability: Alternative Case (USD Weakness).
10% Probability: Wildcard Scenario (Risk-On Rally).
🧠 The Data-Driven Rationale
This setup scored a -5 on my quantitative thesis model, indicating a strong bearish conviction. The core of this is the one-sided event risk. With Australia's calendar completely empty, the AUD is a sitting duck. Meanwhile, a volley of tier-one U.S. data (CPI, PPI, Retail Sales) is expected to confirm a robust economy. This fundamental divergence, combined with a technical picture of price coiling below long-term resistance, creates the conditions for a catalyst-driven drop.
⛓️ Intermarket & Statistical Edge
Further analysis of market correlations and forward-looking models reinforces the bearish bias.
🌐 Correlations: The positive correlation of AUD/USD with equities (SPY: +0.31) suggests that a strong USD report, which could pressure stocks, would create a direct headwind for the Aussie.
🎲 Monte Carlo Simulation: While the mean outcome is neutral, the model's 5th percentile for price is down at 0.6503 , highlighting the statistical risk of a significant downside move if the catalyst fires.
✅ The Trade Setup
📉 Bias: Bearish / Short
👉 Entry: Watch for a bearish reversal pattern on the 1H or 4H chart within the $0.6550 resistance zone.
⛔️ Stop Loss: A decisive daily close above the 0.6622 resistance level.
🎯 Target: 0.6458 (June low-day close).
Good luck, and trade safe.


Sell entry from resistance level -ForexbdThe price is currently at the resistance line on the AUDUSD H-4 timeframe. If the price fails to break this resistance level, the price will go into a downtrend.
⭕️Risk Warning : Trading on financial markets carries risks!
©FXBD Official Team
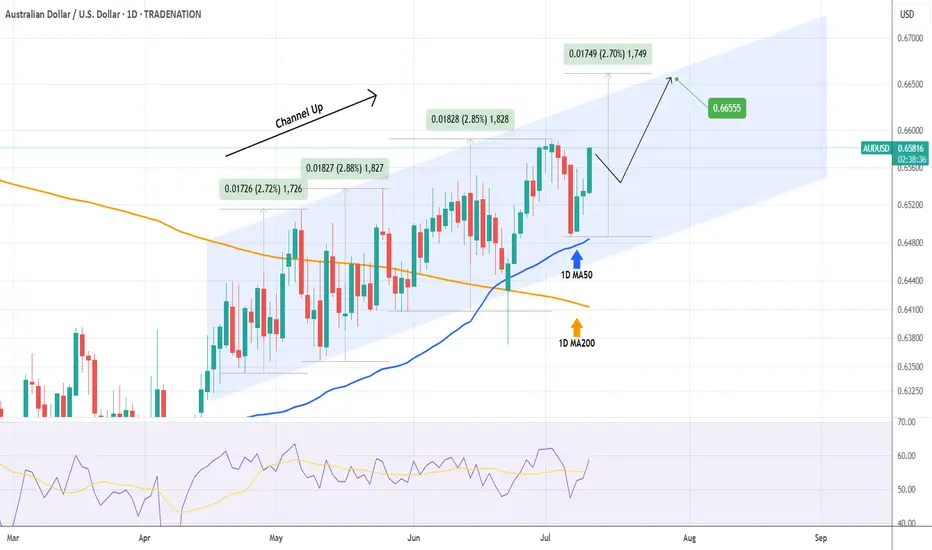
AUDUSD Strong bullish momentum inside this Channel Up.The AUDUSD pair has been trading within a 3-month Channel Up pattern and on Monday almost hit its 1D MA50 (blue trend-line) and rebounded. This is the start of its new Bullish Leg.
Based on the previous ones, it should complete a +2.70% rise at least. As long as the 1D MA50 (blue trend-line) holds, we are bullish, targeting 0.66555.
-------------------------------------------------------------------------------
** Please LIKE 👍, FOLLOW ✅, SHARE 🙌 and COMMENT ✍ if you enjoy this idea! Also share your ideas and charts in the comments section below! This is best way to keep it relevant, support us, keep the content here free and allow the idea to reach as many people as possible. **
-------------------------------------------------------------------------------
Disclosure: I am part of Trade Nation's Influencer program and receive a monthly fee for using their TradingView charts in my analysis.
💸💸💸💸💸💸
👇 👇 👇 👇 👇 👇
AUDUSD ENTRY CHARTOn this Pair, we are still BEARISh, the Dollar is still very much Strong,price retrace back to our H1 zone that we have been watching out for, we got our Entry Confirmations with other Confluences, If this matches with your Trade idea, you can add to your watch-list, and if joined, kindly dont forget to move BREAK-EVEn,after +1R, or check the update section, THANK YOU, and Dont forget to RISK WISELY
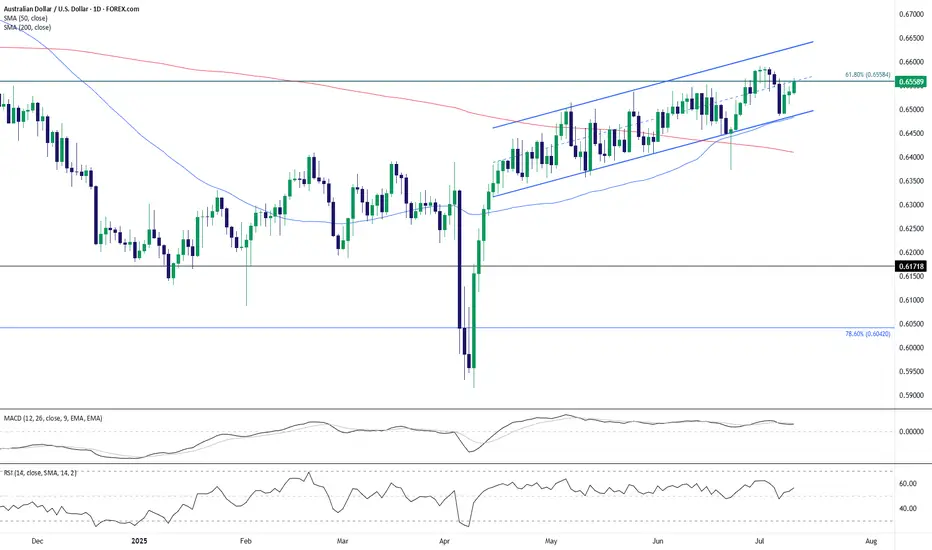
AUD/USD Rebounds From Channel Support – Eyes on 0.66 BreakoutThe Australian dollar is pressing higher against the U.S. dollar after rebounding from the lower boundary of a rising parallel channel. Price remains above both the 50-day and 200-day SMAs, with the latter recently reclaimed — a bullish sign for medium-term trend strength.
The pair is now testing the 61.8% Fibonacci retracement of the July 2023–April 2024 decline at 0.6558, which has been a sticky resistance zone. A clean break above this level would put the upper boundary of the channel — currently near 0.6670 — in focus.
Indicators:
MACD is flat but on the verge of turning higher, suggesting early signs of renewed momentum.
RSI is at 56, pointing to modest bullish momentum with room to run before reaching overbought territory.
Key Levels:
Resistance: 0.6558 (Fibonacci), followed by the channel top near 0.6670.
Support: 0.6480 (channel base and 50-day SMA), then 0.6409 (200-day SMA).
Conclusion:
AUD/USD is holding within a constructive channel pattern with support from key moving averages. A sustained break above 0.6558 would confirm bullish continuation toward the upper end of the range. Traders may look for confirmation through momentum indicators and daily close strength.
-MW
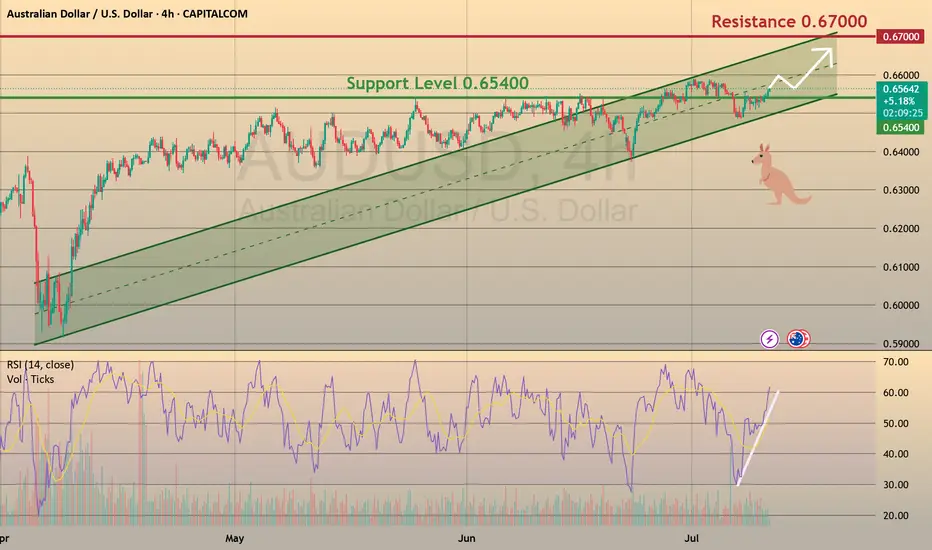
Aussie: Still Growing!
CAPITALCOM:AUDUSD
The bullish momentum continues after our last successful AUDUSD setup, and a move toward the 0.65900 resistance area looks probable now.
🪙 My Trading Plan:
🔼 BUY Stop: 0.65648
❌ Stop Loss: 0.65320
✅ Take Profit: 0.65965
💡 Why am I buying here?
✅ Price broke recent resistance at 0.65500, activating buy trades.
✅ RSI confirm ongoing bullish momentum 📊.
📰 Fundamental Situation:
🏦 RBA Rate Decision Supports AUD
The Reserve Bank of Australia (RBA) surprised markets by holding rates steady at 3.85% 🏛️, diverging from expectations of a cut. This cautious stance reflects the RBA’s preference to wait for clearer signs of slowing inflation 📉 before adjusting policy further.
Governor Michele Bullock emphasized that inflation risks remain persistent ⚠️, driven by high labor costs and weak productivity, possibly requiring a longer period of restrictive policy ⏳. Deputy Governor Andrew Hauser noted the bank is closely monitoring global risks 🌐, especially US tariff developments, underscoring sensitivity to global headwinds that could impact trade and growth 📦.
🌎 Trade Tensions in Focus:
President Trump ruled out extending tariff deadlines beyond August 1 ⛔, announcing new duties:
🔹 50% on copper 🪙
🔹 Potential 200% on pharmaceuticals 💊
🔹 10% on goods from BRICS 🌐
These moves are likely to intensify global trade tensions ⚔️, potentially impacting commodity flows and inflation, which the RBA and markets will continue to monitor closely.
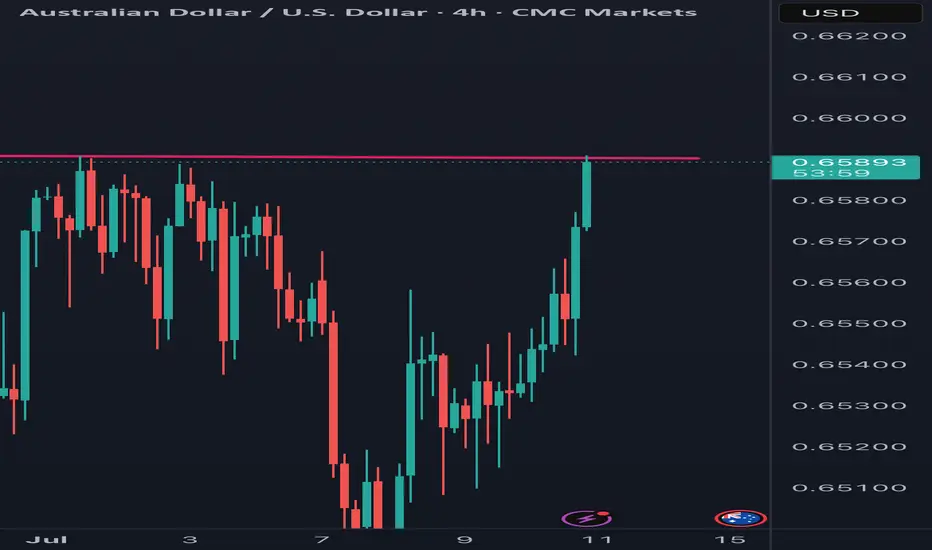
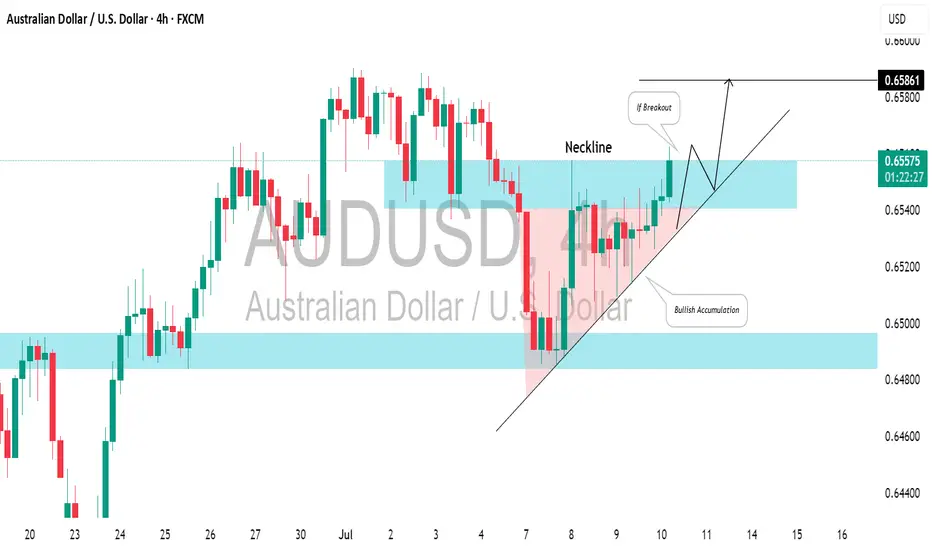
AUDUSD: Bullish Accumulation?!Quick update for ⚠️AUDUSD:
The price formed a classic bullish pattern on a 4-hour chart known as the ascending triangle, indicating bullish accumulation and a likely upward movement.
To confirm this, we will adhere to the previously discussed plan, waiting for a breakout above 0.6560 and a 4-hour candle close above that level, which could lead to a potential rise to 0.6586.
Conversely, a bearish breakout below the triangle's trend line would signal a strong downward movement.
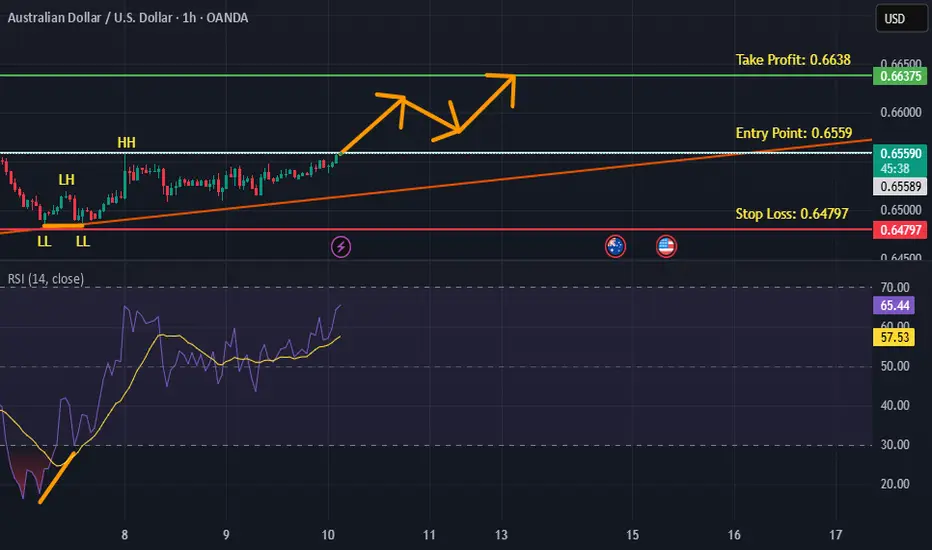
AUDUSD is BullishPrice was in a downtrend, however after the formation of a double bottom a higher high is printed which is an indication of the beginning of a bullish trend. Once the freshly printed higher high is broken we can expect continuation of the bullish trend as per Dow theory. Targets are mentioned on the chart.
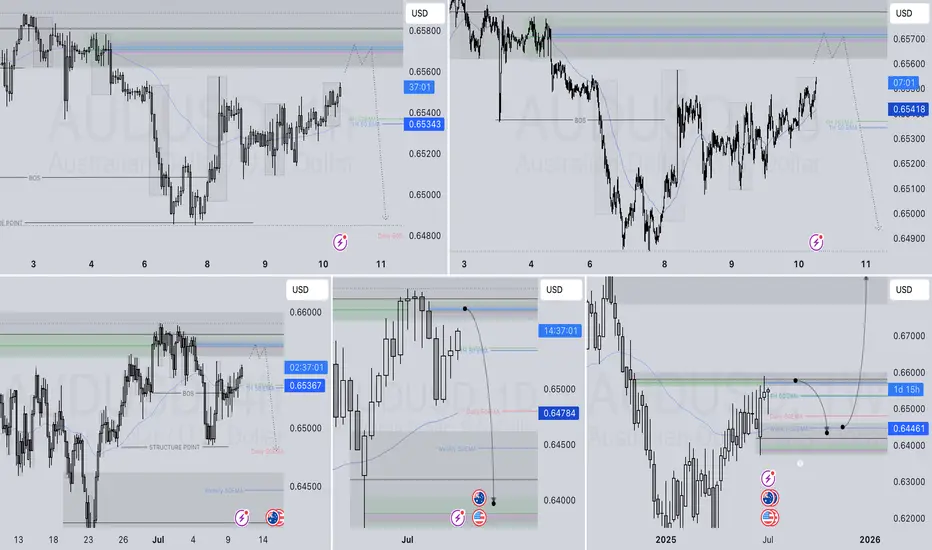
AUDUSD SHORT FORECAST Q3 D10 W28 Y25AUDUSD SHORT FORECAST Q3 D10 W28 Y25
Professional Risk Managers👋
Welcome back to another FRGNT chart update📈
Diving into some Forex setups using predominantly higher time frame order blocks alongside confirmation breaks of structure.
Let’s see what price action is telling us today! 👀
💡Here are some trade confluences📝
✅Daily Order block identified
✅4H Order Block identified
✅1H Order Block identified
🔑 Remember, to participate in trading comes always with a degree of risk, therefore as professional risk managers it remains vital that we stick to our risk management plan as well as our trading strategies.
📈The rest, we leave to the balance of probabilities.
💡Fail to plan. Plan to fail.
🏆It has always been that simple.
❤️Good luck with your trading journey, I shall see you at the very top.
🎯Trade consistent, FRGNT X
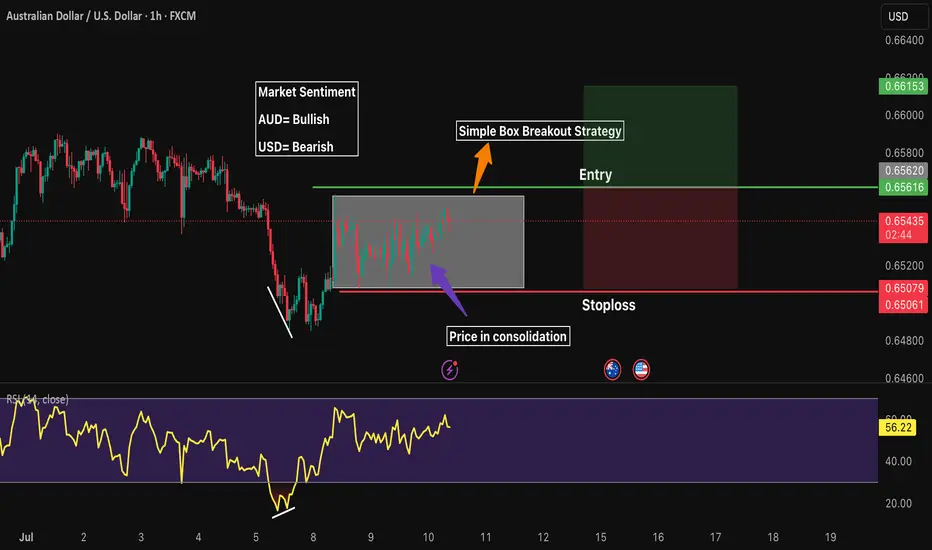
AUDUSD 1H LongMarket Sentiment
AUD= Bullish
USD= Bearish
Waiting for price to breakout from its consolidation box
RR 1:1
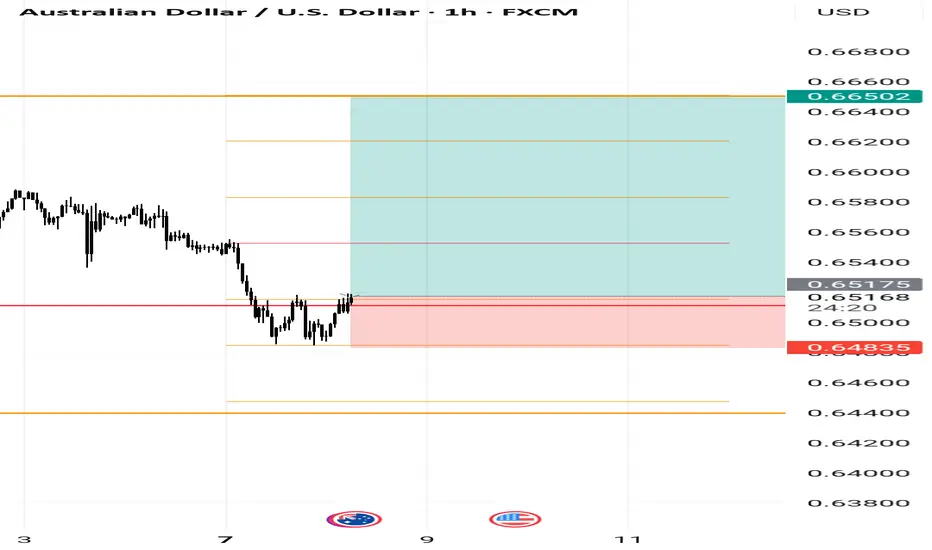
Buy AUDI see a W on weekly pivot at the 1H chart
price in 1D seems in up trend and RR is good. lets see
AUD/USD Struggles at ResistanceAUD/USD is now nearly 1.6% off the highs with the weekly opening-range taking shape just below Fibonacci resistance- looking for a potential breakout in the days ahead.
A look at Aussie price action shows AUD/USD reversing pitchfork resistance with the weekly opening-range taking shape just below resistance at the 61.8% retracement of the 2024 decline / weekly open at 6550/53- looking for a reaction off this mark.
A top-side breach of the weekly opening-range exposes the upper parallel again, currently near ~6600. Ultimately, a close above the September low at 6622 is needed to fuel the next major leg of the advance with subsequent resistance objectives eyed at the 2019 low at 6671 and the 78.6% retracement near 6723.
Initial support rests with the June low-day close (LDC) at 6458- note that the 75% parallel converges on this threshold into the close of the week and a break / close below would threaten a larger Aussie pullback. Subsequent support objectives rest at the 200-day moving average (currently ~6411) and 6332/62- a region defined by the 38.2% retracement of the yearly range, the April / August 2024 lows, and the May swing low. Losses beyond this threshold would suggest a more significant high is in place / larger reversal is underway.
Bottom line: The Aussie rally failed into the trendline resistance with the monthly opening-range taking shape just below. While the broader outlook is still constructive, the advance remains vulnerable here and the immediate focus is on a breakout of the weekly range (6486-6553) for guidance. From a trading standpoint, losses would need to be limited to 6458 IF Aussie is heading for a breakout on this stretch with a close above 6622 needed to mark uptrend resumption.
-MB

Could the Aussie reverse from here?The price is rising towards the resistance level which is a pullback resistance that lines up with the 61.8% Fibonacci retracement and could drop from this level to our take profit.
Entry: 0.6650
Why we like it:
There is a pullback resistance that lines up with the 61.8% Fibonacci retracement.
Stop loss: 0.6588
Why we like it:
There is a pullback resistance.
Take profit: 0.6481
Why we like it:
There is a pullback support.
Enjoying your TradingView experience? Review us!
Please be advised that the information presented on TradingView is provided to Vantage (‘Vantage Global Limited’, ‘we’) by a third-party provider (‘Everest Fortune Group’). Please be reminded that you are solely responsible for the trading decisions on your account. There is a very high degree of risk involved in trading. Any information and/or content is intended entirely for research, educational and informational purposes only and does not constitute investment or consultation advice or investment strategy. The information is not tailored to the investment needs of any specific person and therefore does not involve a consideration of any of the investment objectives, financial situation or needs of any viewer that may receive it. Kindly also note that past performance is not a reliable indicator of future results. Actual results may differ materially from those anticipated in forward-looking or past performance statements. We assume no liability as to the accuracy or completeness of any of the information and/or content provided herein and the Company cannot be held responsible for any omission, mistake nor for any loss or damage including without limitation to any loss of profit which may arise from reliance on any information supplied by Everest Fortune Group.
China's PPI slides, Australian dollar steadyThe Australian dollar is almost unchanged on Wednesday. In the European session, AUD/USD is trading at 0.6532, up 0.03% on the day.
China's producer price index surprised on the downside in June, with a steep 3.6% y/y decline. TThe soft PPI report was driven by weak domestic demand and the continuing uncertainty over US tariffs. The lack of consumer demand was reflected in the weak CPI reading of 0.1% y /y, the first gain in four months. Monthly, CPI declined by 0.1%, following a 0.2% drop in May. There was a silver lining as core CPI rose 0.7% y/y, the fastest pace in 14 months.
The uncertainty over US President Trump's tariff policy continues to perplex the financial markets. Trump had promised a new round of tariffs against a host of countries on July 9 but he has delayed that deadline until August 1.
China, the world's second-largest economy after the US, has taken a hit from US tariffs, as China's exports to the US are down 9.7% this year, However, China has mitigated much of the damage as China's exports to the rest of the world are up 6%. There is a trade truce in effect between the two countries but the bruising trade war will continue to dampen US-China trade.
With no tier-1 events out of the US today, the FOMC minutes of the June meeting will be on center stage. The Fed held rates at that meeting and Fed Chair Powell, who has taken a lot of heat from Donald Trump to cut rates, defended his wait-and-see-attitude, citing the uncertainty that Trump's tariffs are having on US growth and inflation forecasts.his was below the May decline of 3.3% and the consensus of -3.2%. China has posted producer deflation for 33 successive months and the June figure marked the steepest slide since July 2023. Monthly, PPI declined by 0.4%, unchanged over the past three months.

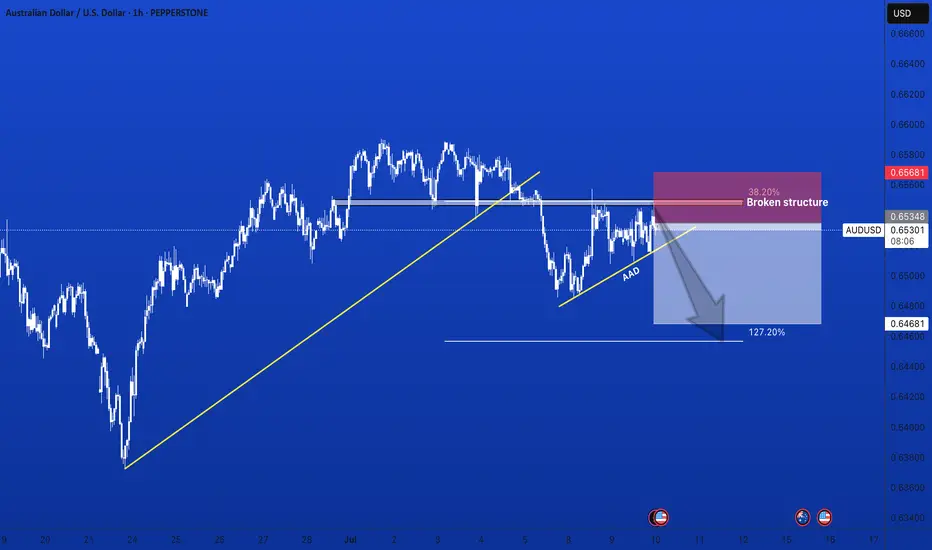
AUDUSD1 Hour chart: Price made a bearish impulse and it broke out of a recent structure level, price is currently testing the broken structure and it's forming a bearish correction.