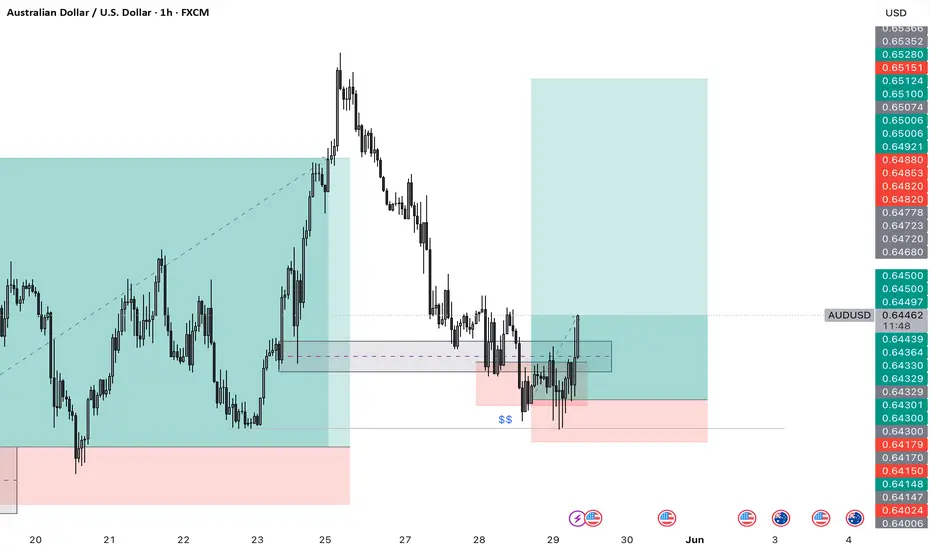
AUDUSD - NeutralStory : Market was making series of HH and HL, and then market consolidated. However, bullish rectangular pattern can be formed which indicates market will most likely continue bullish pattern with an upside breakout.
we anticipate market to give breakout on either side, with most chances of breakout on upside as the trend previously remained bullish.
We plan to enter market with buy stop on the market level- with SL and TPs defined on the chart.
USDAUD trade ideas

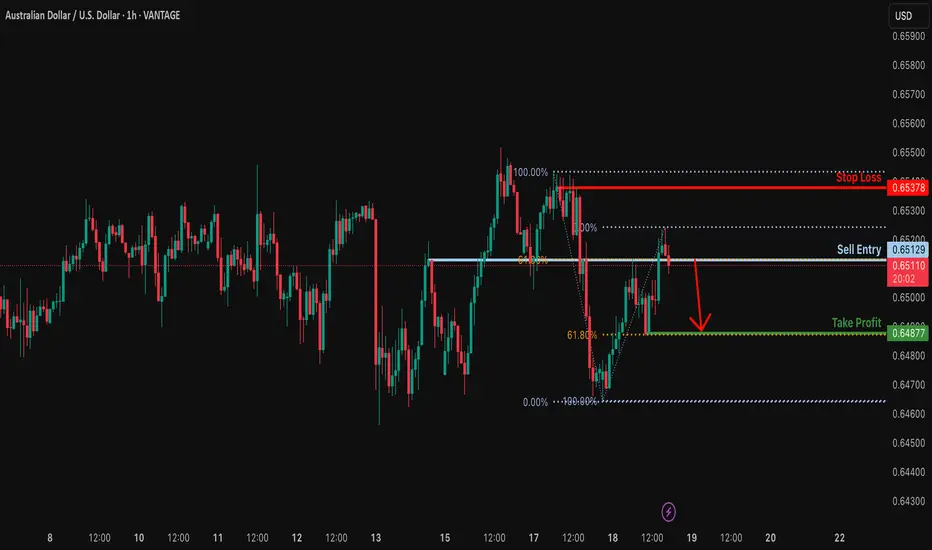
Potential bearish drop?AUD/USD is reacting off the resistance level which is an overlap resistance that aligns with the 61.8% Fibonacci retracement and could drop from this level to our take profit.
Entry: 0.6512
Why we like it:
There is an overlap resistance level that lines up with the 61.8% Fibonacci retracement.
Stop loss: 0.6537
Why we like it:
There is a pullback resistance level.
Take profit: 0.6487
Why we like it:
There is a pullback support level that aligns with the 61.8% Fibonacci retracement.
Enjoying your TradingView experience? Review us!
Please be advised that the information presented on TradingView is provided to Vantage (‘Vantage Global Limited’, ‘we’) by a third-party provider (‘Everest Fortune Group’). Please be reminded that you are solely responsible for the trading decisions on your account. There is a very high degree of risk involved in trading. Any information and/or content is intended entirely for research, educational and informational purposes only and does not constitute investment or consultation advice or investment strategy. The information is not tailored to the investment needs of any specific person and therefore does not involve a consideration of any of the investment objectives, financial situation or needs of any viewer that may receive it. Kindly also note that past performance is not a reliable indicator of future results. Actual results may differ materially from those anticipated in forward-looking or past performance statements. We assume no liability as to the accuracy or completeness of any of the information and/or content provided herein and the Company cannot be held responsible for any omission, mistake nor for any loss or damage including without limitation to any loss of profit which may arise from reliance on any information supplied by Everest Fortune Group.
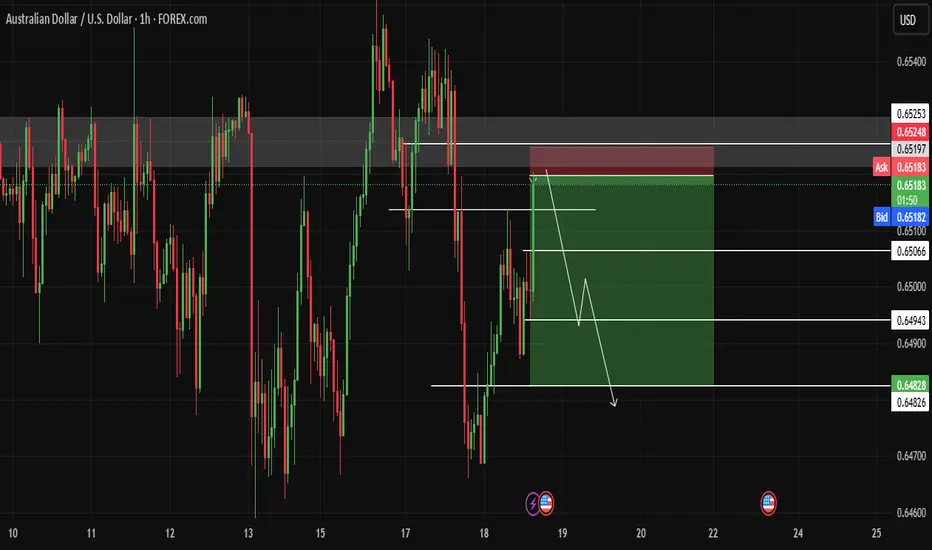
AUD/USD Descending Triangle Setup – Support Retest in FocusThe AUD/USD pair is currently forming a descending triangle pattern, a common bearish continuation structure where price makes lower highs while holding above a horizontal or slightly rising support level. This setup indicates increasing selling pressure at lower resistance levels (highlighted with red arrows and trendlines), while buyers are consistently defending the green support zone around 0.6475–0.6485.
So far, the price has been rejected multiple times from the descending resistance line, confirming seller dominance. At the same time, it has found buying interest at support, forming a tight range where a breakout or breakdown is likely to occur soon.
🔽 Current Price Action & Outlook
The latest price structure shows a potential lower high forming, suggesting another move downward toward support.
If the pair revisits the support zone once again, it will be a critical retest, and the market could either:
Bounce from support, continuing the sideways structure within the triangle, or
Break down below the green trendline, triggering a bearish continuation.
Until the support breaks, the market remains range-bound inside the triangle, offering short-term trade setups between support and resistance.
🎯 Strategy Notes
Short-Term Idea: Sell near resistance (~0.6525–0.6535), buy near support (~0.6475–0.6485)
Breakout Traders: Wait for a confirmed breakout of either boundary with volume before entering
Invalidation: A strong breakout above the red descending trendline may invalidate the bearish structure
This is a neutral-to-bearish setup with a potential for breakout in either direction. Patience is key for waiting on confirmation.
=================================================================
Disclosure: I am part of Trade Nation's Influencer program and receive a monthly fee for using their TradingView charts in my analysis.
=================================================================

buying the USDBase on the momentum change yesterday on USD.
While AUD has been resisting the high for some days

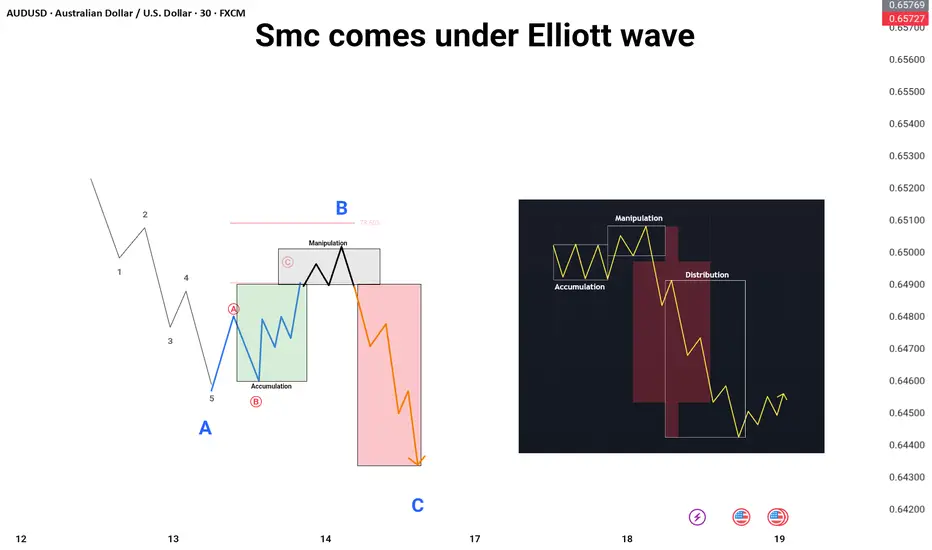
a comparison or integration of two trading concepts: 📉📈
The image presentsElliott Wave Theory and Smart Money Concepts (SMC), often associated with Wyckoff distribution/accumulation.
🌟 On the left side, there's an illustration of Elliott Wave Theory, showing a typical 5-wave impulse (labeled 1-2-3-4-5, presumably wave A) followed by a 3-wave corrective structure (labeled A-B-C). Within this, there's a smaller "Accumulation" phase depicted.
✅ On the right side, there's a diagram illustrating Smart Money Concepts/Wyckoff phases, specifically "Accumulation," "Manipulation," and "Distribution." This diagram shows how price moves through these phases, often with a false breakout (manipulation) before the true move.
🟢The overall implication of the image and its central text is that SMC principles, such as accumulation and distribution, can be observed or understood within the larger framework of Elliott Wave patterns. It suggests that SMC provides a more granular view of market behavior (identifying smart money footprints) that aligns with or unfolds within the Elliott Wave structures.
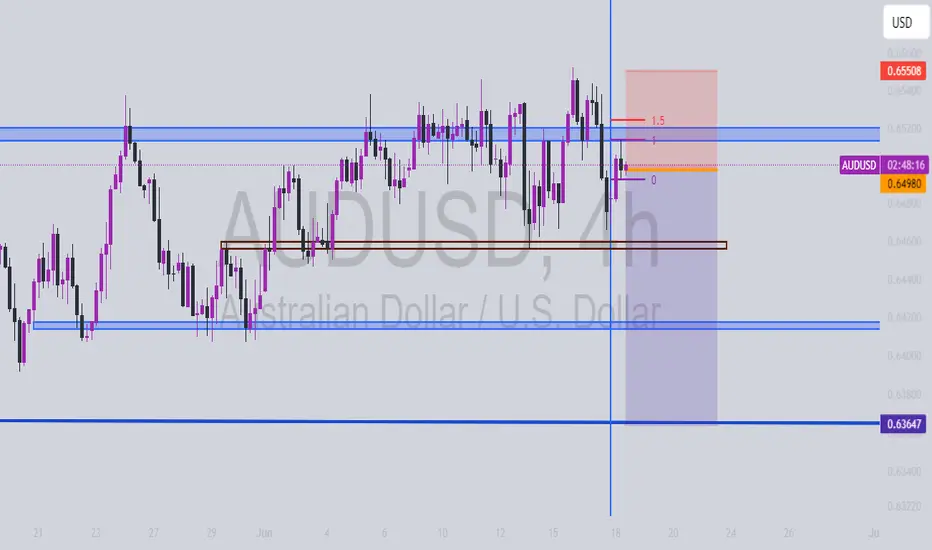
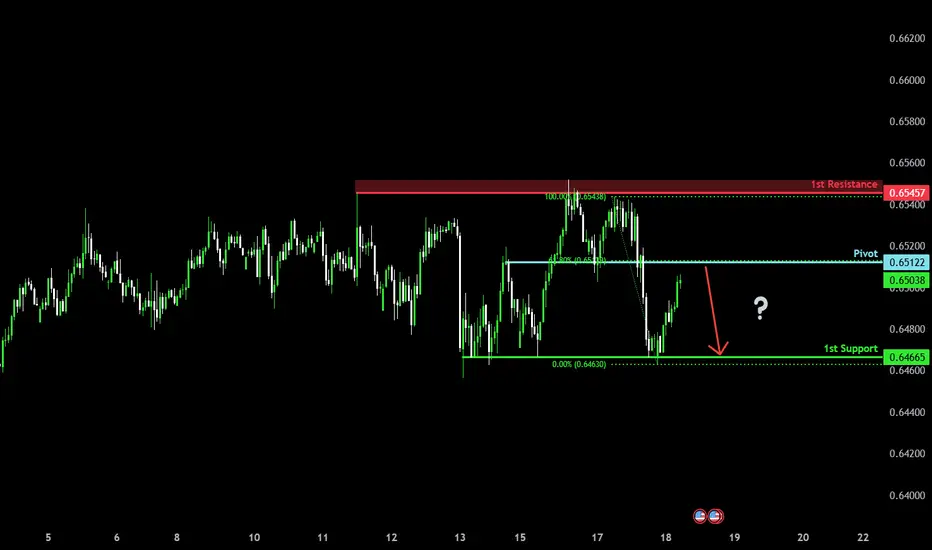
Major resistance ahead?The Aussie (AUD/USD) is rising towards the pivot which has been identified as an overlap resistance and could reverse to the 1st support.
Pivot: 0.6512
1st Support: 0.6466
1st Resistance: 0.6545
Risk Warning:
Trading Forex and CFDs carries a high level of risk to your capital and you should only trade with money you can afford to lose. Trading Forex and CFDs may not be suitable for all investors, so please ensure that you fully understand the risks involved and seek independent advice if necessary.
Disclaimer:
The above opinions given constitute general market commentary, and do not constitute the opinion or advice of IC Markets or any form of personal or investment advice.
Any opinions, news, research, analyses, prices, other information, or links to third-party sites contained on this website are provided on an "as-is" basis, are intended only to be informative, is not an advice nor a recommendation, nor research, or a record of our trading prices, or an offer of, or solicitation for a transaction in any financial instrument and thus should not be treated as such. The information provided does not involve any specific investment objectives, financial situation and needs of any specific person who may receive it. Please be aware, that past performance is not a reliable indicator of future performance and/or results. Past Performance or Forward-looking scenarios based upon the reasonable beliefs of the third-party provider are not a guarantee of future performance. Actual results may differ materially from those anticipated in forward-looking or past performance statements. IC Markets makes no representation or warranty and assumes no liability as to the accuracy or completeness of the information provided, nor any loss arising from any investment based on a recommendation, forecast or any information supplied by any third-party.
Audusd setup Here's a bullish analysis on AUD/USD (generic and adaptable to most timeframes; if you want it based on a specific chart or timeframe, let me know):
---
📈 AUD/USD Bullish Analysis
1. Support Zone Holding Strong:
AUD/USD has established a firm support level around where price has bounced multiple times.
Recent price action shows a double bottom or rounded base formation, indicating demand buildup.
2. Bullish Trendline Formation:
A new higher low structure is forming, suggesting a shift in momentum.
Price is respecting a short-term ascending trendline, signaling continued buying interest.
3. Breakout Confirmation:
A bullish breakout above the 0.6650 resistance opens room for an upward move.
Next target levels: 0.6700 and 0.6780.
4. RSI & Momentum Indicators:
RSI trending above 50, showing strength.
Bullish divergence on momentum indicators confirms possible upside continuation.
5. Fundamentals (Optional Context):
AUD supported by improving risk sentiment and commodity strength (especially iron ore and gold).
USD weakening slightly due to lower rate hike expectations from the Fed.
---
🎯 Bullish Targets:
Entry zone: 0.6620–0.6640
Target 1: 0.6700
Target 2: 0.6780
Stop-loss: Below support
AUDUSD InsightHello, everyone!
Please share your personal opinions in the comments. Please boost and subscribe!
Key Points
- U.S. President Trump warned Iran, "I hope you don't fire missiles at civilians or U.S. troops. Our patience is wearing thin," adding, "Surrender unconditionally."
- CNN reported that U.S. President Trump could use military force to strike Iranian nuclear facilities.
- U.S. retail sales in May, announced by the U.S. Department of Commerce, decreased by 0.9% compared to the previous month, significantly lower than market expectations, raising concerns about an economic slowdown.
Major Economic Schedule This Week
+ June 18: UK May Consumer Price Index, Eurozone May Consumer Price Index, FOMC Meeting Results Announcement
+ June 19: BOE Interest Rate Decision
AUDUSD Chart Analysis
After a V-shaped rebound in April, it has shown a gentle rise and is currently trading around the 0.65000 line. It has formed support lines below, and is expected to continue its upward trend based on these support levels. Long-term, it is expected to form a peak around the 0.69000 line. However, a small resistance is forming at the 0.67000 line, so we should keep open the possibility of a temporary pullback due to this resistance in that area.
Alternatively, if it breaks below the 0.64000 line, the direction could change, in which case we will establish a new strategy.
AUD/USD- Bullish moveThe AUD/USD recently broke below a key swing low, tapping into the liquidity in that area, and has since shown a clear rejection from that level. The next likely target is the swing high, where significant liquidity resides. Overall, it's a solid setup with a 15-pip stop loss.
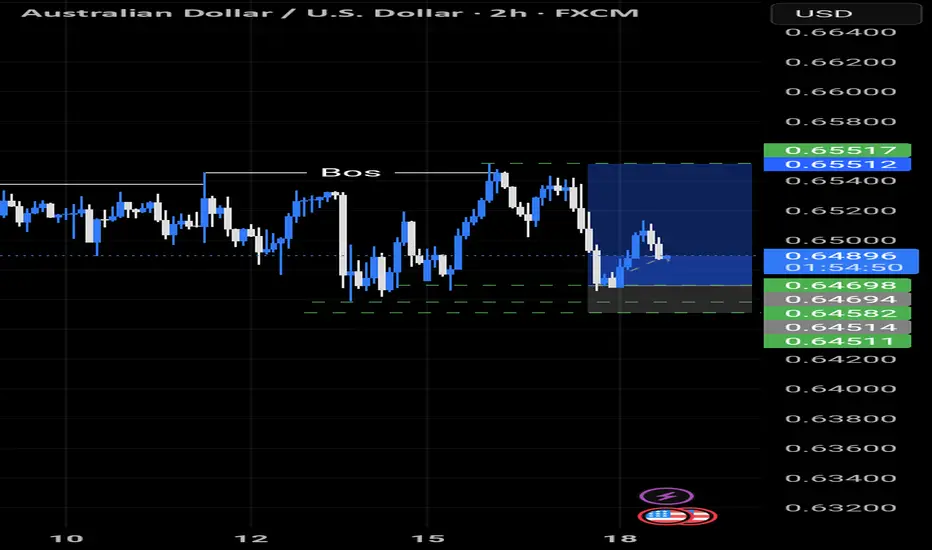
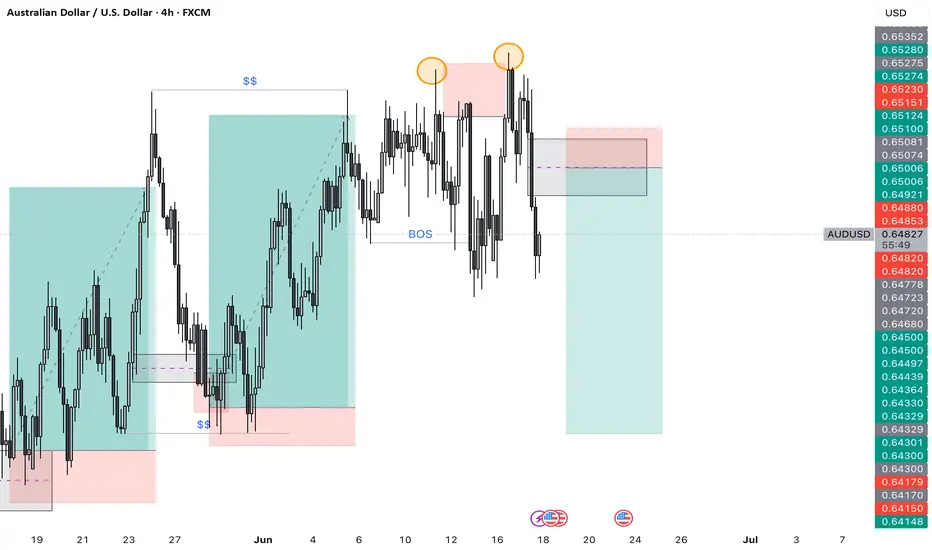
AUD/USD SELL SCENERIOThis chart illustrates a potential bearish trade setup based on Smart Money Concepts (SMC). The setup begins with the formation of equal highs, which are typically seen as liquidity pools by institutional traders. These highs are swept, as shown by the wicks that briefly break above them (highlighted with orange circles), signaling a liquidity grab intended to trigger retail buy stops. Following this liquidity sweep, price reverses and breaks a significant structure low, marked as the Break of Structure (BOS), confirming a shift from bullish to bearish order flow. This BOS acts as a key signal that the market is likely to move downward. This creates a favorable risk-to-reward ratio. Overall, this setup reflects a textbook SMC trade structure that leverages liquidity manipulation, structural shifts, and refined entry zones for a high-probability short position from fvg.
AUDUSD(20250617)Today's AnalysisMarket news:
Revised version of the Republican tax cut bill in the US Senate: It is planned to raise the debt ceiling to 5 trillion, and the overall framework is consistent with the House version.
Technical analysis:
Today's buying and selling boundaries:
0.6512
Support and resistance levels:
0.6597
0.6566
0.6545
0.6480
0.6459
0.6428
Trading strategy:
If the price breaks through 0.6545, consider buying, and the first target price is 0.6566
If the price breaks through 0.6512, consider selling, and the first target price is 0.6480
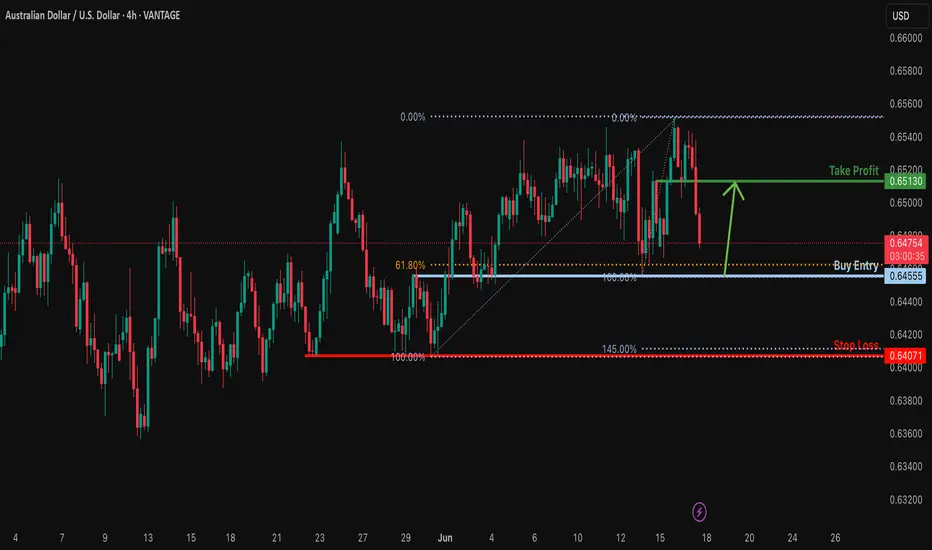
Could the Aussie bounce from here?The price is falling towards the support level which is an overlap support that is slightly below the 61.8% Fibonacci retracement and could reverse from this level to our take profit.
Entry: 0.6455
Why we like it:
There is an overlap support that is slightly below the 61.8% Fibonacci retracement.
Stop loss: 0.6407
Why we like it:
There is a pullback support that aligns with the 145% Fibonacci extension.
Take profit: 0.6513
Why we like it:
There is an overlap resistance.
Enjoying your TradingView experience? Review us!
Please be advised that the information presented on TradingView is provided to Vantage (‘Vantage Global Limited’, ‘we’) by a third-party provider (‘Everest Fortune Group’). Please be reminded that you are solely responsible for the trading decisions on your account. There is a very high degree of risk involved in trading. Any information and/or content is intended entirely for research, educational and informational purposes only and does not constitute investment or consultation advice or investment strategy. The information is not tailored to the investment needs of any specific person and therefore does not involve a consideration of any of the investment objectives, financial situation or needs of any viewer that may receive it. Kindly also note that past performance is not a reliable indicator of future results. Actual results may differ materially from those anticipated in forward-looking or past performance statements. We assume no liability as to the accuracy or completeness of any of the information and/or content provided herein and the Company cannot be held responsible for any omission, mistake nor for any loss or damage including without limitation to any loss of profit which may arise from reliance on any information supplied by Everest Fortune Group.
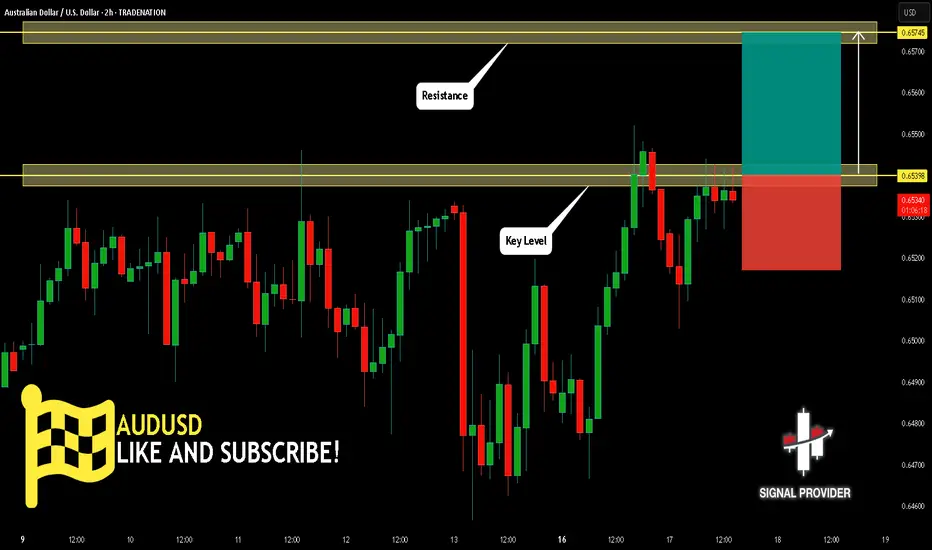
AUDUSD Will Go Up From Support! Long!
Please, check our technical outlook for AUDUSD.
Time Frame: 2h
Current Trend: Bullish
Sentiment: Oversold (based on 7-period RSI)
Forecast: Bullish
The market is approaching a key horizontal level 0.653.
Considering the today's price action, probabilities will be high to see a movement to 0.657.
P.S
Please, note that an oversold/overbought condition can last for a long time, and therefore being oversold/overbought doesn't mean a price rally will come soon, or at all.
Disclosure: I am part of Trade Nation's Influencer program and receive a monthly fee for using their TradingView charts in my analysis.
Like and subscribe and comment my ideas if you enjoy them!
SELL AUDUSDAUDUSD price displays a double top pattern sitting at the resistance. Price should decline from here towards the neckline 0,6512. Let us see
Sell Limit Setup above 2025 High📉 AUD/USD – 2H Chart Analysis
🕒 Published: June 16, 2025 | TF: 2H
🔔 Trade Idea: 2x Sell Limit at Key Resistance Zone
🔹 Market Context:
Price is trading within a rising broadening wedge pattern (marked by the white and blue trendlines).
Current rally retraced aggressively toward upper wedge resistance (2025 High), an area that has repeatedly capped bullish momentum.
Price approaching previous supply zone.
🔻 Sell Limit Setup 1
Entry: 0.65400
SL: 0.6584
TP: 0.6503
R:R ≈ 1
➕ Fades rally into resistance
➕ Aligns with EMA structure and intraday exhaustion
🔻 Sell Limit Setup 2
Entry: 0.6550
SL: 0.6584
TP: 0.6499
R:R ≈ 2
➕ Higher entry into wick zone (liquidity trap)
➕ Potential false breakout above structure
➕ SL above key swing high = cleaner invalidation
⚠️ Aggressive short: smaller SL, better RR

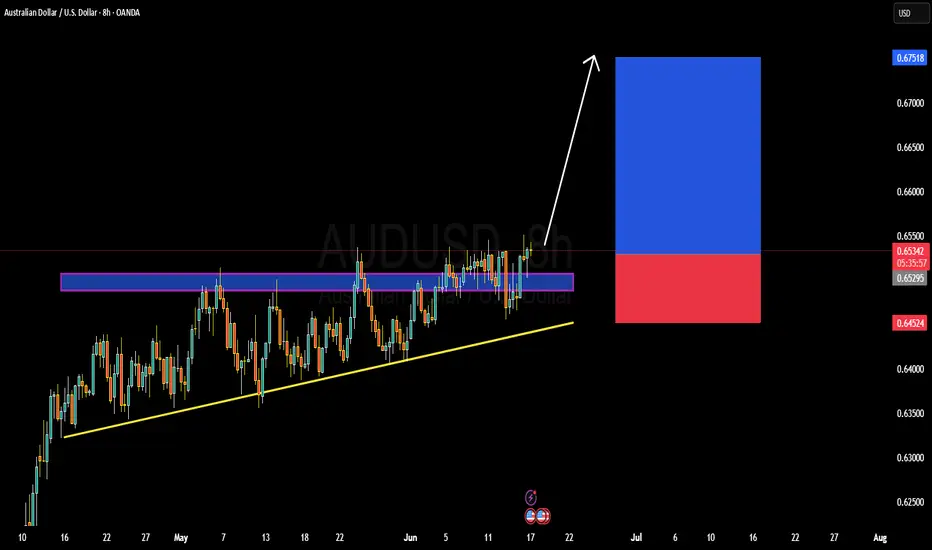
AUDUSD TECHNICALS AND FUNDAMENTALS DETAILED ANALYSISAUDUSD has officially broken out of a multi-week ascending triangle structure, and momentum is now building for a bullish continuation. The price is currently trading around 0.6533 after a strong breakout above the 0.6520 resistance zone. This consolidation was forming higher lows, signaling accumulation and bullish intent. The clean breakout above the horizontal resistance confirms buyers are in control. With this pattern validated, my short-term target is 0.6700–0.6750, aligning with the measured move projection.
From a macro perspective, AUD is gaining strength due to a divergence in monetary policy outlooks. The Reserve Bank of Australia remains hawkish, supported by sticky inflation data and a tight labor market, while the Federal Reserve has recently hinted at a dovish turn, acknowledging signs of economic slowdown. Additionally, a weaker U.S. dollar index (DXY) and rising commodity prices—especially iron ore and copper—are tailwinds for the Australian dollar. These fundamental shifts are reinforcing the bullish technical breakout.
On the 8H chart, the ascending triangle is a clear signal of bullish pressure. The zone around 0.6450–0.6520 acted as strong demand during the consolidation phase. A successful breakout retest of this zone could offer secondary entry opportunities. The risk-reward ratio is attractive, with a defined invalidation below the trendline and a target extending toward yearly highs near 0.6750.
This setup stands out as high-probability. With bullish price action, supportive fundamentals, and risk-on sentiment returning across FX majors, AUDUSD is primed for further upside. I’m holding long with conviction, expecting continuation toward the projected breakout target. This trade aligns with current market structure, trend strength, and macro drivers—perfect timing in a trending market environment.
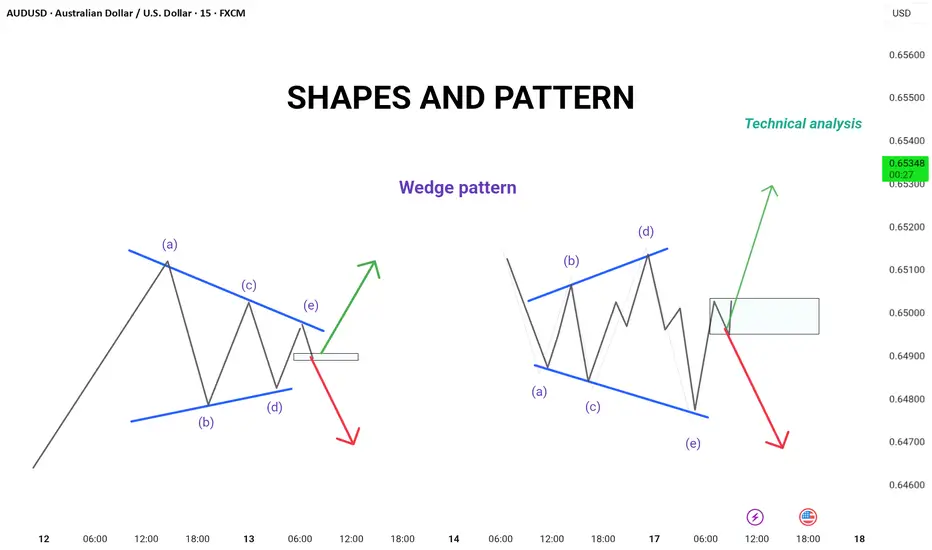
Wedge Pattern – Simple Explanation
📚 Wedge Pattern – Simple Explanation
A wedge pattern is a shape on the chart that looks like a triangle or cone. It tells us that the price is getting ready to break out — either up or down.
---
🔻 Falling Wedge (Bullish)
Looks like price is going down, but slowly.
Lines move closer together.
Usually means the price will go up soon.
It's a bullish signal (good for buying).
---
🔺 Rising Wedge (Bearish)
Price goes up, but losing strength.
Lines get closer together.
Usually means the price will go down soon.
It's a bearish signal (good for selling).
---
💡 Easy Tips:
Wait for breakout (big move out of the wedge).
Use a stop-loss below/above the pattern.
Target = height of the wedge.
---
📌 In Short:
Wedge = Squeeze pattern.
Falling wedge = Buy chance.
Rising wedge = Sell chance.
---
Let me know if you have sny doubt in comments
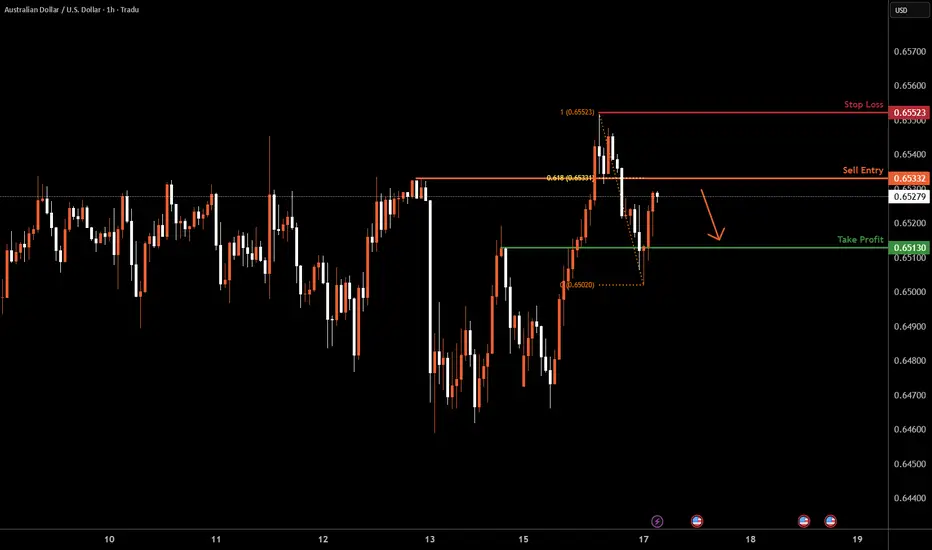
AUDUSD H1 I Bearish Reversal Based on the H1 chart analysis, we can see that the price is trading near our sell entry at 0.6533, which is a pullback resistance aligning with a 61.8% Fib retracement.
Our take profit will be at 0.6513, an overlap support.
The stop loss will be placed at 0.6552, a swing high resistance.
High Risk Investment Warning
Trading Forex/CFDs on margin carries a high level of risk and may not be suitable for all investors. Leverage can work against you.
Stratos Markets Limited (tradu.com ):
CFDs are complex instruments and come with a high risk of losing money rapidly due to leverage. 63% of retail investor accounts lose money when trading CFDs with this provider. You should consider whether you understand how CFDs work and whether you can afford to take the high risk of losing your money.
Stratos Europe Ltd (tradu.com ):
CFDs are complex instruments and come with a high risk of losing money rapidly due to leverage. 63% of retail investor accounts lose money when trading CFDs with this provider. You should consider whether you understand how CFDs work and whether you can afford to take the high risk of losing your money.
Stratos Global LLC (tradu.com ):
Losses can exceed deposits.
Please be advised that the information presented on TradingView is provided to Tradu (‘Company’, ‘we’) by a third-party provider (‘TFA Global Pte Ltd’). Please be reminded that you are solely responsible for the trading decisions on your account. There is a very high degree of risk involved in trading. Any information and/or content is intended entirely for research, educational and informational purposes only and does not constitute investment or consultation advice or investment strategy. The information is not tailored to the investment needs of any specific person and therefore does not involve a consideration of any of the investment objectives, financial situation or needs of any viewer that may receive it. Kindly also note that past performance is not a reliable indicator of future results. Actual results may differ materially from those anticipated in forward-looking or past performance statements. We assume no liability as to the accuracy or completeness of any of the information and/or content provided herein and the Company cannot be held responsible for any omission, mistake nor for any loss or damage including without limitation to any loss of profit which may arise from reliance on any information supplied by TFA Global Pte Ltd.
The speaker(s) is neither an employee, agent nor representative of Tradu and is therefore acting independently. The opinions given are their own, constitute general market commentary, and do not constitute the opinion or advice of Tradu or any form of personal or investment advice. Tradu neither endorses nor guarantees offerings of third-party speakers, nor is Tradu responsible for the content, veracity or opinions of third-party speakers, presenters or participants.
AUDUSD IDEAWe've gotten a new higher high/break of structure to the upside.
Waiting for a pullback to our Fibonacci level for a continuation to the upside
