Australian dollar down, eyes US GDP, Australian CPIThe Australian dollar is down for a third straight trading day. In the North American session, the US dollar has posted gains against most of the major currencies, including the Aussie. The greenback received a boost after the US and the EU reached a framework trade agreement after protracted negotiations.
The data calendar is bare on Monday, with no events out of the US or Australia. Things get very busy on Wednesday, with Australian inflation, US GDP and the Federal Reserve rate decision.
Even with no US releases, the US dollar has posted gains against most of the major currencies, including the Aussie. The greenback received a boost after the US and the EU reached a framework trade agreement after protracted negotiations.
President Trump had threatened to impose 30% tariffs on European goods if a deal was not reached by Aug. 1. With the deal, a nasty trade war between the world's two largest economies has been avoided and the US will tariff most EU products at 15%.
The deal with the EU comes on the heels of a similar agreement with Japan, bringing a sigh of relief from the financial markets that have been worried about the economic fallout from Trump's tariff policy. The agreements remove a great deal of uncertainty and investors are hopeful that the US and Chinese negotiators will wrap up their talks with an agreement in hand.
The Federal Reserve meets on Wednesday and is virtually certain to maintain interest rates for a fifth straight meeting. It will be interesting to see if President Trump, who has been sharply critical of Fed policy, reacts to the decision. The money markets are expecting at least one cut before the end of the year, with the money markets pricing in a 61% likelihood a cut in September, according to FedWatch's CME.
USDAUD trade ideas

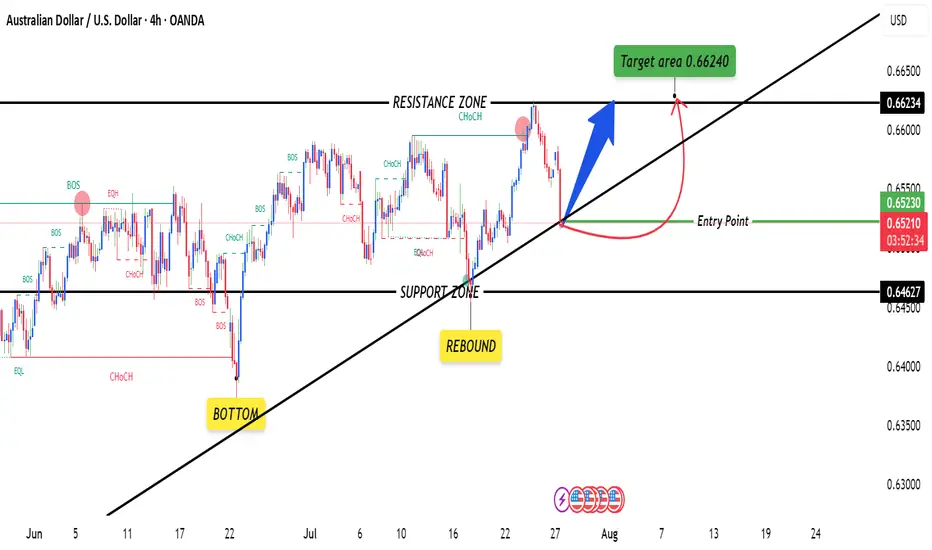
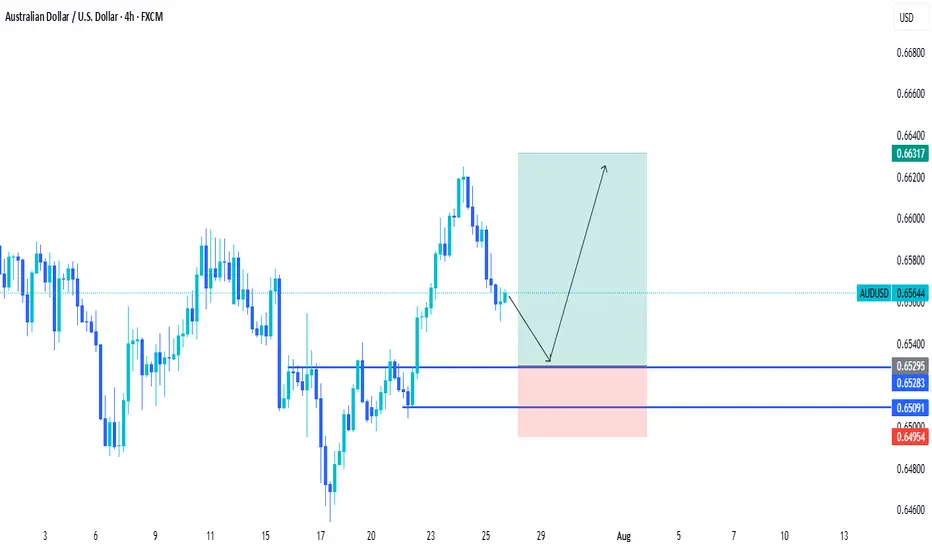
AUDUSD 4HOUR TIME FRAME ANALYSISOn the 4-hour chart, AUD USD has recently shifted into a shallow up-trend after carving out a higher low around 0.6480. From that support zone, price has rallied through a short-term descending channel, breaking its upper trendline just above 0.6500 and holding that breakout on the last two candles. The entry at 0.65231 sits just above a cluster of prior resistance–turned–support (0.6500–0.6520), giving the trade a solid foothold.
Momentum indicators confirm the bullish tilt: the 14-period RSI is riding around 60–65, neither overbought nor fatigued, suggesting room to run toward your target. Likewise, price is comfortably above both its 50-period and 200-period EMAs, with the shorter EMA crossing above the longer one roughly 12 bars ago, signalling that buyers are in control.
AUDUSD 4Hour TF - July 27th, 2025AUDUSD 7/27/2025
AUDUSD 4hour Bullish idea
Monthly - Bearish
Weekly - Bearish
Dailly - Bullish
4hour - Bullish
AUDUSD is holding steady in this weekly channel but has been showing signs of high volume ranging over the last month. Going into this week we’re looking mostly bullish but we have some minor zones that could slow price action down.
Here are two scenarios we are looking out for, for the week ahead:
Bullish Continuation - This is our ideal scenario as we want the trend to continue so we can have the best quality trade. For us to get comfortable going long AU we need to see structure above our 0.65800 zone. We want to see price action use this zone as support and establish structure (the next higher low).
If this happens we can look to target higher toward major resistance levels and key fib levels.
Bearish Reversal into range - If we fail to see bullish conviction at the current zone it’s possible price action will fall back into the range. This is a likely scenario as we have seen price action bounce between 0.65800 and 0.65000 multiple times over the last month.
I wouldn’t recommend trading this scenario as I don’t like trading ranges but we could see price action head lower to 0.65000.

AUDUSD TRADE SETUPWait for retest the entry level and Bullish momentum candle then take a trade for Buy otherwise skip this setup
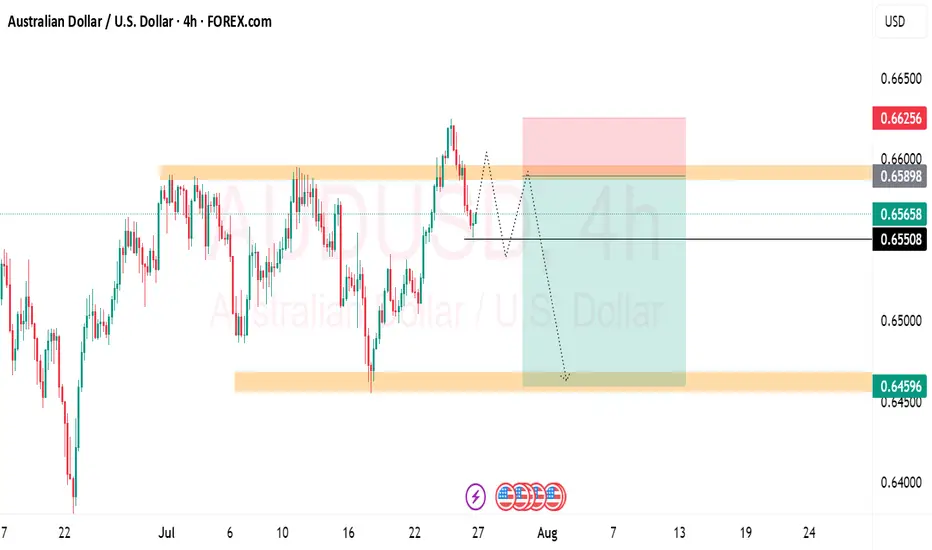
AUDUSD looks promising for a continuationThis pair presents a potential trade opportunity in the form of a short continuation. The price did reach a significant Area of Interest (AoI) in form of an expanding 3-touch structure before turning around. Price did close outside the structure on the H4 with a candlestick reversal pattern and printed a bearish high-test candle on the daily timeframe. This clearly shows a shift in momentum and I am now waiting for a lower time frame (LTF) continuation pattern to confirm the direction and a valid candlestick pattern for entry.
📈 Simplified Trading Rules:
> Follow a Valid Sequence
> Wait for Continuation
> Confirm Entry (valid candlestick pattern)
> Know When to Exit (SL placement)
Remember, technical analysis is subjective; develop your own approach. I use this format primarily to hold myself accountable and to share my personal market views.
⚠ Ensure you have your own risk management in place and always stick to your trading plan.
AUDUSD Still early days
20% in me:
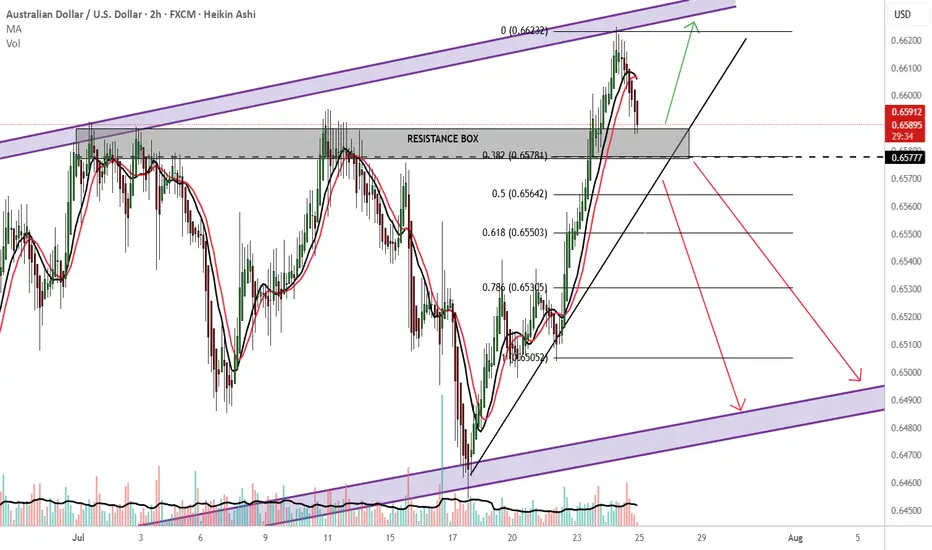
Unless strong bullish fundamentals present themselves or the big boys with the big bucks drive a bullish push anywhere from 0.65784 or resistance, I would be looking to sell.
Buy outside the resistance box
TP:0.66600 new immediate high?
Please also consider price action as there are 2 previous rejections in the 0.65784 price area.
80% in me:
-Australia is heavily tied to China via exports
RBA rate cuts?
Falling iron ore prices...
-Perfect price action channel trade. SELL at resistance BUY at support. Bullish long term, bearish short term.
-fib 0.382 downward continuation and close below 0.65784
-Looking for a break below the upward sloping trendline HARD sell
-safer option: wait for a 0.65780 retest, below the upward sloping trendline sells and make bank.
TP: 0.6500
THOUGHTS?
AUD/USD Bulls Eye BreakoutThe Australian Dollar surged more than 1.8% this week with AUD/USD now testing multi-month uptrend resistance at fresh yearly highs. A four-day rally takes price into confluent resistance at the September low / upper parallel at 6622- The focus is on today’s close with the immediate advance vulnerable while below this key slope. Subsequent resistance objectives eyed at the 2019 low at 6671 and the 78.6% retracement of the broader 2024 decline at 6723.
Initial support rests with the July open at 6581 and is backed by the May high-day close (HDC) / weekly open at 6486-6506. Losses would need to be limited to this region for the late-June advance to remain viable (near-term bullish invalidation). Subsequent support seen at the June low-day close (LDC) at 6458 with a break below 6350 ultimately needed to suggest a more significant high is in place / larger reversal is underway.
Bottom line: A breakout of the July opening-range takes AUD/USD into confluent uptrend resistance- risk for topside exhaustion / price inflection here. From a trading standpoint, a good zone to reduce portions of long-exposure / raise protective stops – losses shudl be limited to 6486 IF price is heading higher on this stretch with a close above this slope needed to fuel the next leg of the advance.
Keep in mind the FOMC interest rate decision is on tap next week with Core Personal Consumption Expenditures (PCE) and Non-Farm Payrolls (NFPs) slated into the monthly cross. Stay nimble into the releases and watch the weekly closes here.
-MB

Check the trend A triangle pattern is expected to form within the current support range. Then the start of an uptrend is likely. If the price breaks through the 78.6% level, a continuation of the correction and downtrend is possible.
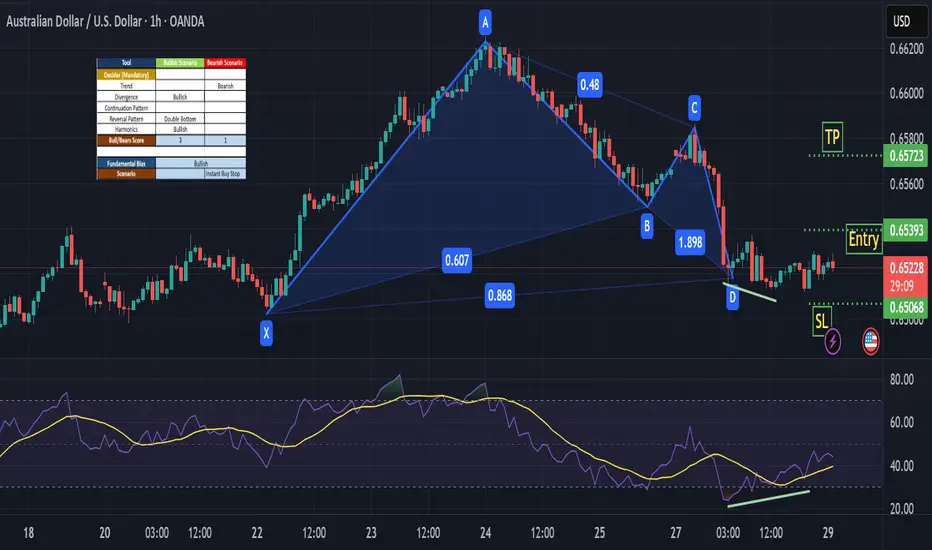
AUDUSD - BullishAUDUSD is Bullish on Fundamental Bias and Seasonal aslo support long position. Divergence can also be observed on RSI. Forming an Harmonic pattern so it looks like buyers are in a strong position
AUDUSD.JULY 29TH
Bureau of Labor Statistics will publish will JOLTS which measures the Number of job openings during the reported month, excluding the farming industry;
JOLTS Job Openings CB Consumer Confidence forecast 95.9 previous 93.0 .market will watch for data report for clear directional bias .
wednesday 30th
Australian Bureau of Statistics will publish the Consumer price index which Measures Change in the price of goods and services purchased by consumers
'Actual' greater than 'Forecast or below will be watched for clear directional bias .
this data are Frequency Released quarterly, about 25 days after the quarter ends;
and the next report will be on Oct 30, 2025
Consumer prices account for a majority of overall inflation. Inflation is important to currency valuation because rising prices lead the central bank to raise interest rates out of respect for their inflation containment mandate of 2%
Aud CPI q/q forecast 0.8% previous 0.9%
AUD CPI y/y forecast 2.1% previous 2.1%
AUD Trimmed Mean CPI q/q forecast 0.7% previous 0.7%
USD 1:15pm
1:15pm USD ADP Non-Farm Employment Change forecast 82K previous -33K
Advance GDP q/q forecast 2.4% previous -0.5%
Advance GDP Price Index q/q forecst 2.3% previous 3.8%
Pending Home Sales m/m forecast 0.3% previous 1.8%
USD Crude Oil Inventories-3.2M
by 7pm USD Federal Funds Rate previous 4.50% 4.50%
FOMC Statement
7:30pm FOMC Press Conference.
watchout for federal fund rate data report and FOMC (federal open market committee)
NOTE;TRADING ANAY INSTRUMENT IS 100% PROBABILTY ,ANY KEY LEVEL CAN FAIL YOU,DONT EVER TRADE WITH ALL YOUR CAPITAL BECAUSE YOU MENTOR SAY BUY OR SELL.
TRADING IS 100% PROBABILTY AND NO STRATEGY IS PERFECT.
TRADE WITH CAUTION.
WISH A HAPPY NEW WEEK.
BYE.

AUDUSD(20250729)Today's AnalysisMarket news:
After gold prices soared to an all-time high of more than $3,500 an ounce in April, the latest report from the Commodity Futures Trading Commission (CFTC) showed that fund managers have increased their bullish bets to the highest level in 16 weeks.
Technical analysis:
Today's buy and sell boundaries:
0.6538
Support and resistance levels:
0.6610
0.6583
0.6566
0.6511
0.6493
0.6466
Trading strategy:
If the price breaks through 0.6538, consider buying, the first target price is 0.6566
If the price breaks through 0.6511, consider selling, the first target price is 0.6493

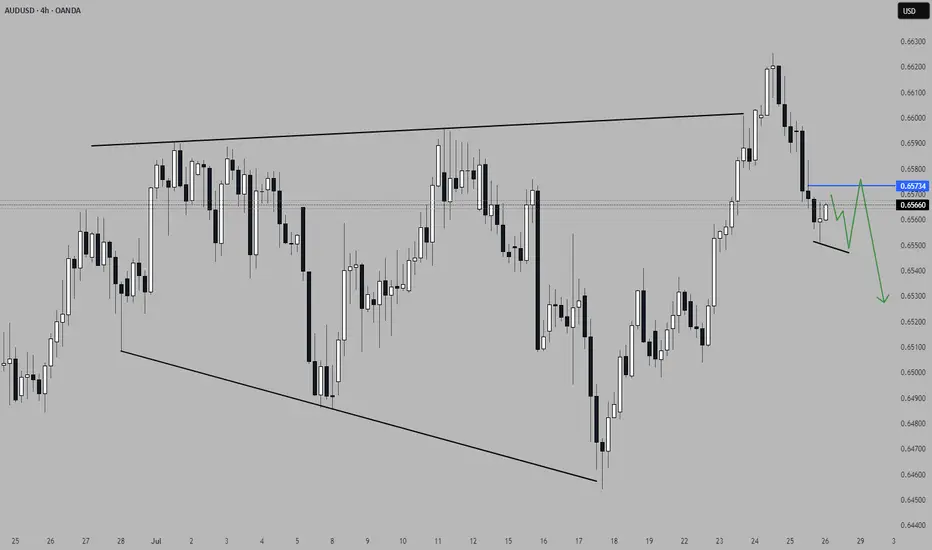
AUD/USD: Rising Wedge Breakdown Signals Bearish ShiftAUD/USD has broken down from a rising wedge formation after rejecting near the 61.8% Fibonacci retracement at 0.6558. This pattern, typically bearish, suggests the recent uptrend is losing steam — a view reinforced by Friday’s strong bearish candle closing below both the wedge support and the 50-day SMA (0.6510).
The price action now sits just above the 200-day SMA (0.6397), a level that could act as a short-term buffer. If this moving average gives way, focus shifts to the prior horizontal support at 0.6170. Meanwhile, upside attempts may find resistance at the broken wedge support and Fib zone near 0.6550.
Momentum indicators support the bearish case:
MACD is flat but biased lower, hovering near the zero line.
RSI has dipped below 50 (currently ~47.7), indicating weakening bullish momentum.
Unless AUD/USD quickly reclaims 0.6550, the path appears tilted toward further losses, potentially targeting the 0.63–0.62 zone.
Bias: Bearish breakdown with downside pressure while below 0.6550. Watch 0.6397 and 0.6170 as key support levels.
-MW

AUDUSD corrective pullback supported at 0.6486Trend Overview:
The AUDUSD currency price remains in a bullish trend, characterised by higher highs and higher lows. The recent intraday price action is forming a continuation consolidation pattern, suggesting a potential pause before a renewed move higher.
Key Technical Levels:
Support: 0.6465 (primary pivot), followed by 0.6445 and 0.6400
Resistance: 0.6570 (initial), then 0.6590 and 0.6625
Technical Outlook:
A pullback to the 0.6465 level, which aligns with the previous consolidation zone, could act as a platform for renewed buying interest. A confirmed bounce from this support may trigger a continuation toward the next resistance levels at 0.6570, 0.6590, and ultimately 0.6625.
Conversely, a daily close below 0.6465 would suggest weakening bullish momentum. This scenario would shift the bias to bearish in the short term, potentially targeting 0.6445 and 0.6400 as downside levels.
Conclusion:
AUDUSD maintains a bullish structure while trading above the 0.6465 support. A bounce from this level would validate the consolidation as a continuation pattern, with upside potential toward the 0.6570 area. A breakdown below 0.6465, however, would invalidate this view and suggest deeper corrective risk.
This communication is for informational purposes only and should not be viewed as any form of recommendation as to a particular course of action or as investment advice. It is not intended as an offer or solicitation for the purchase or sale of any financial instrument or as an official confirmation of any transaction. Opinions, estimates and assumptions expressed herein are made as of the date of this communication and are subject to change without notice. This communication has been prepared based upon information, including market prices, data and other information, believed to be reliable; however, Trade Nation does not warrant its completeness or accuracy. All market prices and market data contained in or attached to this communication are indicative and subject to change without notice.
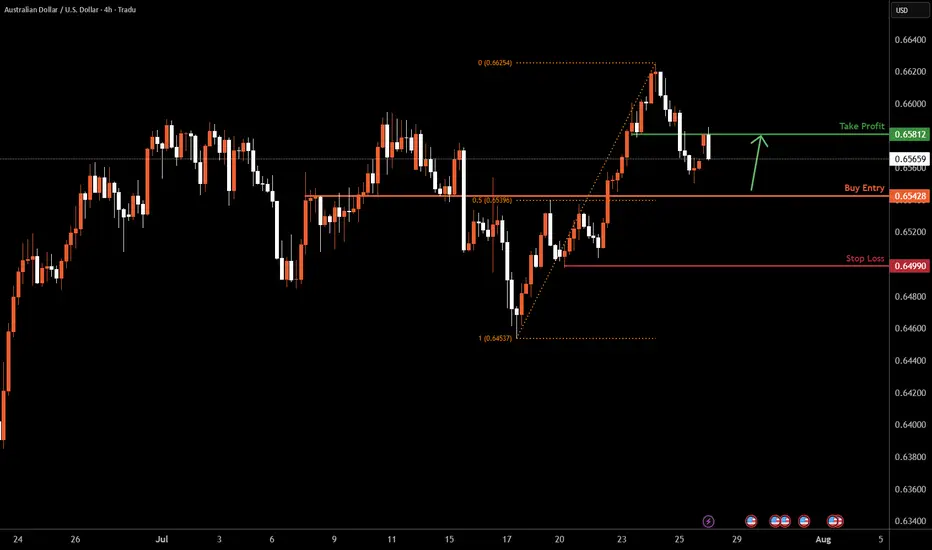
AUDUSD H4 I Bullish Bounce Off the 50% Fib Based on the H4 chart analysis, we can see that the price is falling toward our buy entry at 0.6542, which is a pullback support that aligns with the 50% Fib retracement.
Our take profit will be at 0.6581, an overlap resistance.
The stop loss will be placed at 0.6499, a swing low support.
High Risk Investment Warning
Trading Forex/CFDs on margin carries a high level of risk and may not be suitable for all investors. Leverage can work against you.
Stratos Markets Limited (tradu.com ):
CFDs are complex instruments and come with a high risk of losing money rapidly due to leverage. 66% of retail investor accounts lose money when trading CFDs with this provider. You should consider whether you understand how CFDs work and whether you can afford to take the high risk of losing your money.
Stratos Europe Ltd (tradu.com ):
CFDs are complex instruments and come with a high risk of losing money rapidly due to leverage. 66% of retail investor accounts lose money when trading CFDs with this provider. You should consider whether you understand how CFDs work and whether you can afford to take the high risk of losing your money.
Stratos Global LLC (tradu.com ):
Losses can exceed deposits.
Please be advised that the information presented on TradingView is provided to Tradu (‘Company’, ‘we’) by a third-party provider (‘TFA Global Pte Ltd’). Please be reminded that you are solely responsible for the trading decisions on your account. There is a very high degree of risk involved in trading. Any information and/or content is intended entirely for research, educational and informational purposes only and does not constitute investment or consultation advice or investment strategy. The information is not tailored to the investment needs of any specific person and therefore does not involve a consideration of any of the investment objectives, financial situation or needs of any viewer that may receive it. Kindly also note that past performance is not a reliable indicator of future results. Actual results may differ materially from those anticipated in forward-looking or past performance statements. We assume no liability as to the accuracy or completeness of any of the information and/or content provided herein and the Company cannot be held responsible for any omission, mistake nor for any loss or damage including without limitation to any loss of profit which may arise from reliance on any information supplied by TFA Global Pte Ltd.
The speaker(s) is neither an employee, agent nor representative of Tradu and is therefore acting independently. The opinions given are their own, constitute general market commentary, and do not constitute the opinion or advice of Tradu or any form of personal or investment advice. Tradu neither endorses nor guarantees offerings of third-party speakers, nor is Tradu responsible for the content, veracity or opinions of third-party speakers, presenters or participants.
AUDUSD Will Go Higher From Support! Buy!
Please, check our technical outlook for AUDUSD.
Time Frame: 12h
Current Trend: Bullish
Sentiment: Oversold (based on 7-period RSI)
Forecast: Bullish
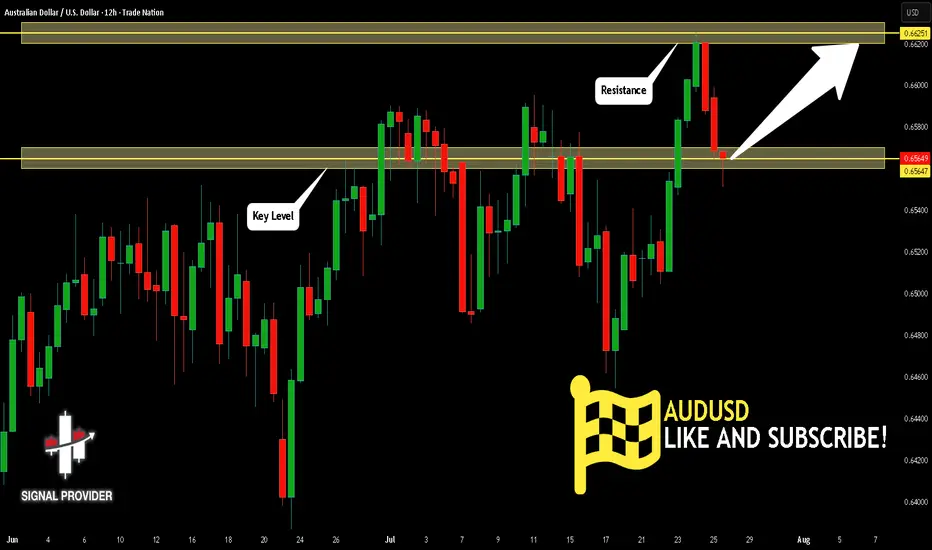
The market is trading around a solid horizontal structure 0.656.
The above observations make me that the market will inevitably achieve 0.662 level.
P.S
We determine oversold/overbought condition with RSI indicator.
When it drops below 30 - the market is considered to be oversold.
When it bounces above 70 - the market is considered to be overbought.
Disclosure: I am part of Trade Nation's Influencer program and receive a monthly fee for using their TradingView charts in my analysis.
Like and subscribe and comment my ideas if you enjoy them!
demand and supply strategymost traders will be taking an aggressive entry from the supply down to the demand zone but for me being a patient trader, i want to see a new trend, price forming a LL before considering any sell opportunity...
if it doesnt pullback for me to enter then its fine i will sit on my hands and wait for the next opportunity...
please drop a comment...
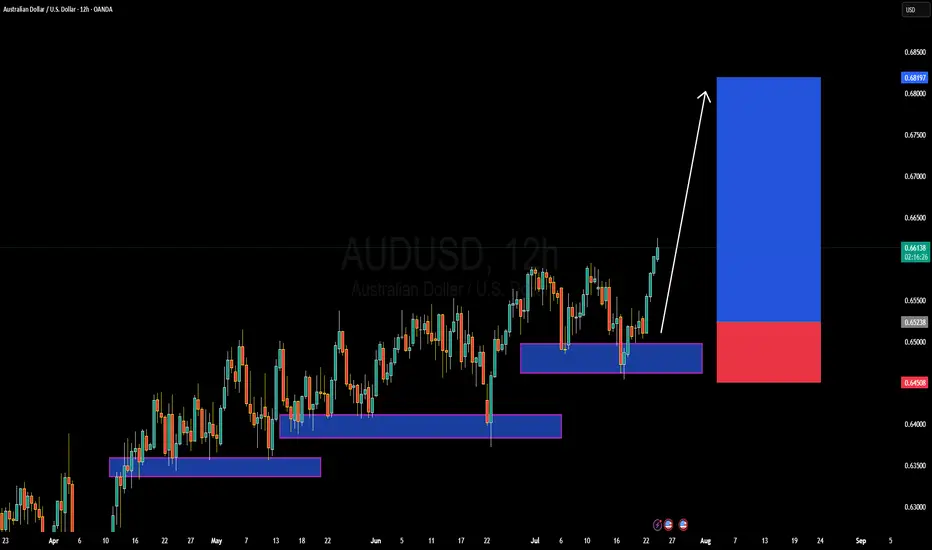
AUDUSD Forming Strong Bullish MomentumAUDUSD is currently showing strong bullish momentum, confirming a key breakout from recent consolidation. After multiple rejections at support zones, price action has now surged through previous resistance levels around 0.6600, signaling a bullish trend continuation. As seen on the 12H chart, the pair is respecting a series of higher lows and forming a clean ascending structure, with a fresh impulse wave now aiming toward the 0.6800–0.6820 target zone.
On the fundamental front, the Australian dollar is gaining strength as recent macro data supports a more optimistic economic outlook. Australia’s labor market remains tight, and inflation prints have come in hotter than expected, increasing speculation that the RBA may maintain a hawkish tone. Meanwhile, the US dollar is under pressure as markets continue to price in a potential Fed rate cut in the coming months, especially amid signs of slowing economic momentum and easing CPI. This divergence is helping AUDUSD push higher.
Technically, buyers are clearly in control. Each dip into demand zones has been aggressively bought, and the current price action confirms continuation. The recent break above 0.6600 is a significant technical development, and as long as price holds above the 0.6520–0.6500 support zone, I expect the pair to grind higher toward 0.6819 and beyond. Risk-reward remains favorable for buyers with a clear bullish structure intact.
With strong bullish confluence both fundamentally and technically, AUDUSD offers a high-probability long opportunity. I’ll be looking for continuation setups on lower timeframes while managing risk below key support. The trend is your friend here—stay with the bulls as the market positions ahead of upcoming US economic releases.
SELL AUDUSD IF DAILY CANDLE ENDS AS BEARISH ON IDC(THIS CHART)sell AUDUSD and buy USDCAD as the dollar is gaining strength

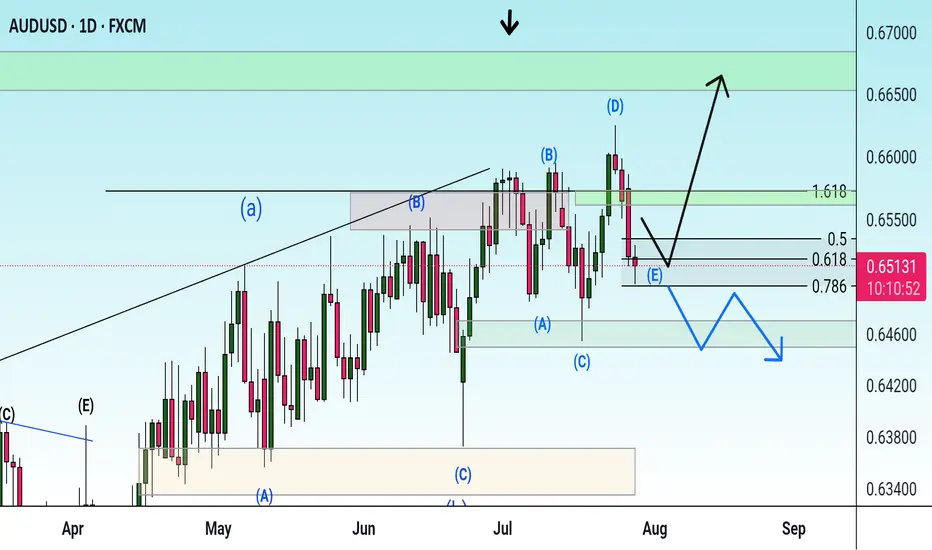
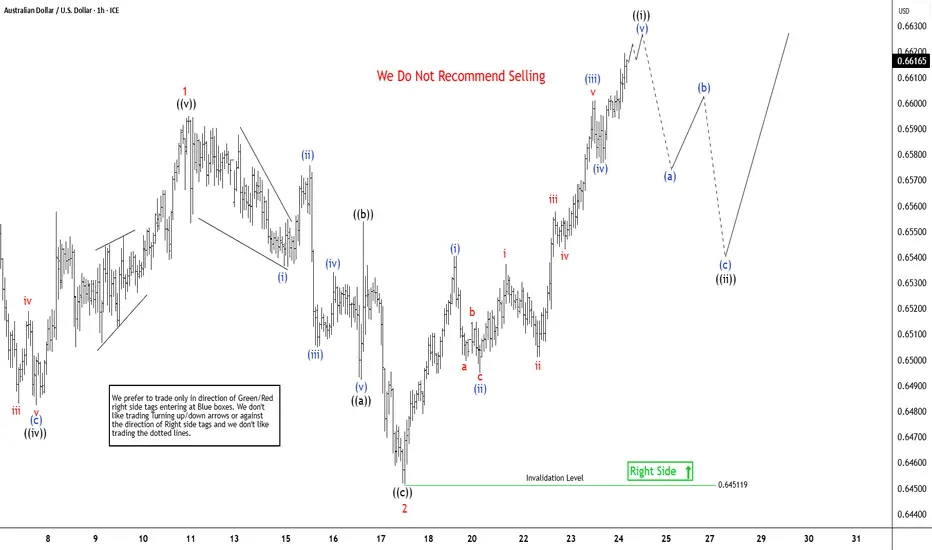
AUDUSD Elliott Wave Outlook: Impulse Pattern Approaching To EndThe AUDUSD pair is showing higher high from 4.09.2025 low, expecting rally to continue from 5.12.2025 low. It favors zigzag corrective bounce from April-2025 low & should continue rally against 0.6451 low. In daily, it started corrective bounce from 4.09.2025 low & may extend towards 0.6720 – 0.6955 area in next few weeks. Above 4.09.2025 low, it ended (A) at 0.6515 high of 5.06.2025, (B) at 0.6354 low of 5.12.2025 & favors upside in (C). Ideally, (C) can extend towards 0.6955 or higher levels, while pullback holds above 5.12.2025 low. Within (C), it placed 1 at 0.6595 high, 2 at 0.6451 low in corrective pullback & favors upside in 3. Within 1, it ended ((i)) at 0.6552 high, ((ii)) at 0.6369 low, ((iii)) at 0.6590 high, ((iv)) at 0.6451 low & ((v)) at 0.6595 high in overlapping diagonal. Below 1 high, it ended 2 in zigzag correction at extreme area before resume rally in 3.
It placed ((a)) of 2 at 0.6492 low in 5 swings, ((b)) at 0.6554 high & ((c)) at 0.6451 low in 5 swings. Wave 2 pullback ended at 0.618 Fibonacci retracement of 1. Within 3, it favors impulse in ((i)) started from 7.17.2025 low. It placed (i) of ((i)) at 0.6540 high, (ii) at 0.6495 low, (iii) at 0.6601 high, (iv) at 0.6576 low & favor upside in (v) targeting in to 0.6606 – 0.6637 area to finish it. It already reached minimum area, but can see more upside above 0.6593 low. Alternatively, the current move even can be (iii) of ((i)) followed by small pullback in (iv) & higher in (v). Later, it expects ((ii)) to correct in 3, 7 or 11 swings against 7.17.2025 low & find support from extreme area to continue rally. Wave 3 should extend in to 0.6692 – 0.6841 area in 5 swings before correcting in 4 of (C). We like to buy the pullback in 3, 7 or 11 swings at extreme area against 7.17.2025 low.
AUD/USD tests uptrend as Trump targets Powell at Fed siteThe US dollar is trading mixed after President Trump made a rare appearance at the Federal Reserve’s renovation site, in an attempt to distract from you know what.
While the visit had no formal policy announcements, Trump did try to further undermine Chair Jerome Powell by erroneously claiming the renovation cost had blown out to 3.1 billion by adding the cost of a building finished 5 years ago.
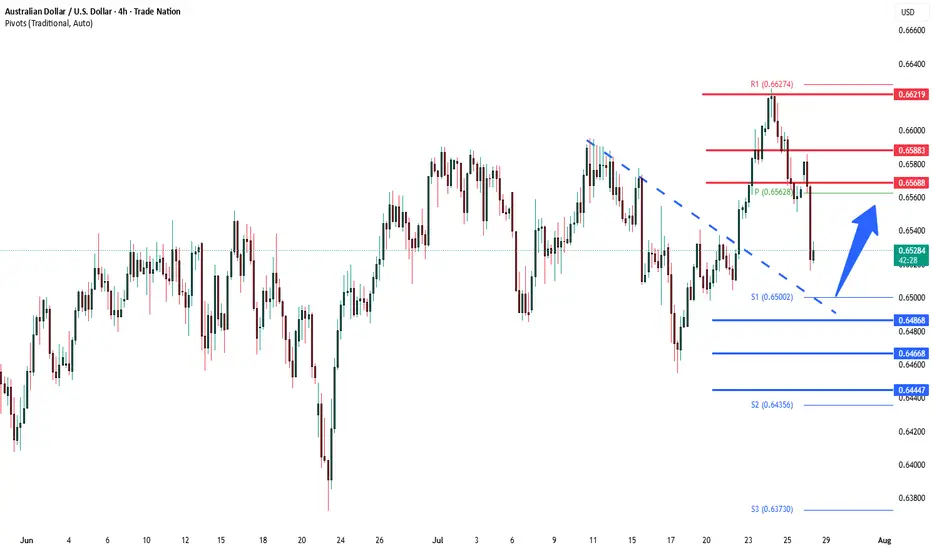
Meanwhile, AUD/USD could be of the most interest. Traders might like to watch to see if it can hold its uptrend after its downside breakout from yesterday. AUD/USD remains potentially supported above its 50-DMA, with momentum pointing to potential further upside beyond 0.6625.

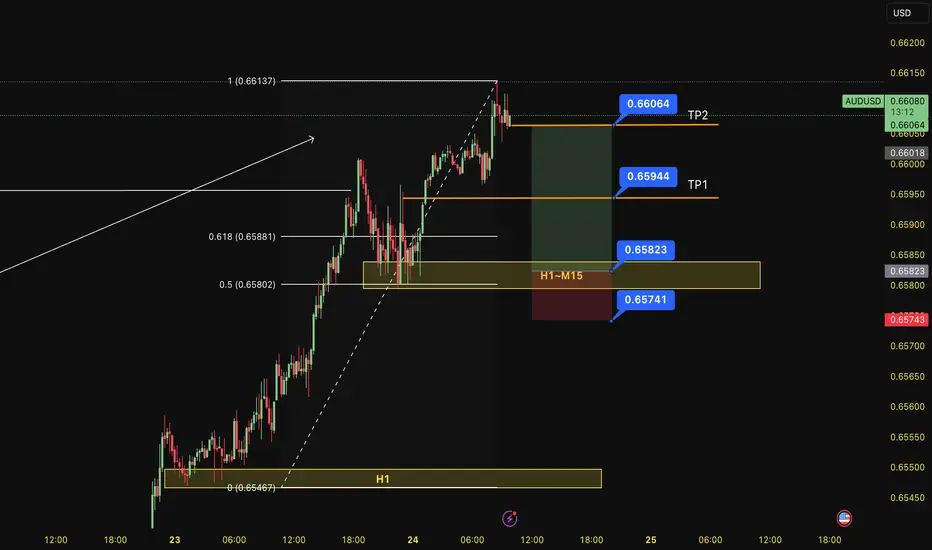
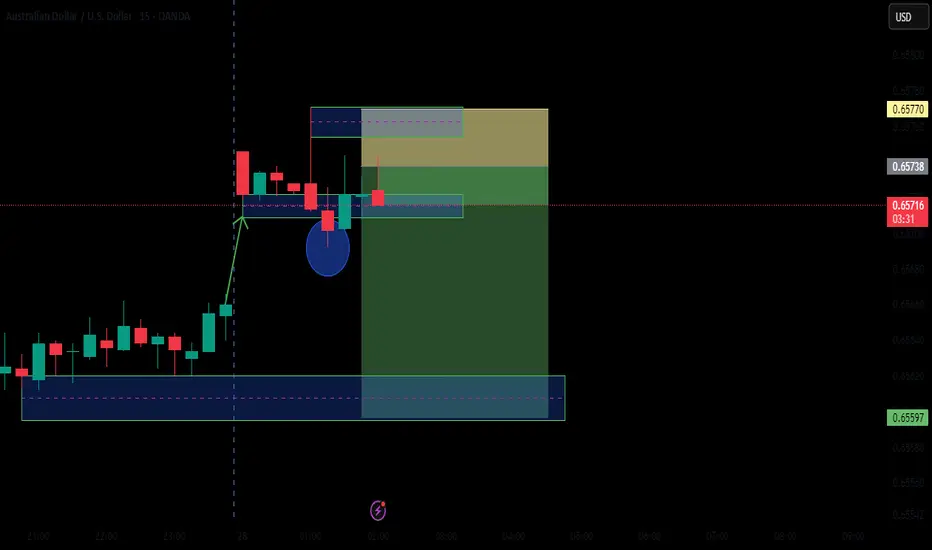
BUY AUDUSD 24.7.2025Confluence order: BUY at H1~M15
Type of order: Limit order
Reason:
- The price breakout H4 (the last top) confirming the uptrend.
- M15~FIBO 0,5-0,618 (same position)
Note:
- Management of money carefully at the price of sub key M15 (0,65944)
Set up entry:
- Entry buy at 0,65823
- SL at 0,65741
- TP1: 0,65944
- TP2: 0,66064
Trading Method: Price action (No indicator, only trend and candles)