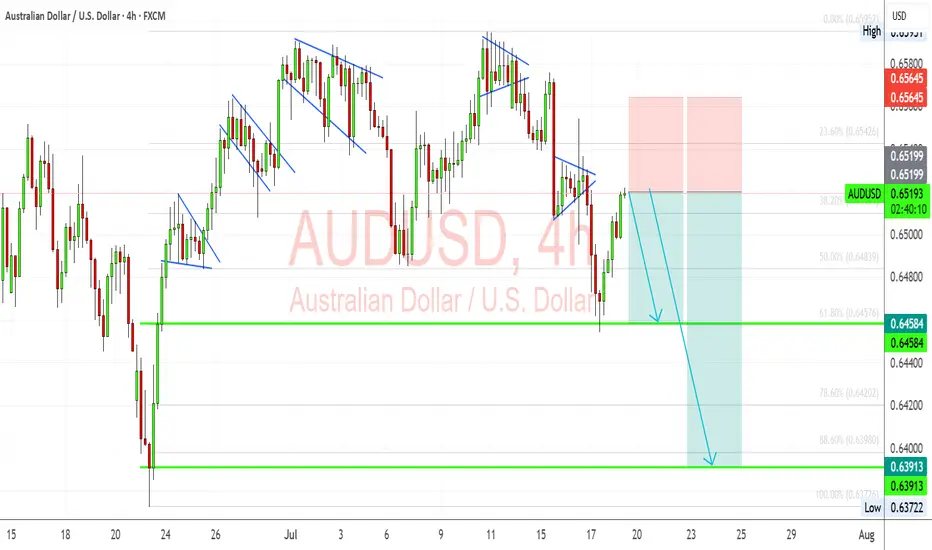
AUDUSD: Bearish Flag Retest Within Macro HeadwindsAUDUSD is developing a clean bearish technical setup just as macro fundamentals increasingly weigh on the Australian dollar. The pair recently completed a rising wedge breakout and is now retesting broken structure within a larger downtrend. With risk sentiment shaky due to U.S. tariff threats and dovish repricing of the RBA’s outlook, Aussie bulls may struggle to sustain momentum. A confirmed breakdown below 0.6458 could open the door toward June’s swing low near 0.6390.
🧠 Technical Breakdown:
✅ Bearish Flag Structure:
The chart shows a sequence of bearish flags and rising wedges, all of which have historically broken lower. The latest breakout to the downside was sharp, and the current rally appears corrective.
✅ Fib Levels & Confluence:
Price is hovering near the 38.2% retracement (0.6510) from the last leg down. The invalidation zone around 0.6565 aligns with a supply zone, making it an ideal SL area.
✅ Target Zones:
First support: 0.6458
Measured move: 0.6390 - 0.6370
These coincide with Fib 61.8% & 100%, adding technical confluence.
📉 Fundamental Drivers:
Dovish RBA Signals: Labour data missed expectations, and June inflation slowed (4.8% vs. 4.9% expected), softening the RBA’s hawkish stance.
Stronger USD Outlook: Powell’s reappointment risk and rate-cut delay pricing have supported the dollar. U.S. data (Retail Sales, CPI) still signal sticky inflation and strong labor.
Tariff Risk from Trump: With the U.S. floating global 10% tariffs, risk assets like AUD (a high-beta currency) face downside pressure.
⚠️ Risks to Bearish Bias:
Stronger-than-expected China stimulus could support AUD as a proxy.
A dovish Fed pivot or soft U.S. data might undercut USD strength.
USDAUD trade ideas
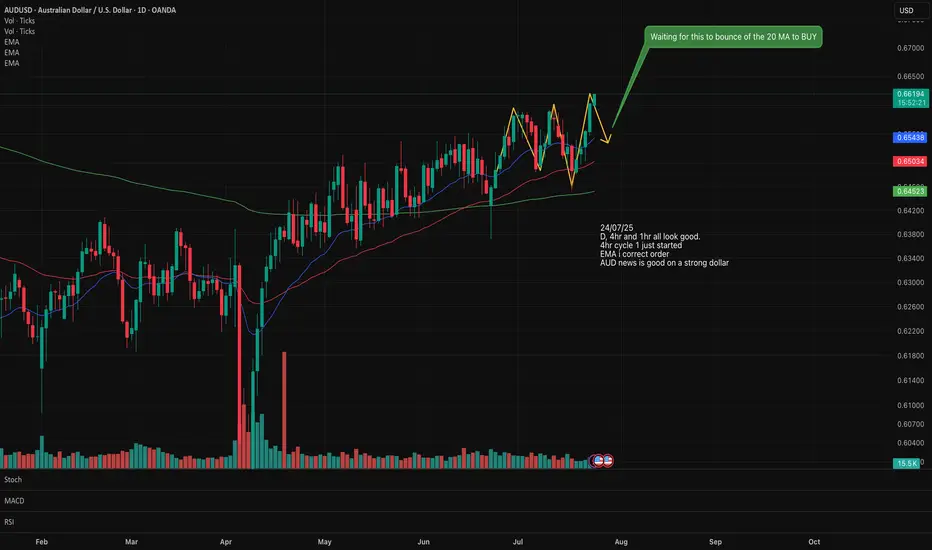
AUS/USD Long/Buy setting upLooking at AUS/USD for a potential Buy setting up on the Daily and 4 hr.
EMA has lined up in the correct stacking order.
An upward trend can be observed. The 20 has crossed over the 50.
We are starting a new Cycle 1 on the upward so I will wait for the pull back to the 20MA which will form the Cycle 2 then wait for the new Cycle 1 on the upward to start again before I buy in.
Sell area audusdStrong sell expected from the marked level
Wait to sweep high and high possible to respect the downtrend channel

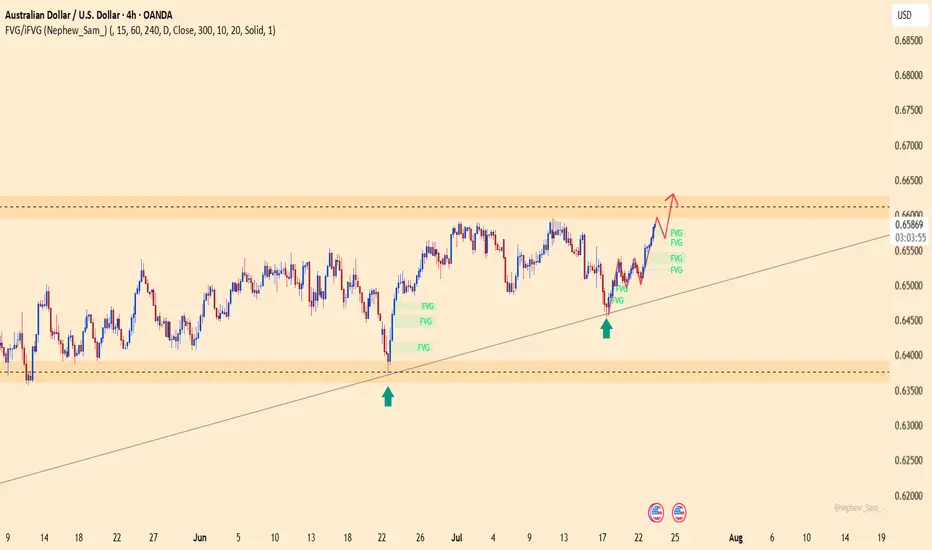
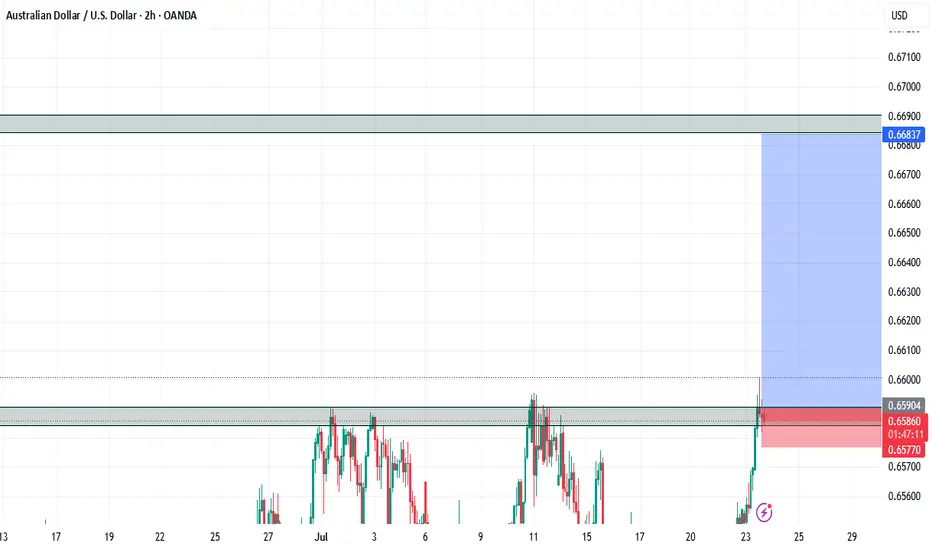
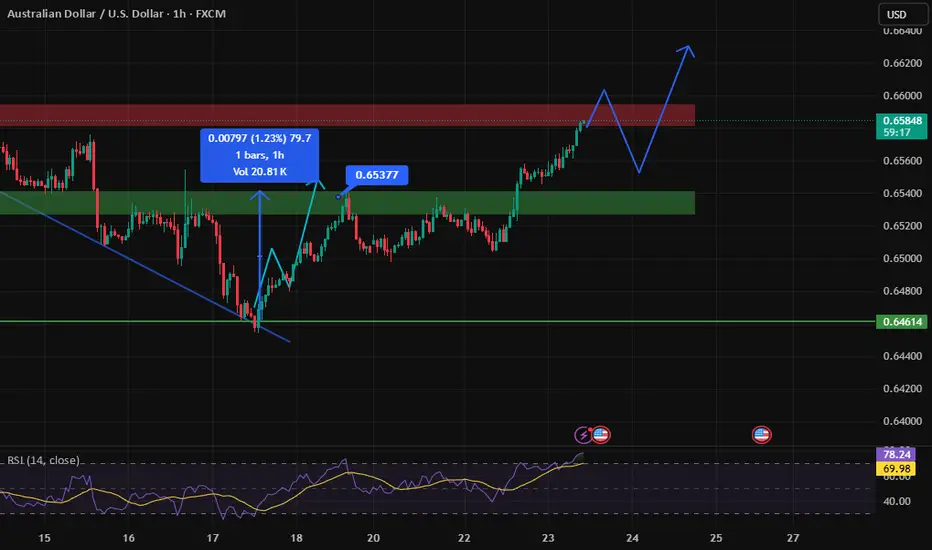
AUDUSD – a rebound from the bottom, ready to break free?After a strong bounce off the ascending trendline, AUDUSD is climbing decisively, clearing out multiple FVG zones on its way toward the key resistance near 0.66300. The bullish structure is intact, and buyers are clearly in control.
News backing the move:
– U.S. S&P Global PMI just came in below expectations, slowing the USD.
– China – Australia’s major trading partner – is signaling fresh stimulus, giving AUD an indirect boost.
If price reaches the 0.66300 zone without strong rejection, this could trigger a breakout that sets the stage for a new rally in August.
Caution: A USD rebound from this week’s data could briefly slow AUDUSD. But for now, the bulls are driving!

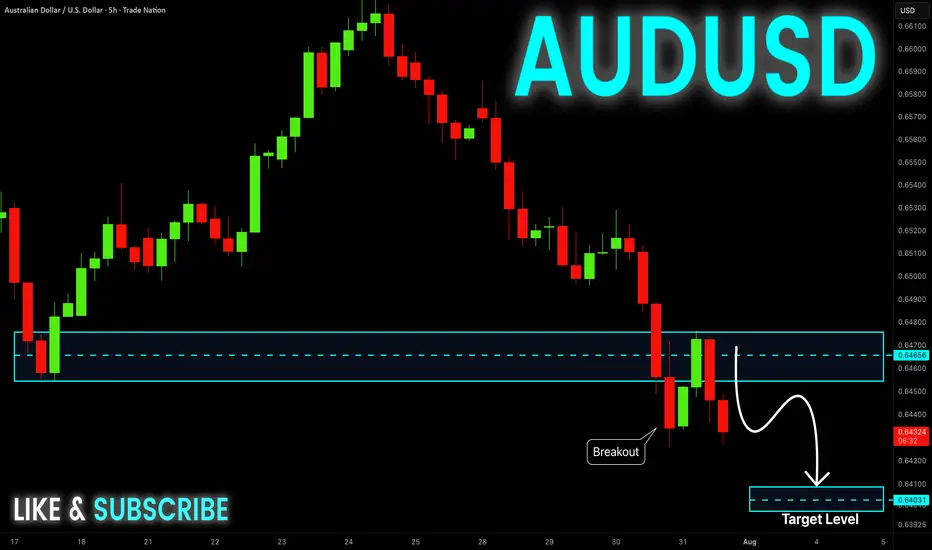
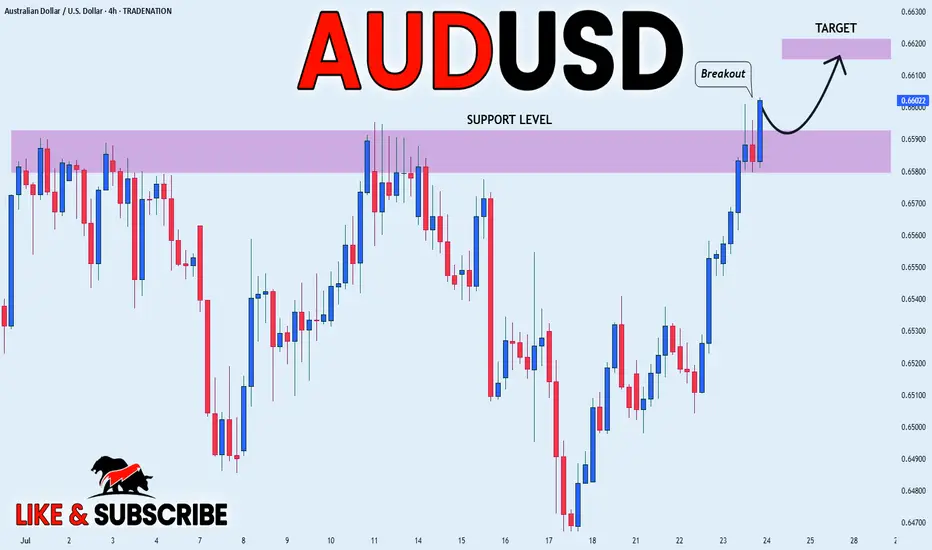
AUD_USD BULLISH BREAKOUT|LONG|
✅AUD_USD is going up
Now and the pair made a bullish
Breakout of the key horizontal
Level of 0.6590 and the breakout
Is confirmed so we are bullish
Biased and we will be expecting
A further bullish move up
LONG🚀
✅Like and subscribe to never miss a new idea!✅
Disclosure: I am part of Trade Nation's Influencer program and receive a monthly fee for using their TradingView charts in my analysis.
audusd sell signal. Don't forget about stop-loss.
Write in the comments all your questions and instruments analysis of which you want to see.
Friends, push the like button, write a comment, and share with your mates - that would be the best THANK YOU.
P.S. I personally will open entry if the price will show it according to my strategy.
Always make your analysis before a trade

AUDUSDContinuation to the upside on Aussie to Dollar, bias is to pull up to the next resistance zone.watch out for price reaction
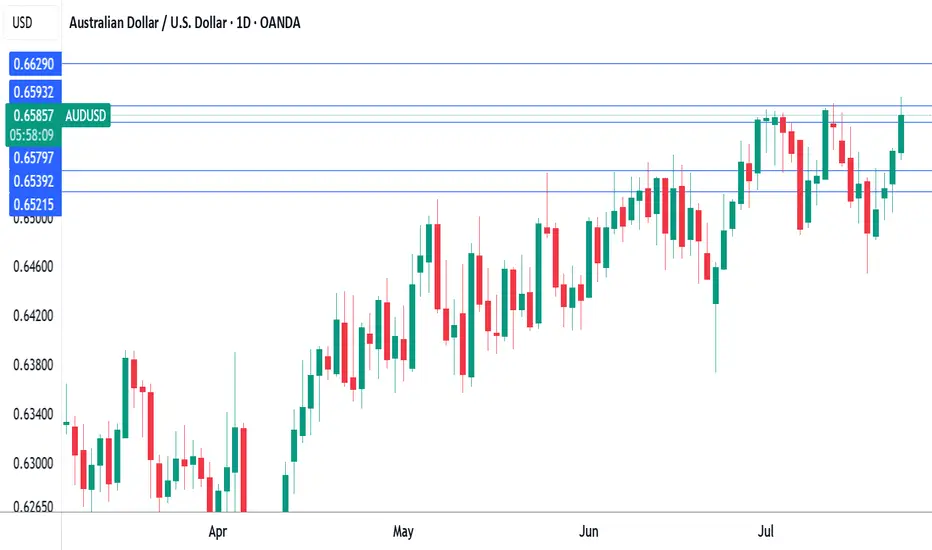
Australian dollar hits eight-month high on risk-on moodThe Australian dollar has rallied for a fourth sucessive day. In the North American session, AUD/USD is trading at 0.6588, up 0.50% on the day. The red-hot Aussie has jumped 1.6% since Thursday and hit a daily high of 0.6600 earlier, its highest level since Nov. 2024.
The financial markets are in a risk-on mood today, buoyed by the announcement that the US and Japan have reached a trade agreement. Under the deal, the US will impose 15% tariffs on Japanese products, including automobiles. As well, Japan will invest some $550 billion into the US.
Global stock markets are higher and the Australian dollar, a gauge of risk appetite, has climbed to an eight-month high.
Investors also reacted positively today to reports that negotiations between the US and China were speeding up and the US could grant an extension of the August 12 deadline to reach an agreement. The latest positive developments on the tariff front have raised hopes that the US will also sign trade deals with the European Union and South Korea.
The White House continues to put pressure on the Federal Reserve. Earlier this week, Treasury Scott Bessent called for a thorough review of the Federal Reserve. Bessent echoed President Trump's calls for the Fed to lower interest rates.
Fed Chair Jerome Powell hasn't shown any signs of plans to cut rates and has fired back that the uncertainty over Trump's trade policy has forced the Fed to adopt a wait-and-see policy. The Fed is widely expected to hold rates at the July 30 meeting but there is a 58% likelihood of a rate cut in September, according to CME's FedWatch.
AUD/USD has pushed above resistance at 0.6579 and tested resistance at 0.6593 earlier. Next, there is resistance at 0.6629
0.6539 and 0.6521 are the next support levels
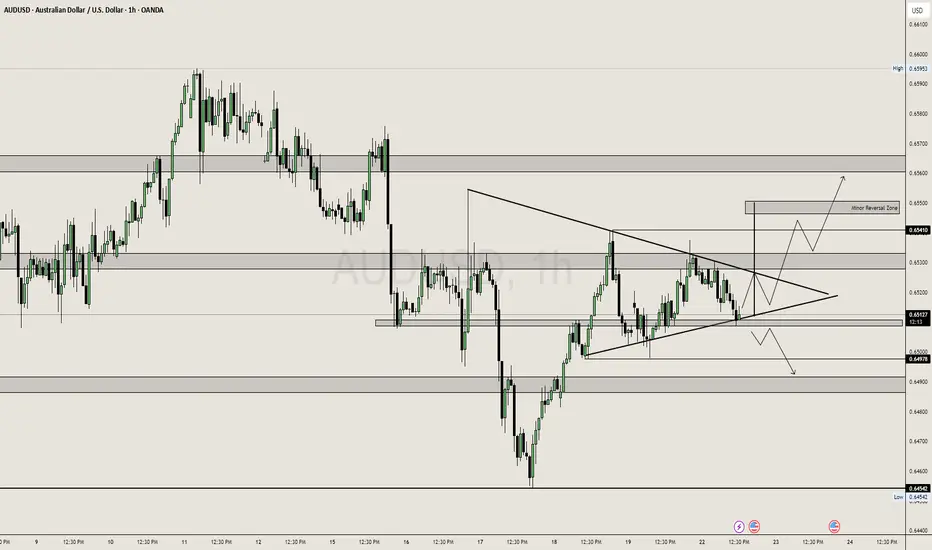
AUDUSD: Symmetrical Triangle
Price is consolidating inside a symmetrical triangle, showing indecision between bulls and bears.
Before entering the triangle, the market showed strong bullish momentum, indicating a possible continuation pattern.
Price is hovering near a key support level (0.6513) where multiple candle wicks suggest buying pressure is defending.
🔍 Key Zones & Levels:
Support (0.6500–0.6510):
Price is reacting strongly here.
A break below this = bearish pressure → could retest lower demand zones.
Resistance (0.6530–0.6541):
Mid-structure resistance.
Clean breakout above this confirms bullish control.
Minor Reversal Zone (0.6555):
If bulls break above triangle, this area may stall price or reverse short term.
Ideal area for TP or trailing SL.
Demand Zone (0.6454):
Strong historical buy zone.
Only likely to hit if triangle breaks down aggressively.
📈 Bullish Scenario:
If price breaks and closes above triangle + 0.6530 zone, expect:
Rally to 0.6541 (first target)
Extension toward 0.6555 where reversal/supply could kick in.
Momentum and volume confirmation needed — no breakout = no trade.
📉 Bearish Scenario:
If price breaks below triangle & 0.6500, expect:
Drop to 0.6490 (minor support)
Further slide toward 0.6454 (major support) if downside accelerates.
1h chart look outAUD/USD breaks out of the falling wedge pattern with strong bullish momentum. Price is aiming toward the next key resistance zone around 0.6600 – 0.6650. A successful retest of the breakout could confirm further upside potential.

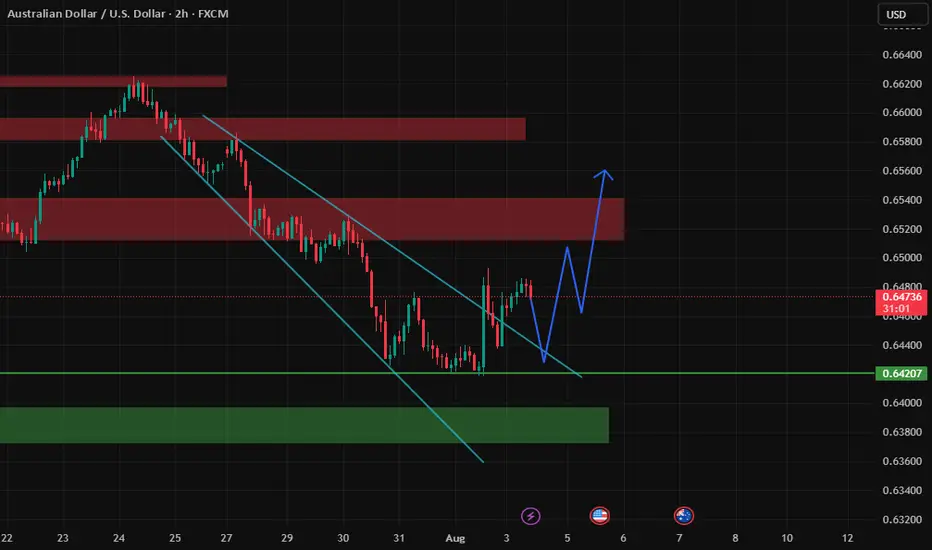
Possibility of uptrend It is expected that a trend change will take place within the current support area and we will witness the start of an uptrend. Otherwise, a continuation of the downtrend with a break of the support area is likely.

AUDUSD – DAILY FORECAST Q3 | W32 | D6 | Y25📊 AUDUSD – DAILY FORECAST
Q3 | W32 | D6 | Y25
Daily Forecast 🔍📅
Here’s a short diagnosis of the current chart setup 🧠📈
Higher time frame order blocks have been identified — these are our patient points of interest 🎯🧭.
It’s crucial to wait for a confirmed break of structure 🧱✅ before forming a directional bias.
This keeps us disciplined and aligned with what price action is truly telling us.
📈 Risk Management Protocols
🔑 Core principles:
Max 1% risk per trade
Only execute at pre-identified levels
Use alerts, not emotion
Stick to your RR plan — minimum 1:2
🧠 You’re not paid for how many trades you take, you’re paid for how well you manage risk.
🧠 Weekly FRGNT Insight
"Trade what the market gives, not what your ego wants."
Stay mechanical. Stay focused. Let the probabilities work.
FX:AUDUSD

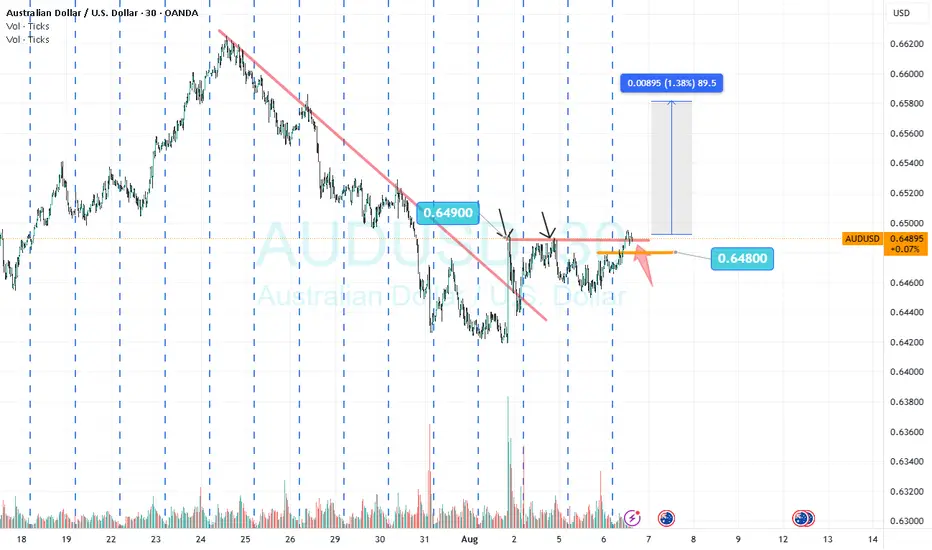
AUDUSD?
Hi,
Few days of rejection high 0.64900
Hope it breaks out 0.65000
Anything below 0.64800
I don't think, will get it at another round
All the best
Not a guru
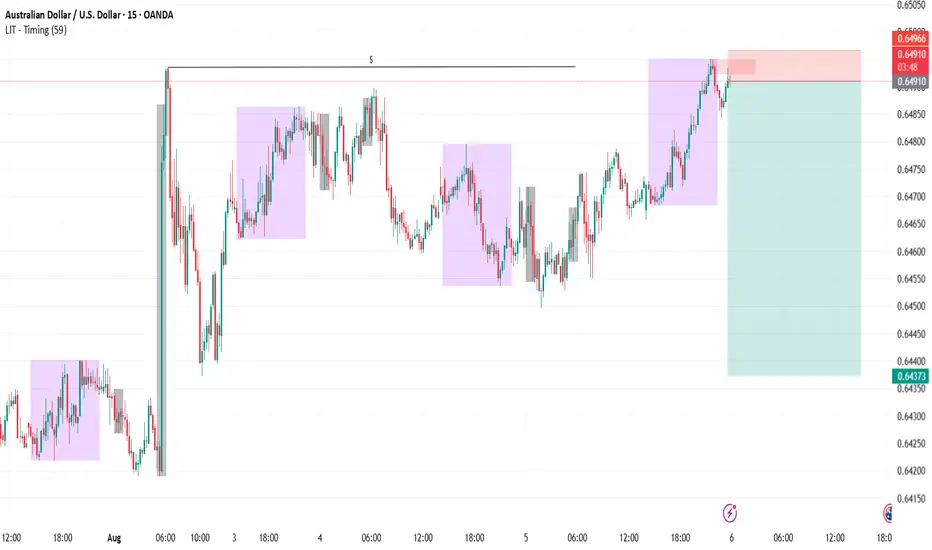
AUDUSD SellLIT cycle. Daily cycle. Liquidity grab or also known as inducement on the high. Session timing.
Nibbling some Aussie dollarsNever mind if I am late in the game. I think there is still some room for the Aussie dollars to rally.
I have indicated two potential profit targets.
Please DYODD

AUDUSD: Short entry triggerGood morning everyone,
today I am sharing a Short signal received now via alert from the LuBot Ultimate indicator.
Entry made on correction (approximately 50% of the trigger candle).
In this case I will follow the levels suggested by the indicator regarding both the TP and SL. Levels that will update as the trade progresses.
The signal is confirmed by the negative structure (red candles) that has just started on the 4H and a bearish trend confirmed by the signal a few candles back (Bear Trend signal).
The predictum also shows a bearish signal, therefore predicting a negative situation for the current month.
👍 If you want to see other similar posts, like/boost
🙋♂️ Remember to follow me so you don't miss my future analyses
⚠️ Disclaimer: This post is for informational purposes only and does not constitute financial advice. Always do your research before making investment decisions.

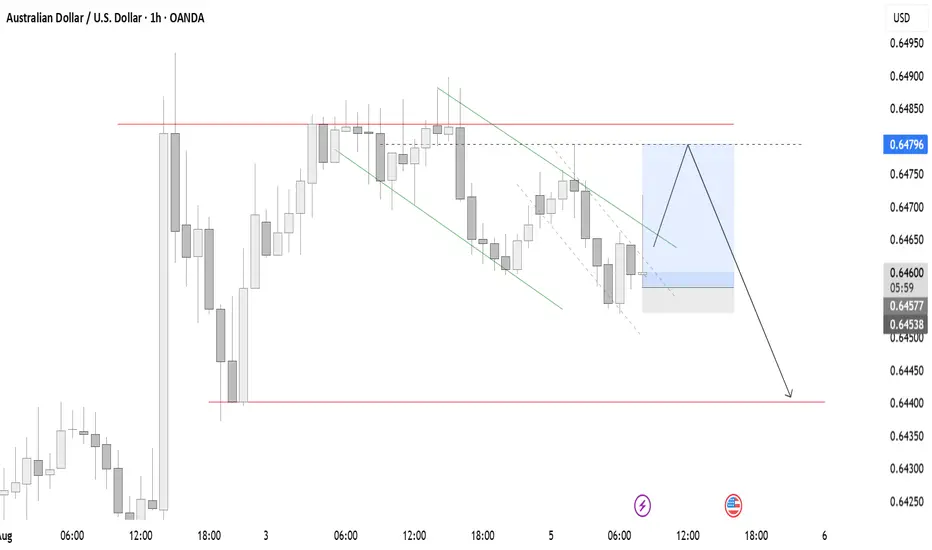
BUY AUDUSDAUDUSD BUY Idea
Session: London
Target: 0,64796
We can expect a bullish liquidity grab in the next few hours
AUD/USDThis analysis is based on a combination of volume analysis, Fibonacci retracement levels, and Stochastic oscillator signals to find an optimal entry point. The trade setup suggests a potential bullish move after confirming support and momentum alignment.
Entry: 0.6475 area
Stop-Loss: 0.6465 area
Take-Profit: 0.6498 area
This setup aims to capitalize on a high-probability bounce within a key Fibonacci zone, confirmed by volume strength and oversold readings on the Stochastic indicator.
⚠️ Disclaimer:
This is not financial advice. Trading involves risk and may not be suitable for all investors. Always do your own research and use proper risk management.

AUD-USDYou can withdraw money to the specified support and if the purchase is approved, keep an eye on it.
AUD/USDAUD/USD – Possible Correction Scenario Based on Volume Analysis
This idea presents a potential correction in AUD/USD, based on recent volume behavior suggesting a shift in market sentiment.
Following a strong move, volume has started to decline near the recent lows, hinting at possible seller exhaustion. This may open the path for a short-term bullish correction toward higher value areas.
📍 Entry: 0.64681
🎯 Target: 0.65050
🛑 Stop-loss: 0.64428
This is a possible scenario, not a guaranteed outcome. Always monitor price action and volume for confirmation.
Disclaimer: This analysis is for educational purposes only and does not constitute financial advice. Always do your own research and manage risk appropriately.
Ask ChatGPT

AUD-USD Will Go Down! Sell!
Hello,Traders!
AUD-USD is trading in a
Downtrend and the pair
Broke the key horizontal
Level of 0.6470 which is
Now a resistance then
Made a retest and a
Confident pullback which
Reinforces our bearish
Bias and makes us expect
A further bearish move down
Sell!
Comment and subscribe to help us grow!
Check out other forecasts below too!
Disclosure: I am part of Trade Nation's Influencer program and receive a monthly fee for using their TradingView charts in my analysis.