AUDUSD(20250724)Today's AnalysisMarket news:
U.S. President Trump continued to lash out at the Federal Reserve on Tuesday, but seemed to back off from the remaining plan to fire Chairman Powell. "I think he's doing a bad job, but he's going to be out of office soon anyway," Trump said in an exchange with reporters at the White House. "In eight months, he'll be out of office."
Technical analysis:
Today's buying and selling boundaries:
0.6580
Support and resistance levels:
0.6639
0.6617
0.6603
0.6558
0.6543
0.6521
Trading strategy:
Upward breakthrough of 0.6603, consider entering the market to buy, the first target price is 0.6617
Downward breakthrough of 0.6580, consider entering the market to sell, the first target price is 0.6558
USDAUD trade ideas

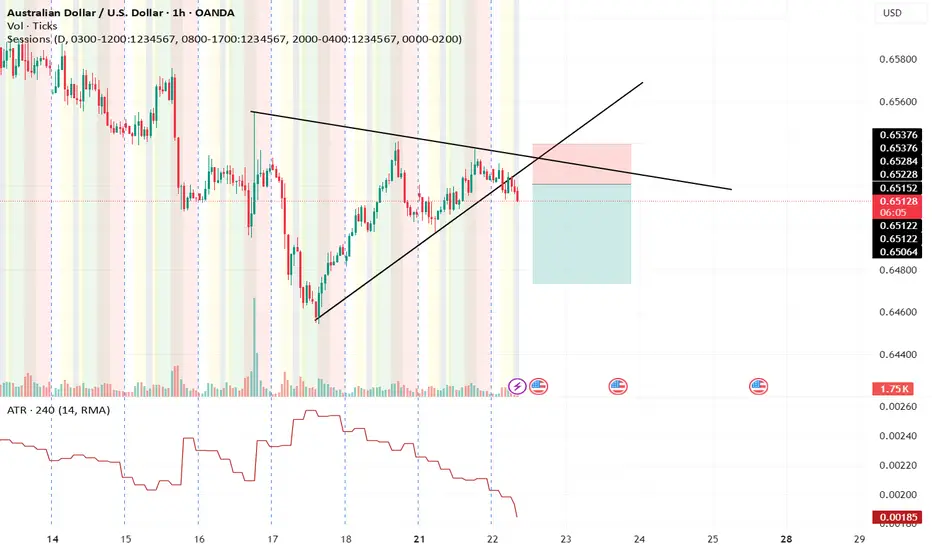
breakout idea1. Day high break
2. retest
3. ATR is increasing
4. price already return to bb
5. Planning to go long.
6. Waiting for confirmation candle
thanks

Market Analysis: AUD/USD Climbs as Dollar WeakensMarket Analysis: AUD/USD Climbs as Dollar Weakens
AUD/USD started a decent increase above the 0.6520 level.
Important Takeaways for AUD/USD Analysis Today
- The Aussie Dollar rebounded after forming a base above the 0.6450 level against the US Dollar.
- There is a connecting bullish trend line forming with support at 0.6540 on the hourly chart of AUD/USD.
AUD/USD Technical Analysis
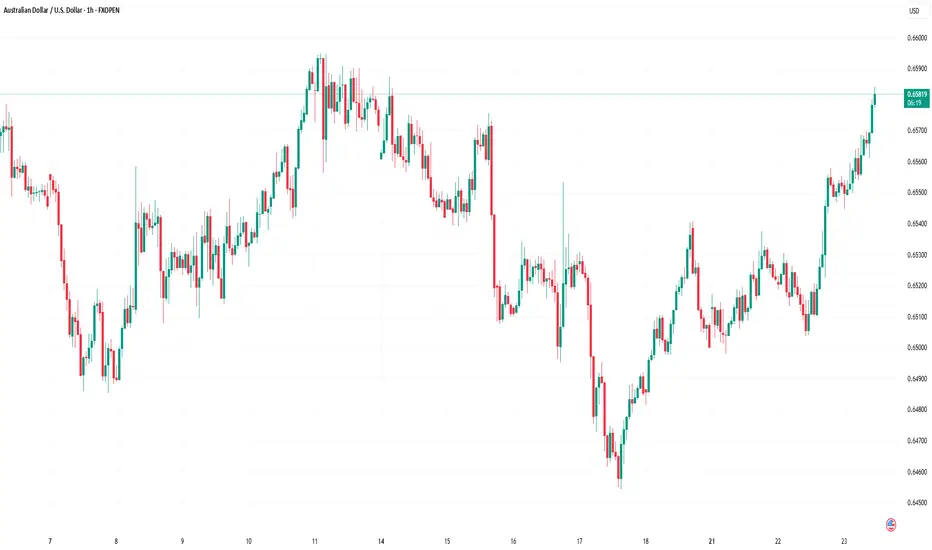
On the hourly chart of AUD/USD at FXOpen, the pair started a fresh increase from the 0.6450 support. The Aussie Dollar was able to clear the 0.6500 resistance to move into a positive zone against the US Dollar.
There was a close above the 0.6550 resistance and the 50-hour simple moving average. Finally, the pair tested the 0.6565 zone. A high was formed near 0.6564 and the pair recently started a consolidation phase.
On the downside, initial support is near the 0.6540 level. There is also a connecting bullish trend line forming with support at 0.6540. It is close to the 23.6% Fib retracement level of the upward move from the 0.6454 swing low to the 0.6564 high.
The next major support is near the 0.6495 zone. If there is a downside break below it, the pair could extend its decline toward the 0.6480 level. It is close to the 76.4% Fib retracement level.
Any more losses might signal a move toward 0.6450. On the upside, the AUD/USD chart indicates that the pair is now facing resistance near 0.6565. The first major resistance might be 0.6575. An upside break above the 0.6575 resistance might send the pair further higher.
The next major resistance is near the 0.6600 level. Any more gains could clear the path for a move toward the 0.6650 resistance zone.
This article represents the opinion of the Companies operating under the FXOpen brand only. It is not to be construed as an offer, solicitation, or recommendation with respect to products and services provided by the Companies operating under the FXOpen brand, nor is it to be considered financial advice.
AUD USD short as it appears it seems there is a breakout don't rush to it it 90 percent of the time pull back to the original price yet i couldn't find better risk to reward ration on other prices lets see ...
Please note: This is for educational purposes only and not a trading signal. These ideas are shared purely for back testing and to exchange views. The goal is to inspire ideas and encourage discussion. If you notice anything wrong, feel free to share your thoughts. In the end, to learn is to share !
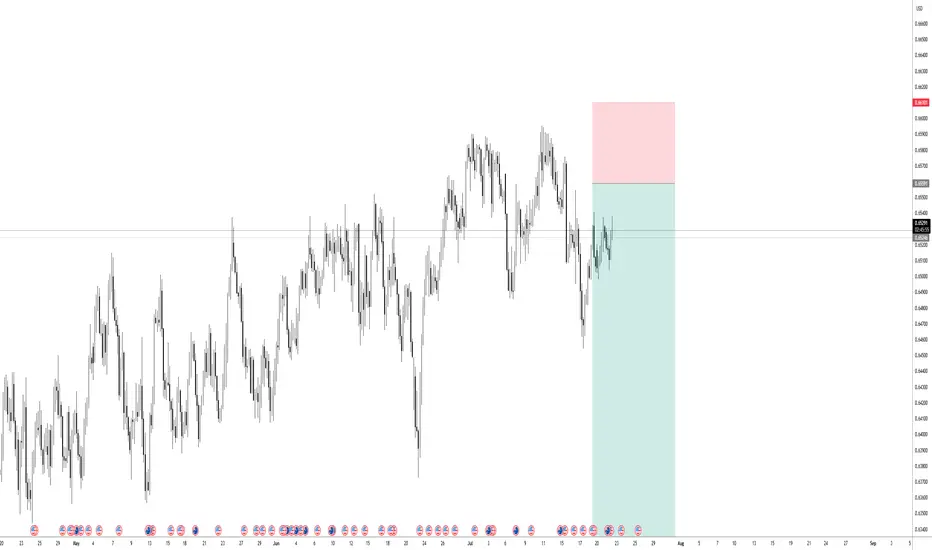
AUDUSD Q3 | D23 | W30 | Y25📊AUDUSD Q3 | D23 | W30 | Y25
Daily Forecast🔍📅
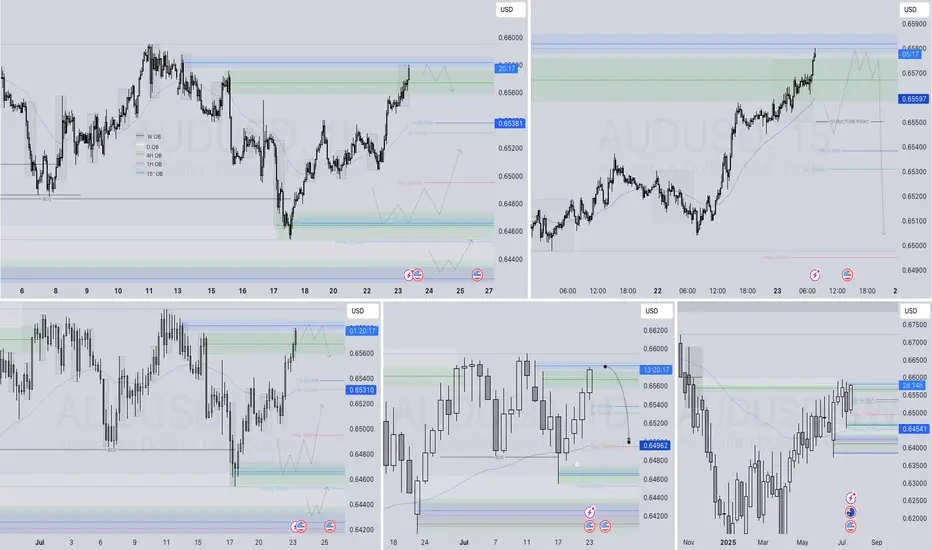
Here’s a short diagnosis of the current chart setup 🧠📈
Higher time frame order blocks have been identified — these are our patient points of interest 🎯🧭.
It’s crucial to wait for a confirmed break of structure 🧱✅ before forming a directional bias.
This keeps us disciplined and aligned with what price action is truly telling us.
📈 Risk Management Protocols
🔑 Core principles:
Max 1% risk per trade
Only execute at pre-identified levels
Use alerts, not emotion
Stick to your RR plan — minimum 1:2
🧠 You’re not paid for how many trades you take, you’re paid for how well you manage risk.
🧠 Weekly FRGNT Insight
"Trade what the market gives, not what your ego wants."
Stay mechanical. Stay focused. Let the probabilities work.
FRGNT
Buy Aud from pivoton the 1D chart there is some uptrend
on 1H and 4H chart price is testing the pivot line for support
if the support will be strong anought could be good RR
AUDUSD InsightWelcome to all our subscribers!
Please share your personal opinions in the comments. Don't forget to like and subscribe!
Key Points
- Former U.S. Treasury Secretary Scott Bessent stated regarding Fed Chair Powell, “There is nothing that would make me say he should step down immediately,” — a remark that stands in contrast to previous comments made by former President Trump and his close aides.
- On U.S.-China trade negotiations, Secretary Bessent mentioned, “We will meet with Chinese officials in Stockholm on Monday and Tuesday to discuss extending the trade truce deadline.”
- Goldman Sachs has projected the U.S. growth rate this year at 1.1%. In a report, Jan Hatzius, Chief Economist at Goldman Sachs, estimated the probability of a U.S. recession at 30%, which is double the normal level.
Major Economic Events This Week
+ July 24: ECB Interest Rate Decision
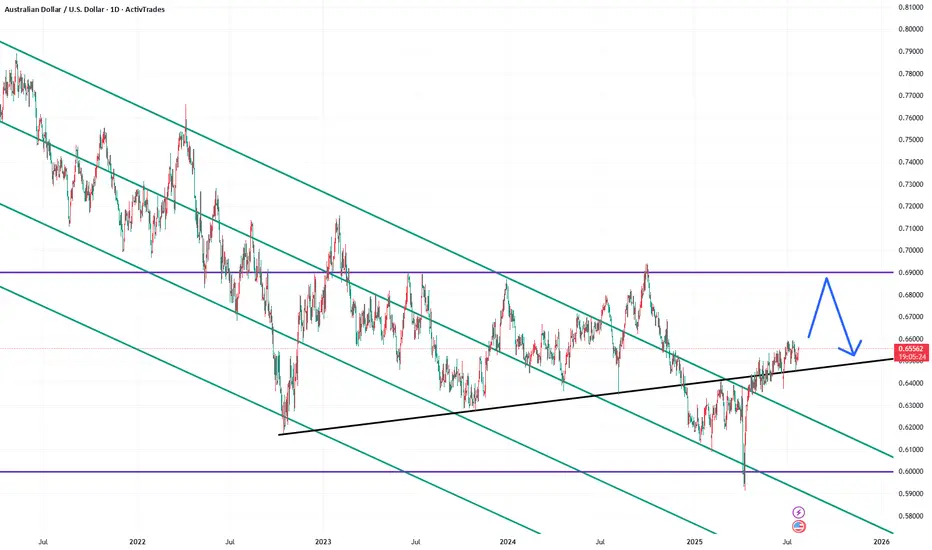
AUDUSD Chart Analysis
The pair continues a gentle upward trend within its channel. As previously anticipated, a long-term rise toward the 0.69000 level is expected. However, resistance is still observed around the 0.66000 level. A breakout above this zone could lead to a swift rise toward 0.67000. Still, there is minor resistance near 0.67000, which may temporarily limit upward momentum. A slight pullback may occur before another upward move resumes.
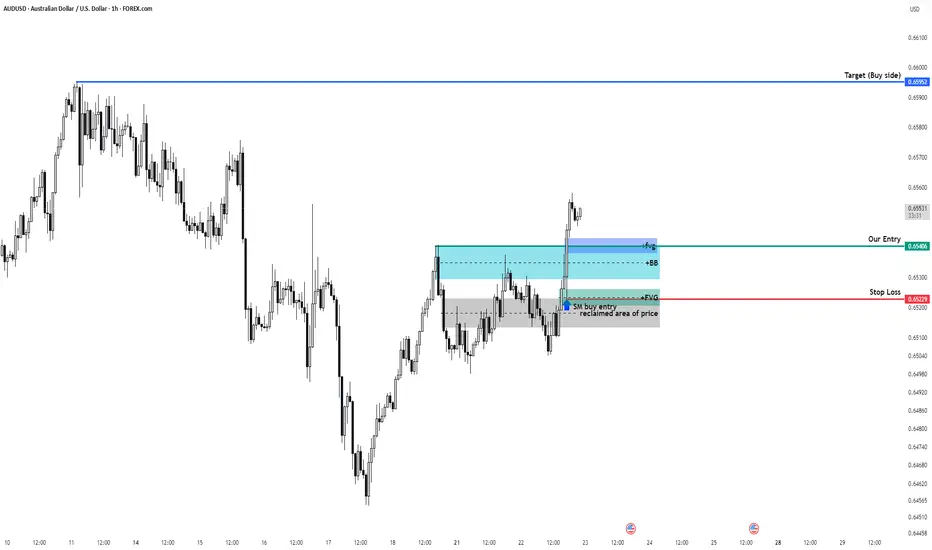
AUDUSD Long - A BreakdownAfter a thorough breakdown, I decided to enter longs on AUD/USD. I expect for price to reach highs of around .65898 Which is the daily structure high Currently in profit On a long position and We entered on the 5 minute using a one hour stop loss Hopefully this trade continues to play out, and we'll see you on the other side of profit.

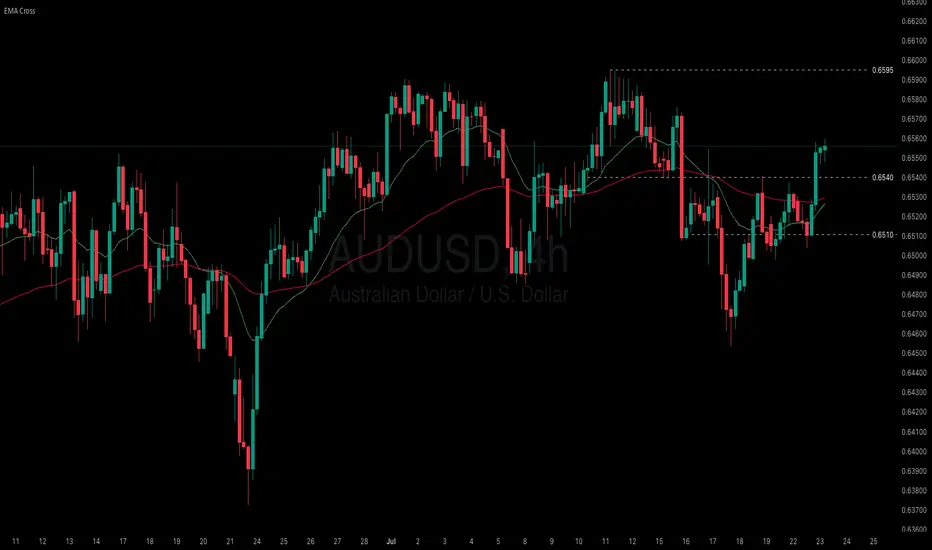
Australia faces a dilemma between inflation and labor slowdown
The RBA, in its latest meeting minutes, emphasized that the recent rate hold reflects a cautious and gradual approach toward achieving its inflation target. While the central bank noted the need for further data to confirm a decline in inflation, some Board members flagged rising unemployment as a signal of potential labor market softening. Bloomberg added that Australia’s export-driven economy remains vulnerable to tariff-related uncertainties, while private demand growth remains sluggish.
AUDUSD extended its uptrend after testing the low at 0.6455, reaching as high as 0.6560. Both EMAs narrow the gap, indicating a potential shift toward bullish momentum. If AUDUSD holds above both EMAs, the price could gain upward momentum toward the high at 0.6595. Conversely, if AUDUSD breaks below the support at 0.6540, the price may retreat toward 0.6510.
AUDUSD Ready to enter Buy?✅ **Market & Timeframe:**
AUD/USD, 1‑hour chart.
✅ **Overall Bias (multi‑timeframe):**
* Weekly: Bullish
* Daily: Bearish
* 12H: Bullish
* 6H: Bullish
* 4H: Bullish
➡️ **≈ 80% Bullish bias overall.**
✅ **Pattern & Structure:**
You’ve clearly highlighted an **Inverse Head and Shoulders**:
* Left Shoulder near 0.6520
* Head near 0.6500
* Right Shoulder near 0.6525
Price has broken above the neckline (\~0.6540 area).
✅ **Key Levels:**
* **Daily AOI (Area of Interest):** 0.6537–0.6541
(price currently above, expected to retest this zone)
* **Next upside target:** 0.6588–0.6590
* **Major support:** Lower Daily AOI around 0.6466–0.6490
✅ **Moving Averages:**
* Blue MA (shorter) is above red MA (longer) – showing upward momentum.
✅ **Price Action Plan (illustrated by your arrows):**
1. Price has just broken out above the neckline.
2. Expecting a **retest back into Daily AOI (\~0.6540)**.
3. Looking for bullish confirmation there (e.g., bullish candlestick pattern) to enter **long**.
4. Targeting the resistance zone around **0.6588–0.6590**.
---
📌 **Summary:**
Your chart signals an **80% bullish setup**.
✅ Inverse head & shoulders → breakout above neckline.
✅ Wait for price to pull back into Daily AOI (0.6537–0.6541).
✅ Look for bullish confirmation → then enter long.
🎯 Target: \~0.6588–0.6590.

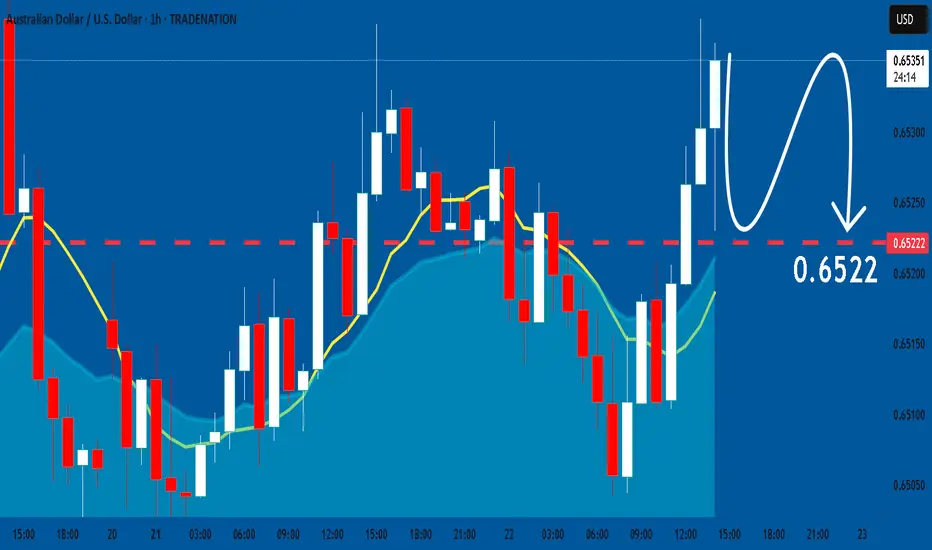
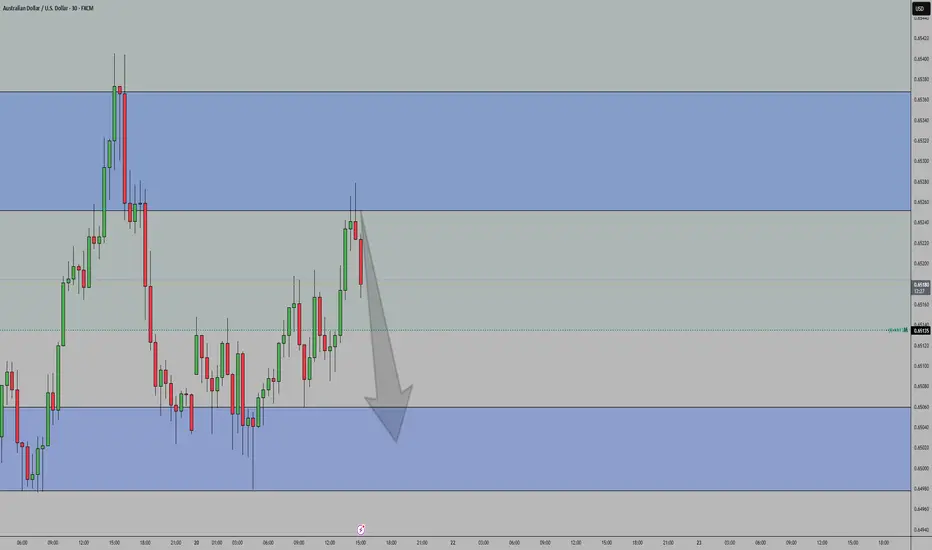
AUDUSD: Bearish Continuation is Highly Probable! Here is Why:
The charts are full of distraction, disturbance and are a graveyard of fear and greed which shall not cloud our judgement on the current state of affairs in the AUDUSD pair price action which suggests a high likelihood of a coming move down.
Disclosure: I am part of Trade Nation's Influencer program and receive a monthly fee for using their TradingView charts in my analysis.
❤️ Please, support our work with like & comment! ❤️
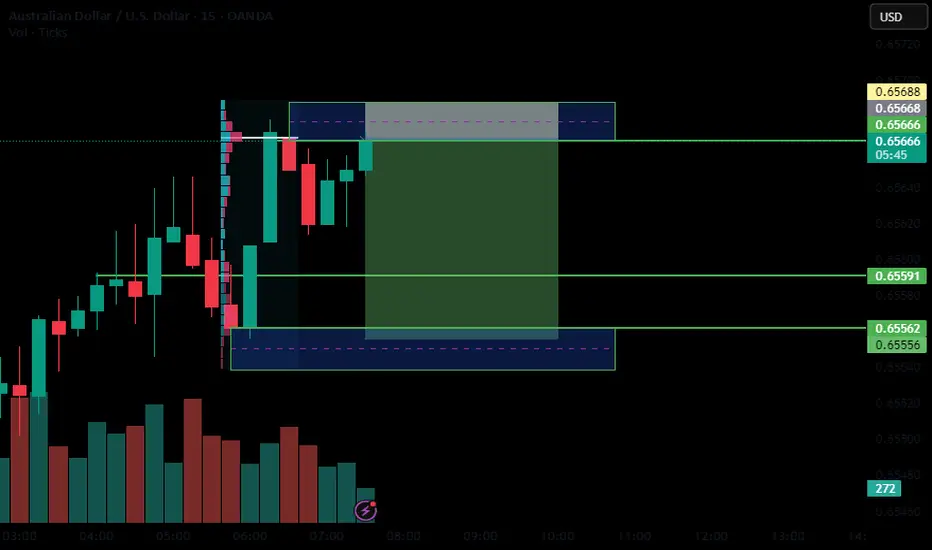
AUD/USD – 15m Demand📊 Trade Breakdown:
Pair: AUD/USD
Timeframe: 15 Minute
Bias: Bullish
Type: Demand Zone Rejection
Entry: 0.65264
Stop Loss: 0.65186
Take Profit: 0.65570
Risk-to-Reward: ~3R
⸻
📌 Key Confluences:
• Clean 15m demand zone formed after a sharp impulse move
• Strong bullish engulfing candle from demand
• Liquidity sweep to the left prior to demand forming
• Structure shift with higher highs and higher lows
• Previous resistance flipped to support at entry zone
• AUD strength showing on intraday sentiment across multiple pairs
⸻
⚙️ Trade Setup:
Entered long after price tapped into the refined 15m demand zone and printed a bullish rejection wick. SL placed just below the zone to avoid noise. TP set near a prior 15m supply area / liquidity sweep zone.
I’m watching for continuation on the next 15m-1h candle closures. If price breaks above 0.6544, expecting follow-through to 0.6557+.
⸻
🧠 Mindset:
Stayed patient waiting for price to come to me. No FOMO. Clear invalidation and clean R:R. Confidence in the setup due to structure, confluences, and reaction off the zone. Trusting the process and letting the trade breathe.
Trade Simple, Live Lavish

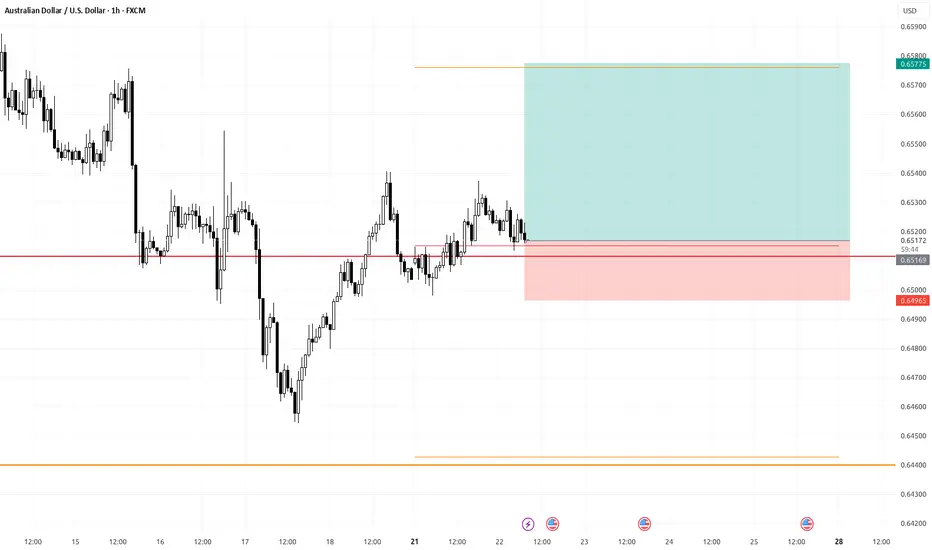
AUD/USD Channel Breakdown Could Threaten Bullish StructureAUD/USD is currently holding just above the 0.6500 psychological level after retreating from the 0.6558 Fibonacci resistance (61.8% retracement of the October–April decline). Price action has recently broken beneath the lower boundary of a rising wedge pattern—a traditionally bearish signal—raising the risk of deeper downside ahead.
The 50-day SMA (0.6498) and 200-day SMA (0.6399) are converging, with the former now acting as dynamic support following today’s bounce. However, momentum indicators offer limited bullish conviction: the RSI hovers near neutral at 51.5, and the MACD is flatlining just above zero, suggesting a pause in directional bias.
If bears push price back under 0.6500, the rising wedge breakdown could accelerate toward the 200-day SMA and potentially the horizontal support zone at 0.6178. On the flip side, a recovery above 0.6558 would invalidate the wedge and open the door for a run toward the 78.6% retracement near 0.6730.
Bias: Cautiously bearish while below 0.6558, especially if daily closes begin to settle under 0.6500. A loss of the 200-day SMA would confirm a trend reversal.
Time frame: Short- to medium-term (days to weeks)
-MW

VMS STRATEGY APPLIED📈 VMS Strategy – Triple Top Win Example
We took this trade last Monday based on a textbook triple top reversal:
✅ Clean engulfing candle at resistance
✅ Strong downward volume
✅ Momentum clearly shifting in the trade direction
✅ Perfect timing with all elements aligning
On the 4-hour chart, we focus on specific reversal patterns within the VMS framework:
***Triple tops/bottoms
***Head & shoulders
***1-2-3 formations
***Hammer and shooting star reversals
Each setup must meet all VMS criteria before being considered.
A quick note on back testing:
We know traditional back testing can feel flawed—but here’s what works for us:
Start at the beginning of the month, hide future candles, and scan for VMS setups in real-time conditions. The trade either fits the rules—or it doesn’t. There’s no debate.
We’re not claiming perfection. This strategy does take losses—sometimes multiple in a row. But over time, through strict rule-following and patience, we’ve found consistency and success.
If this helps you, feel free to share it—or even just take a closer look.
With respect, always test it for yourself before trading live.
We’re here to share what’s working for us. We welcome thoughts and suggestions—but know this:
👉 This is a rules-based strategy rooted in discipline, not prediction.
🔒 Aligned Execution is the Edge.

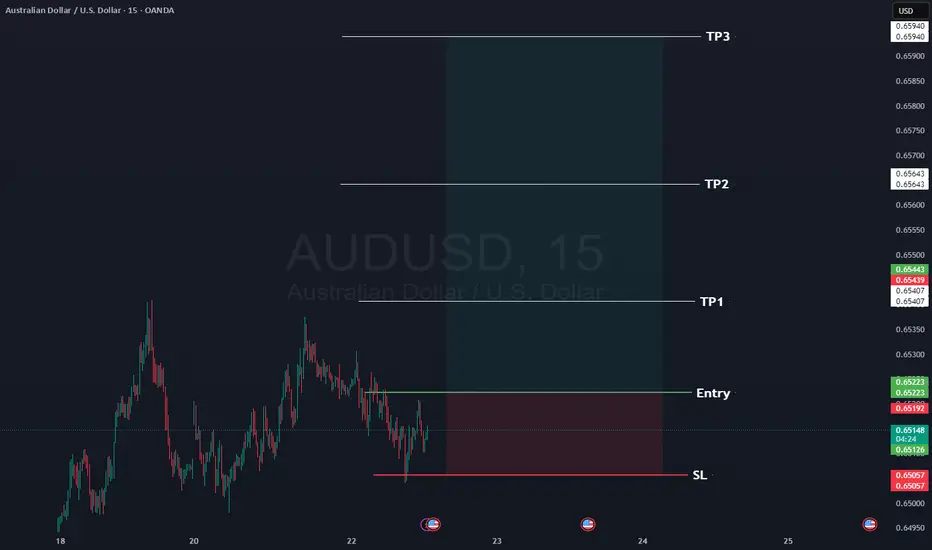
AUDUSD Here is our signal for AUDUSD
Occasionally we give a free signal, so here's AUDUSD long.
Rules:
1- Wait for the 15 minute to close with momentum above the entry, ideally we want a re-test of the entry.
2- at TP1 move your SL to entry.
3- If you want to close at TP2 then do so.
📊Entry: 0.65223
⚠️SL: 0.65057
✔️TP1: 0.65407
✔️TP2: 0.65643
✔️TP3: 0.65940
Happy Trading,
Sarah
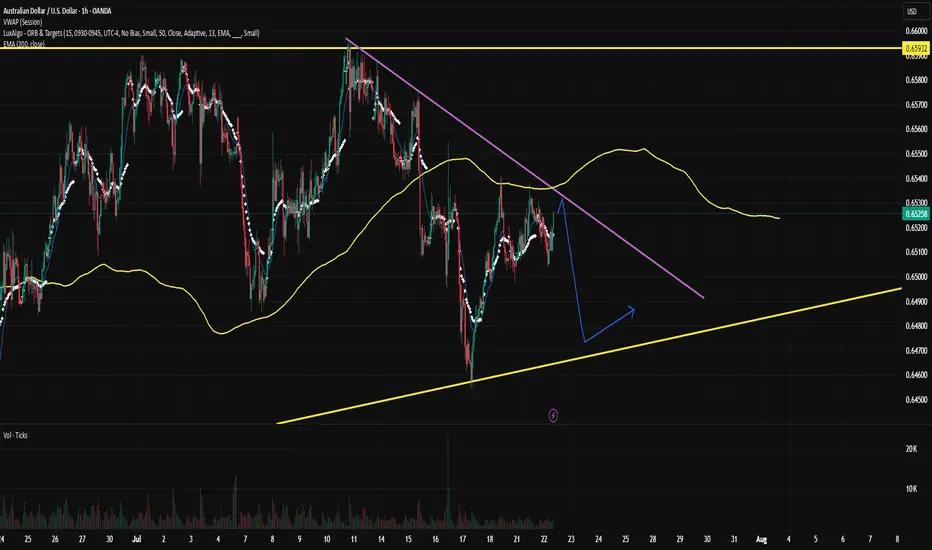
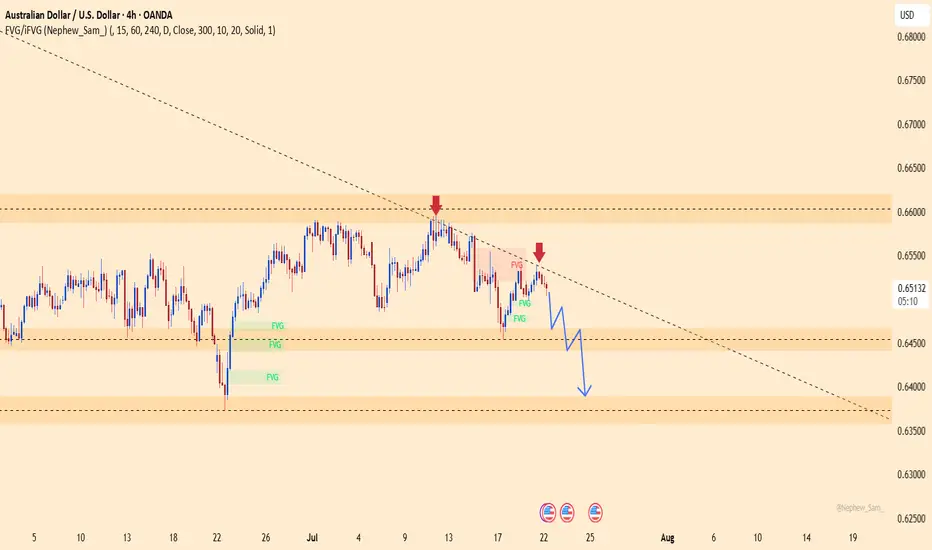
AUDUSD – Sellers taking over, the drop is on!This pair just got slapped hard at the descending trendline, right as it hit a familiar resistance zone. No more doubts – buyers are losing steam, and sellers are waiting to strike.
Market sentiment from Down Under is shaking, with weak economic signals piling up. Meanwhile, the mighty U.S. dollar is reclaiming the spotlight after gold’s flashy surge. The tide has turned!
Unless a miracle shows up, AUDUSD is set to dive deeper – and this is the perfect stage for traders who thrive on strong downtrends.
Sellers are in position – are you ready to join the ride?
Bearish reversal off 61.8% Fibonacci resistance?AUD/USD is rising towards the pivot and could reverse to the 1st support, which acts as a pullback support.
Pivot: 0.6543
1st Support: 0.6469
1st Resistance: 0.6590
Risk Warning:
Trading Forex and CFDs carries a high level of risk to your capital and you should only trade with money you can afford to lose. Trading Forex and CFDs may not be suitable for all investors, so please ensure that you fully understand the risks involved and seek independent advice if necessary.
Disclaimer:
The above opinions given constitute general market commentary, and do not constitute the opinion or advice of IC Markets or any form of personal or investment advice.
Any opinions, news, research, analyses, prices, other information, or links to third-party sites contained on this website are provided on an "as-is" basis, are intended only to be informative, is not an advice nor a recommendation, nor research, or a record of our trading prices, or an offer of, or solicitation for a transaction in any financial instrument and thus should not be treated as such. The information provided does not involve any specific investment objectives, financial situation and needs of any specific person who may receive it. Please be aware, that past performance is not a reliable indicator of future performance and/or results. Past Performance or Forward-looking scenarios based upon the reasonable beliefs of the third-party provider are not a guarantee of future performance. Actual results may differ materially from those anticipated in forward-looking or past performance statements. IC Markets makes no representation or warranty and assumes no liability as to the accuracy or completeness of the information provided, nor any loss arising from any investment based on a recommendation, forecast or any information supplied by any third-party.

AUSUSDCOT data shows a bearish bias on AUD with net short positioning (-605), while the USD holds a mild net long position (+321). This reflects institutional sentiment favoring USD strength over AUD, supporting a bearish outlook for AUD/USD.
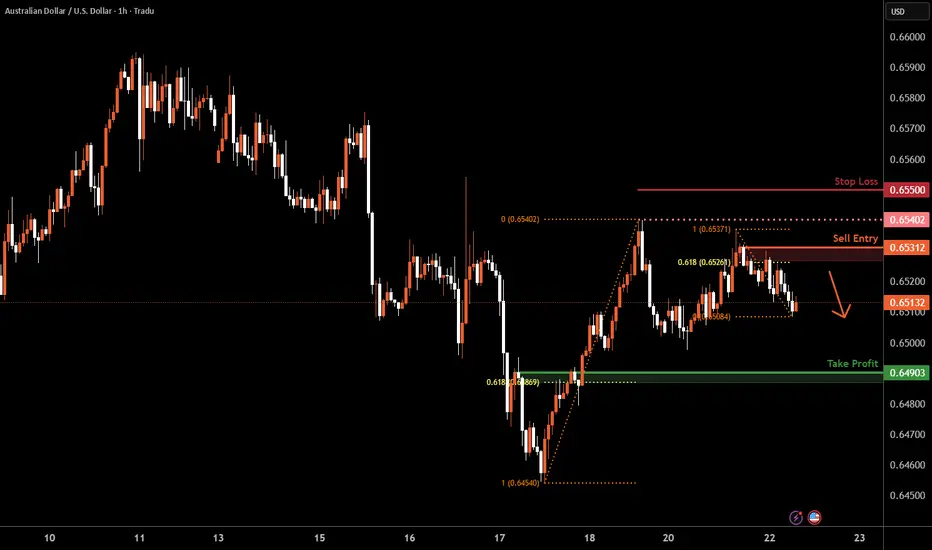
Aussie H1 | Swing-high resistance at a 61.8% Fibo retracementThe Aussie (AUD/USD) is rising towards a swing-high resistance and could potentially reverse off this level to drop lower.
Sell entry is at 0.6531 which is a swing-high resistance that aligns closely with the 61.8% Fibonacci retracement.
Stop loss is at 0.6550 which is a level that sits above a swing-high resistance.
Take profit is at 0.6490 which is a pullback support that aligns with the 61.8% Fibonacci retracement.
High Risk Investment Warning
Trading Forex/CFDs on margin carries a high level of risk and may not be suitable for all investors. Leverage can work against you.
Stratos Markets Limited (tradu.com ):
CFDs are complex instruments and come with a high risk of losing money rapidly due to leverage. 66% of retail investor accounts lose money when trading CFDs with this provider. You should consider whether you understand how CFDs work and whether you can afford to take the high risk of losing your money.
Stratos Europe Ltd (tradu.com ):
CFDs are complex instruments and come with a high risk of losing money rapidly due to leverage. 66% of retail investor accounts lose money when trading CFDs with this provider. You should consider whether you understand how CFDs work and whether you can afford to take the high risk of losing your money.
Stratos Global LLC (tradu.com ):
Losses can exceed deposits.
Please be advised that the information presented on TradingView is provided to Tradu (‘Company’, ‘we’) by a third-party provider (‘TFA Global Pte Ltd’). Please be reminded that you are solely responsible for the trading decisions on your account. There is a very high degree of risk involved in trading. Any information and/or content is intended entirely for research, educational and informational purposes only and does not constitute investment or consultation advice or investment strategy. The information is not tailored to the investment needs of any specific person and therefore does not involve a consideration of any of the investment objectives, financial situation or needs of any viewer that may receive it. Kindly also note that past performance is not a reliable indicator of future results. Actual results may differ materially from those anticipated in forward-looking or past performance statements. We assume no liability as to the accuracy or completeness of any of the information and/or content provided herein and the Company cannot be held responsible for any omission, mistake nor for any loss or damage including without limitation to any loss of profit which may arise from reliance on any information supplied by TFA Global Pte Ltd.
The speaker(s) is neither an employee, agent nor representative of Tradu and is therefore acting independently. The opinions given are their own, constitute general market commentary, and do not constitute the opinion or advice of Tradu or any form of personal or investment advice. Tradu neither endorses nor guarantees offerings of third-party speakers, nor is Tradu responsible for the content, veracity or opinions of third-party speakers, presenters or participants.