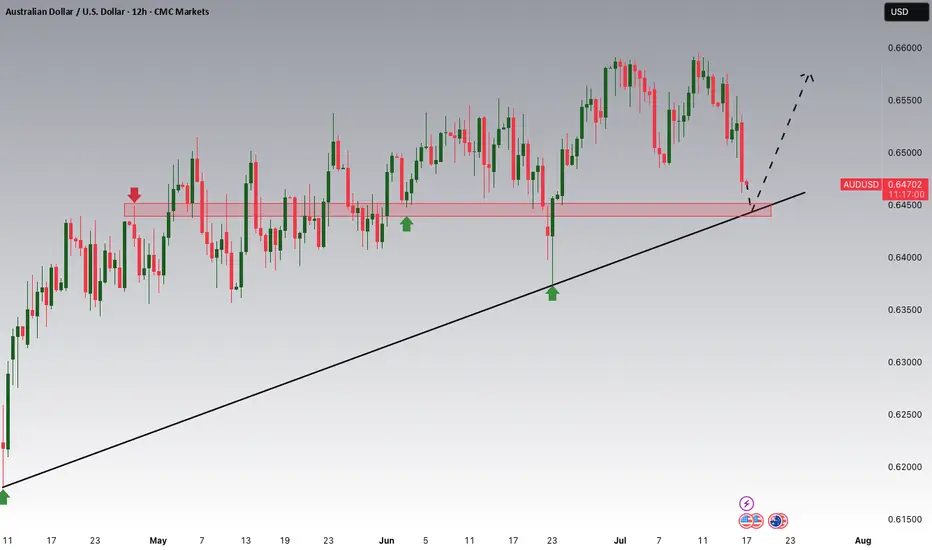
AUDUSD Potential UpsidesHey Traders, in today's trading session we are monitoring AUDUSD for a buying opportunity around 0.64500 zone, AUDUSD is trading in an uptrend and currently is in a correction phase in which it is approaching the trend at 0.64500 support and resistance area.
Trade safe, Joe.
USDAUD trade ideas
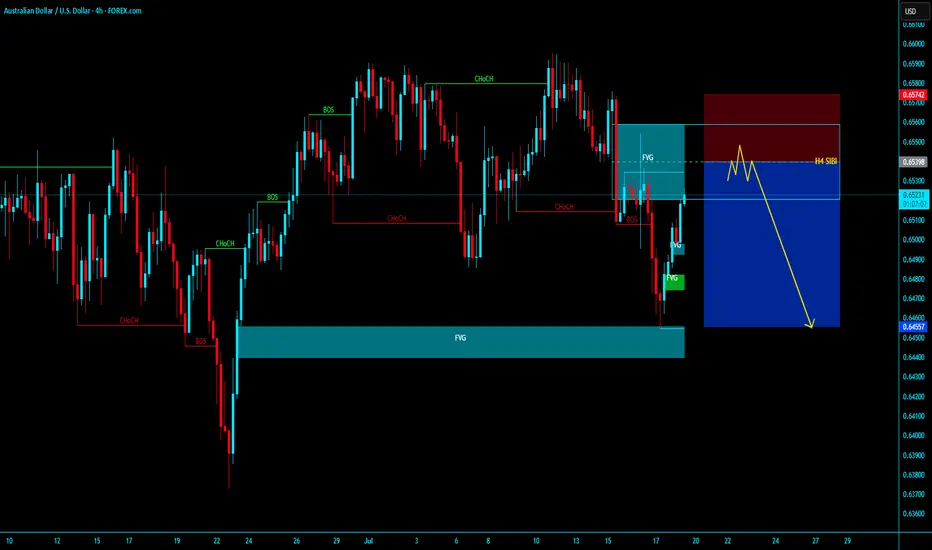
AUDUSD H4 SIBI HI , AUDUSD IS IN H4 SIBI , In LTF after Valid MSS with Valid OBI with Tight SL and Target . i think this trade is going to over night holding
KGB Priyabrat Behera
ICT TRADER & Advance Mapping SMC Trader
idea on a chartUD/USD stays mildly on the downside at this point. Fall from 0.6594 is tentatively seen as a correction to rise from 0.5913. Deeper fall would be seen to 38.2% retracement of 0.5913 to 0.6594 at 0.6334. Strong support could be seen there to bring rebound. For now, near term outlook is neutral as long as 0.6594 resistance holds, and more consolidations would be seen.

AUDUSD SELLAUD/USD dives to three-week lows near 0.6560 after weak Australian employment data
The Australian Dollar is one of the weakest performers of the G8 currencies on Thursday, hammered by a disappointing Australian Employment report and the overall risk-averse market, which is boosting demand for safe-haven assets, such as the US Dollar
The battle between the Australian Dollar (AUD) and the US Dollar (USD) will be one worth watching in 2025, with central banks stealing the limelight. The Reserve Bank of Australia (RBA) has kept interest rates at record highs whilst most of its overseas counterparts started the loosening process. The US Federal Reserve (Fed), on the other hand, has trimmed the benchmark interest rate by 100 bps through 2024 and aims to slow the pace of cuts in 2025. The central banks’ imbalance aims for record lows in AUD/USD
TP 1 0.650
TP 2 0.649
TP 3 0.648
RESISTANCE 0.653

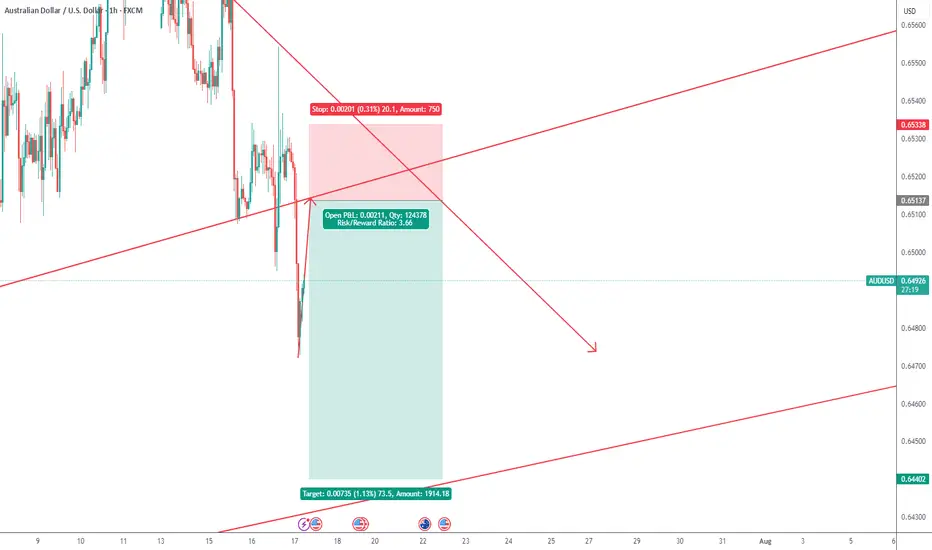
AUD USD long to close out the week? With the S&P pushing new highs, the VIX below 17 and recent dovish comments from WALLER. I feel the stage could be set for a positive end to the week. The WALLER comments having moved the needle towards USD weakness into the weekend.
I've left the JPY alone due to potentially strange movent ahead of weekend elections.
The trade is a 20 pip stop loss with a 25 pip profit target.
I've chosen the AUD to long because at the time of placing the trade, it's the currency that has momentum against the other currencies.
It sounds simple but the risk to the trade is USD strength.
If it's ongoing, I will close the trade before end of day to avoid weekend risk.
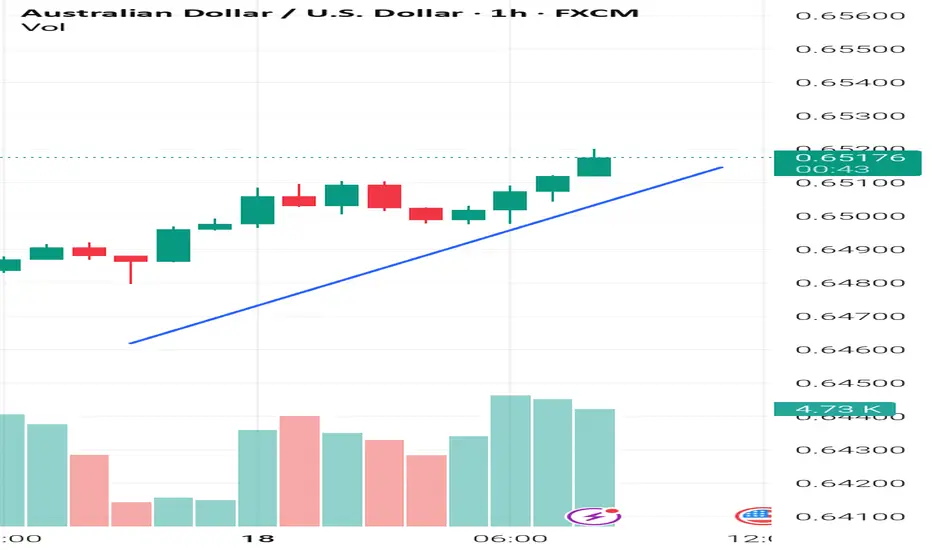
AUDUSD could fall again despite bullish momentumAUDUSD could fall again despite bullish momentum
AUDUSD found strong support near 0.6460.
Overnight the price rose despite the lack of any news on the economic calendar.
This could be related to the low volume of the current month and perhaps small currency injections or profit taking create such moves.
The price is not yet clear, but there is a high possibility of further decline in the coming days. It may show signs of reversal soon and could fall to 0.6460 and 0.6400.
You may find more details in the chart!
Thank you and Good Luck!
PS: Please support with a like or comment if you find this analysis useful for your trading day
Disclosure: I am part of Trade Nation's Influencer program and receive a monthly fee for using their TradingView charts in my analysis.
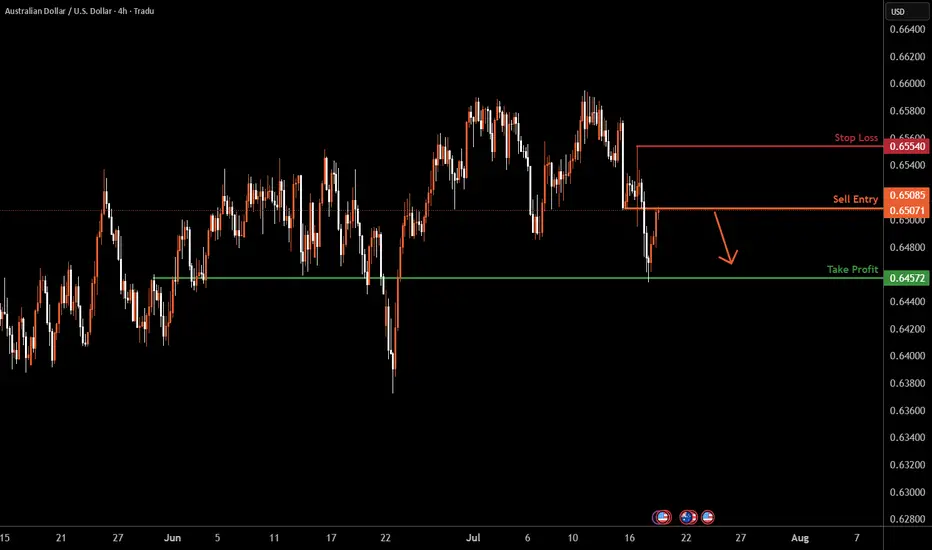
AUDUSD H4 I Falling from the pullback resistanceBased on the H4 chart, the price is testing our sell entry level at 0.6508, a pullback resistance.
Our take profit is set at 0.6457, an overlap support.
The stop loss is set at 0.6554, a swing high resistance.
High Risk Investment Warning
Trading Forex/CFDs on margin carries a high level of risk and may not be suitable for all investors. Leverage can work against you.
Stratos Markets Limited (tradu.com ):
CFDs are complex instruments and come with a high risk of losing money rapidly due to leverage. 66% of retail investor accounts lose money when trading CFDs with this provider. You should consider whether you understand how CFDs work and whether you can afford to take the high risk of losing your money.
Stratos Europe Ltd (tradu.com ):
CFDs are complex instruments and come with a high risk of losing money rapidly due to leverage. 66% of retail investor accounts lose money when trading CFDs with this provider. You should consider whether you understand how CFDs work and whether you can afford to take the high risk of losing your money.
Stratos Global LLC (tradu.com ):
Losses can exceed deposits.
Please be advised that the information presented on TradingView is provided to Tradu (‘Company’, ‘we’) by a third-party provider (‘TFA Global Pte Ltd’). Please be reminded that you are solely responsible for the trading decisions on your account. There is a very high degree of risk involved in trading. Any information and/or content is intended entirely for research, educational and informational purposes only and does not constitute investment or consultation advice or investment strategy. The information is not tailored to the investment needs of any specific person and therefore does not involve a consideration of any of the investment objectives, financial situation or needs of any viewer that may receive it. Kindly also note that past performance is not a reliable indicator of future results. Actual results may differ materially from those anticipated in forward-looking or past performance statements. We assume no liability as to the accuracy or completeness of any of the information and/or content provided herein and the Company cannot be held responsible for any omission, mistake nor for any loss or damage including without limitation to any loss of profit which may arise from reliance on any information supplied by TFA Global Pte Ltd.
The speaker(s) is neither an employee, agent nor representative of Tradu and is therefore acting independently. The opinions given are their own, constitute general market commentary, and do not constitute the opinion or advice of Tradu or any form of personal or investment advice. Tradu neither endorses nor guarantees offerings of third-party speakers, nor is Tradu responsible for the content, veracity or opinions of third-party speakers, presenters or participants.
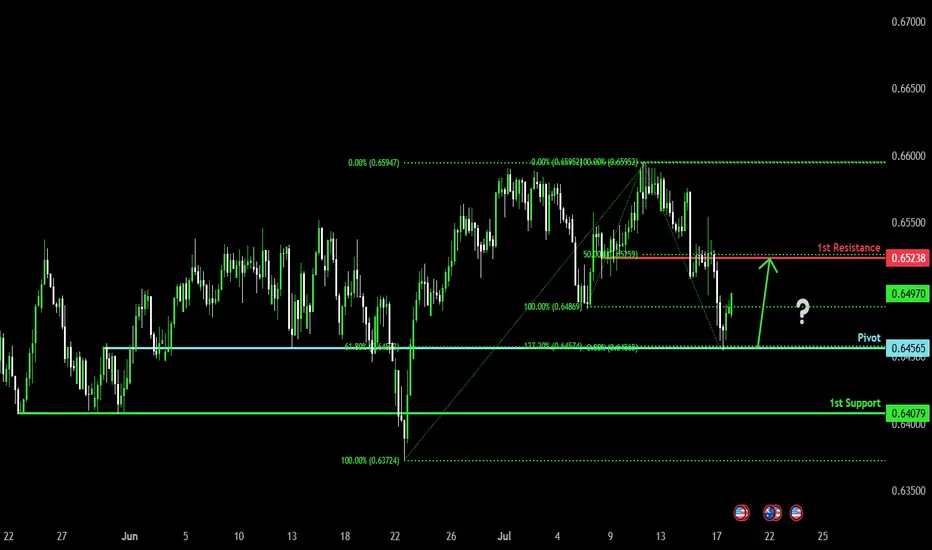
Bullish bounce?The Aussie (AUD/USD) has bounced off the pivot and could rise to the 1st resistance.
Pivot: 0.6456
1st Support: 0.6407
1st Resistance: 0.6523
Risk Warning:
Trading Forex and CFDs carries a high level of risk to your capital and you should only trade with money you can afford to lose. Trading Forex and CFDs may not be suitable for all investors, so please ensure that you fully understand the risks involved and seek independent advice if necessary.
Disclaimer:
The above opinions given constitute general market commentary, and do not constitute the opinion or advice of IC Markets or any form of personal or investment advice.
Any opinions, news, research, analyses, prices, other information, or links to third-party sites contained on this website are provided on an "as-is" basis, are intended only to be informative, is not an advice nor a recommendation, nor research, or a record of our trading prices, or an offer of, or solicitation for a transaction in any financial instrument and thus should not be treated as such. The information provided does not involve any specific investment objectives, financial situation and needs of any specific person who may receive it. Please be aware, that past performance is not a reliable indicator of future performance and/or results. Past Performance or Forward-looking scenarios based upon the reasonable beliefs of the third-party provider are not a guarantee of future performance. Actual results may differ materially from those anticipated in forward-looking or past performance statements. IC Markets makes no representation or warranty and assumes no liability as to the accuracy or completeness of the information provided, nor any loss arising from any investment based on a recommendation, forecast or any information supplied by any third-party.
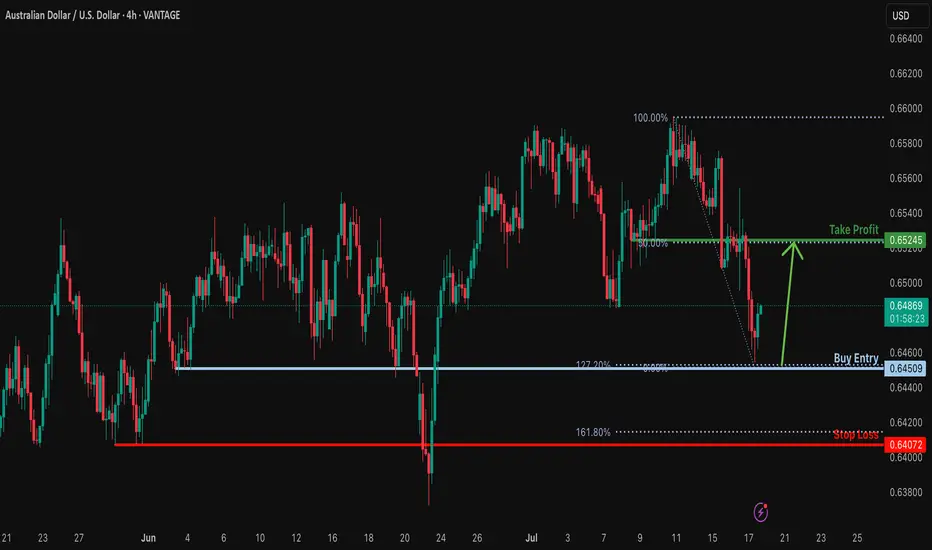
Bullish bounce off for the Aussie?The price has bounced off the support level which is a pullback support that aligns with the 127.2% Fibonacci extension and could potentially rise from this level to our take profit.
Entry: 0.6450
Why we like it:
There is a pullback support that aligns with the 127.2% Fibonacci extension.
Stop loss: 0.6407
Why we lik eit:
There is a pullback support that is slightly below the 161.8% Fibonacci extension.
Take profit: 0.6524
Why we like it:
There is an overlap resistance that lines up with the 50% Fibonacci retracement.
Enjoying your TradingView experience? Review us!
Please be advised that the information presented on TradingView is provided to Vantage (‘Vantage Global Limited’, ‘we’) by a third-party provider (‘Everest Fortune Group’). Please be reminded that you are solely responsible for the trading decisions on your account. There is a very high degree of risk involved in trading. Any information and/or content is intended entirely for research, educational and informational purposes only and does not constitute investment or consultation advice or investment strategy. The information is not tailored to the investment needs of any specific person and therefore does not involve a consideration of any of the investment objectives, financial situation or needs of any viewer that may receive it. Kindly also note that past performance is not a reliable indicator of future results. Actual results may differ materially from those anticipated in forward-looking or past performance statements. We assume no liability as to the accuracy or completeness of any of the information and/or content provided herein and the Company cannot be held responsible for any omission, mistake nor for any loss or damage including without limitation to any loss of profit which may arise from reliance on any information supplied by Everest Fortune Group.
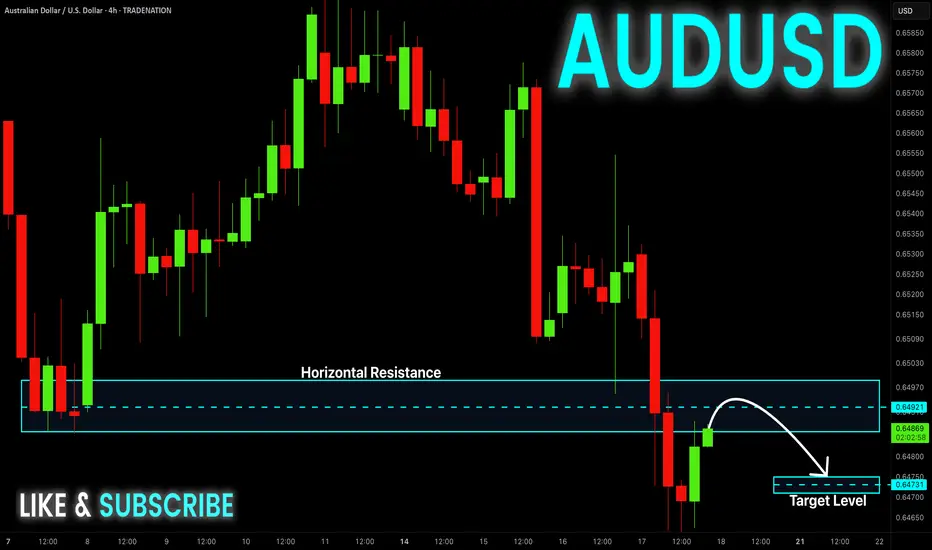
AUD-USD Local Short! Sell!
Hello,Traders!
AUD-JPY is making a bullish
Rebound and the pair is
Making a retest of the key
Horizontal resistance of 0.6497
From where we will be
Expecting a local bearish correction
Sell!
Comment and subscribe to help us grow!
Check out other forecasts below too!
Disclosure: I am part of Trade Nation's Influencer program and receive a monthly fee for using their TradingView charts in my analysis.
Part 1 Overview of Market Week 13-19 Thanks for tuning in guys, giving my knowledge to you guys free cause. AU,UJ,EU market overview mixing in a lot of fundamental confirmation.

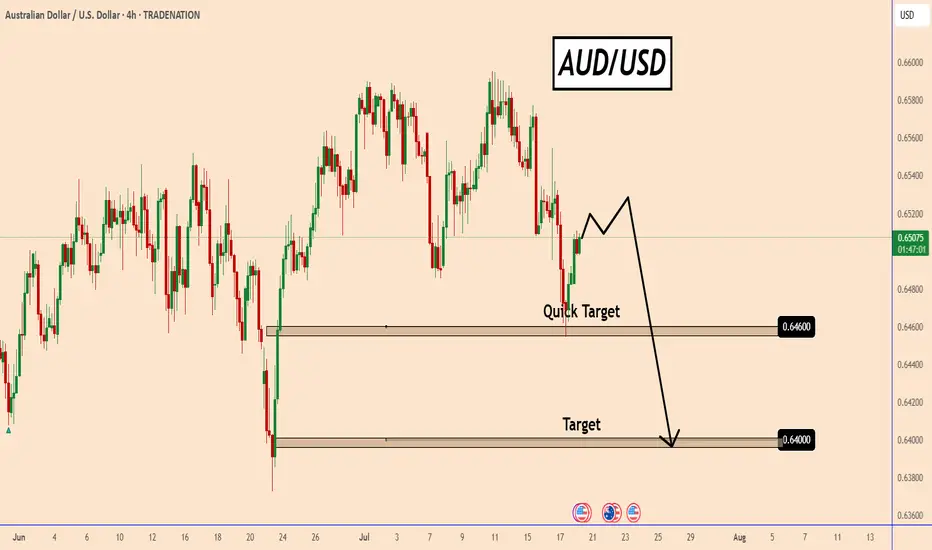
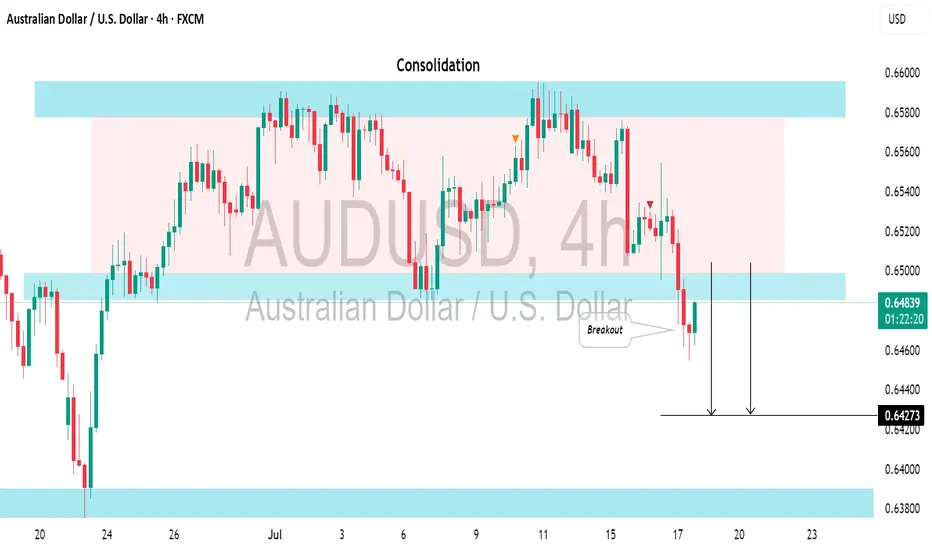
AUDUSD: Strong Bearish Signal?!The AUDUSD appears to be bearish following a few weeks of consolidation.
And a bearish breakout from the support of a sideways range serves as a strong confirmation signal.
We can anticipate a decline to at least the 0.6427 level.
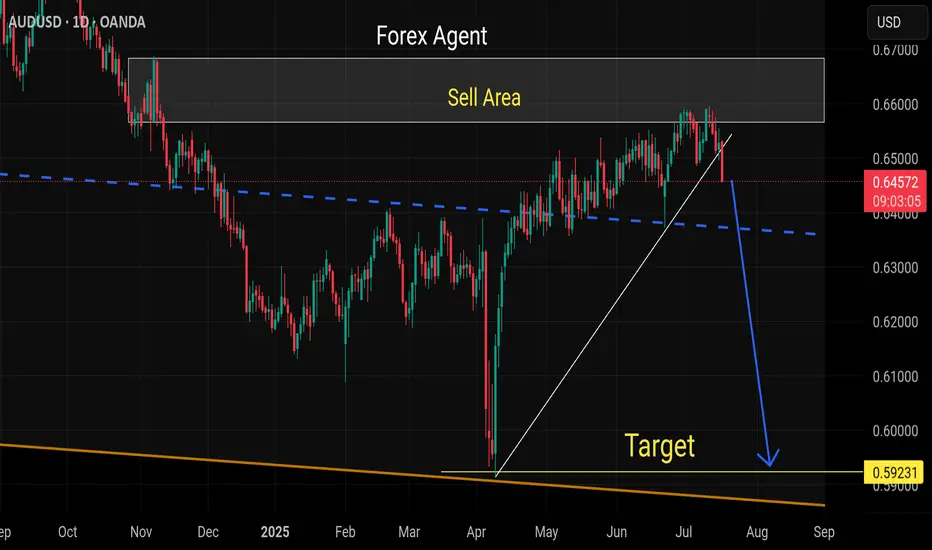
Audusd sellStrong selling expected long term
As usd gonna strong in all cross pairs
Daily weak buy trend breaks
Bearish correction start now
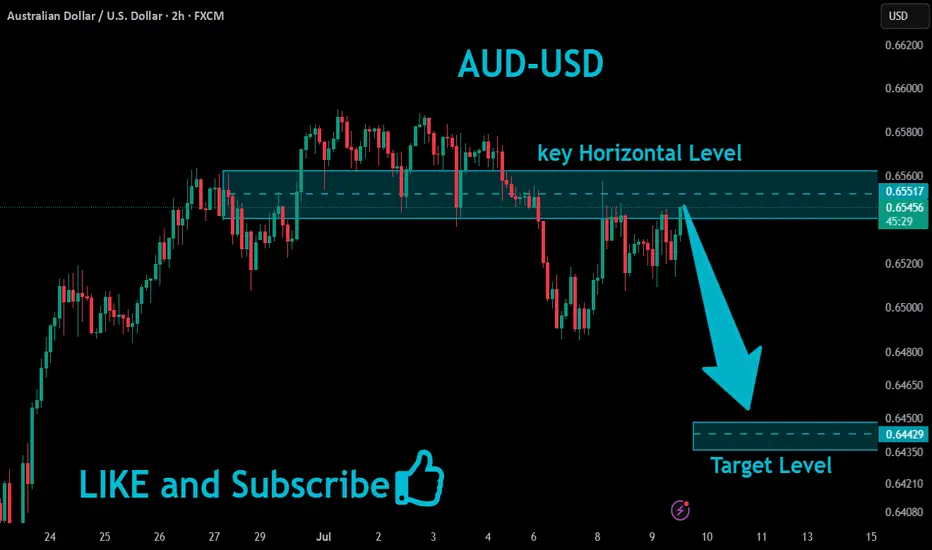
AUDUSD Bearish Breakout!
HI,Traders !
AUD-USD is trading in a sideways trend
and the pair
Made a breakout of the
Key horizontal level
Of 0.8149 which is now
A resistance and the pair
Is now making a retest
Of the level so as we are
Bearish biased we will
Be expecting a pullback
And a further bearish
Move down !
Comment and subscribe to help us grow !
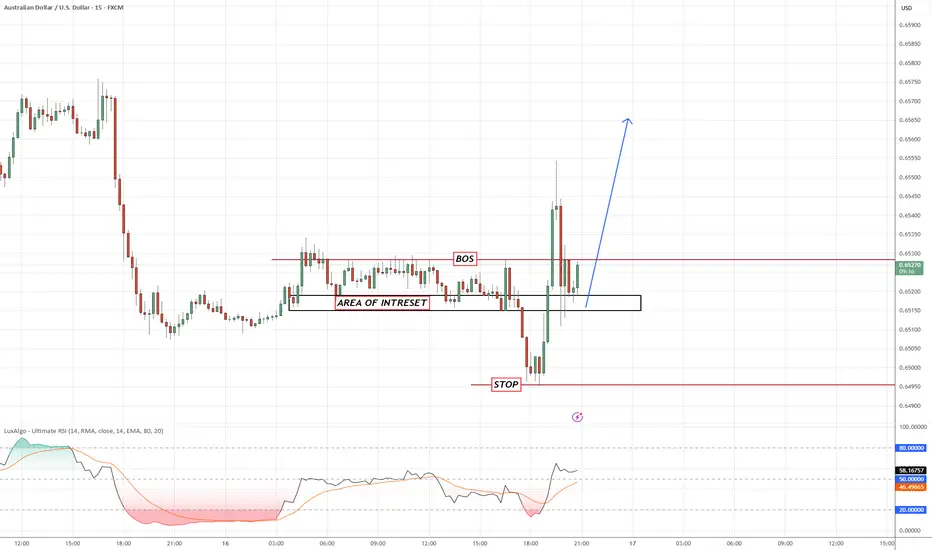
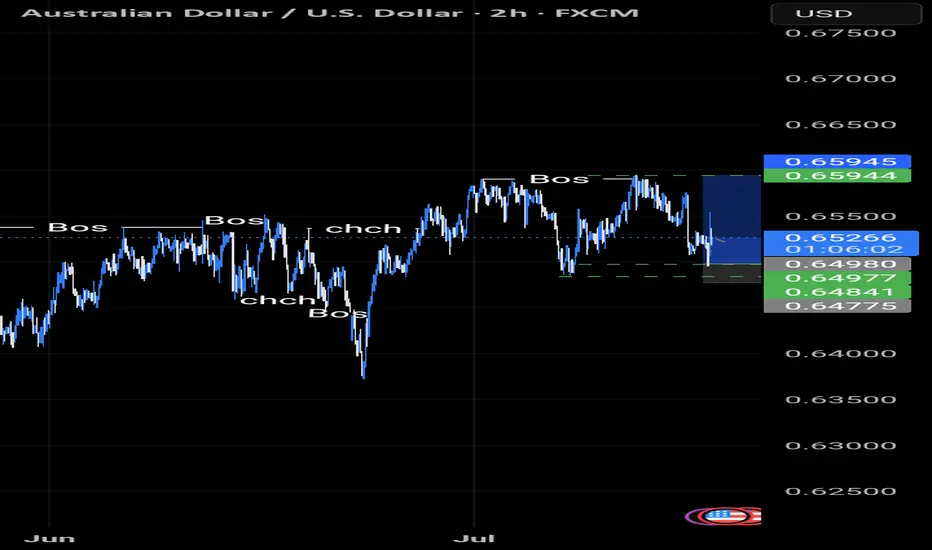
AUDUSDWe're looking at a clean Break of Structure (BoS) followed by a textbook retest of the Area of Interest near 0.6530.
Price respected the demand zone perfectly after stop-hunt liquidity sweep below 0.6500, then surged upward.
Now consolidating back inside the zone with bullish momentum building.
Expecting a push toward 0.6575+ if we get continuation confirmation. 🎯
🟩 Area of Interest: 0.6525–0.6535
🟥 Stop: Below 0.6490
🎯 Target: 0.6575 and beyond
🔎 Confirmation via lower timeframe bullish engulfing
AUDUSDA SELL opportunity on AUDUSD, a little bit of retracement before we have our sell to continue. the overall trend is sideways but within the band, we are favoring the downside more than the upside.
AUDUSD Forming Bullish MomentumAUDUSD is showing strong bullish momentum, and the current price structure confirms that the pair is gearing up for another potential rally. After building solid bullish pressure from key support zones, price has been making higher lows with clear buying interest stepping in on dips. I entered this setup earlier and am already in deep profit. With the momentum continuing to hold, I’m anticipating another wave to the upside in the coming sessions.
From a fundamental standpoint, the Australian dollar is currently benefiting from broad US dollar softness driven by expectations of a Fed rate cut later this year. As inflation cools in the US and the labor market shows signs of moderation, the Fed’s hawkish stance has softened, weakening the dollar across the board. At the same time, the Reserve Bank of Australia (RBA) has maintained a relatively firm tone, leaving the door open for further tightening if inflation pressures persist domestically. This divergence in central bank tone is favoring AUD strength.
Additionally, commodities like iron ore and copper—major Australian exports—have recently found renewed demand, particularly from China. With Chinese authorities signaling more fiscal and monetary stimulus to support their post-COVID recovery, the Australian economy stands to benefit, further supporting AUD upside. This commodity-backed strength adds another layer of support to the bullish AUDUSD narrative.
Technically, the pair has broken above a key resistance level and is now forming a bullish continuation pattern on the lower timeframes. Price action is supported by rising volume and moving averages starting to slope upward. The structure is clean, the fundamentals are supportive, and sentiment across TradingView shows increasing bullish interest in AUDUSD. I'm holding for higher levels as the bullish wave continues to develop.
SHORT AUDUSDwaiting for price to get to my poi and wait for mss to give an entry opportunity on lower tf to take out liquidity nd fvgs below

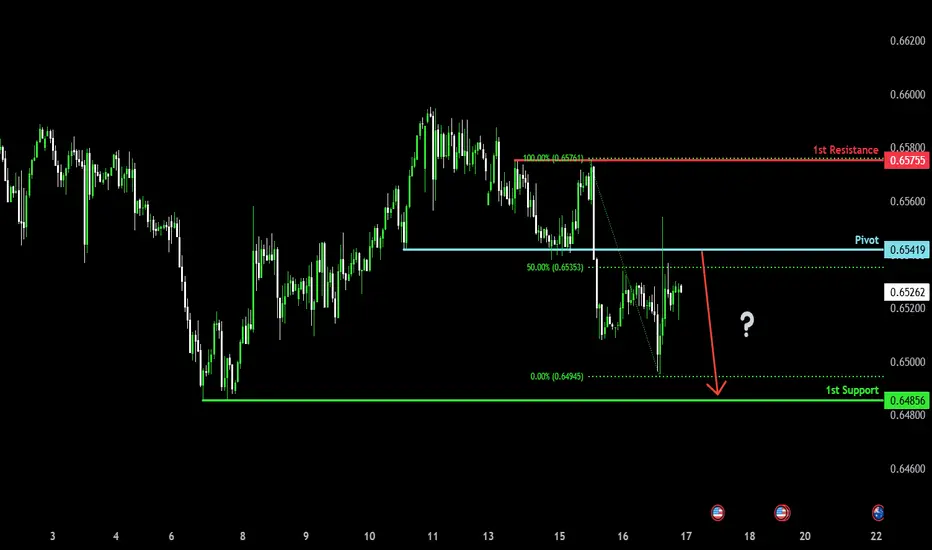
Bearish reversal?The Aussie (AUD/USD) is rising towards the pivot and could reverse to the 1st support.
Pivot: 0.6541
1st Support: 0.6485
1st Resistance: 0.6575
Risk Warning:
Trading Forex and CFDs carries a high level of risk to your capital and you should only trade with money you can afford to lose. Trading Forex and CFDs may not be suitable for all investors, so please ensure that you fully understand the risks involved and seek independent advice if necessary.
Disclaimer:
The above opinions given constitute general market commentary, and do not constitute the opinion or advice of IC Markets or any form of personal or investment advice.
Any opinions, news, research, analyses, prices, other information, or links to third-party sites contained on this website are provided on an "as-is" basis, are intended only to be informative, is not an advice nor a recommendation, nor research, or a record of our trading prices, or an offer of, or solicitation for a transaction in any financial instrument and thus should not be treated as such. The information provided does not involve any specific investment objectives, financial situation and needs of any specific person who may receive it. Please be aware, that past performance is not a reliable indicator of future performance and/or results. Past Performance or Forward-looking scenarios based upon the reasonable beliefs of the third-party provider are not a guarantee of future performance. Actual results may differ materially from those anticipated in forward-looking or past performance statements. IC Markets makes no representation or warranty and assumes no liability as to the accuracy or completeness of the information provided, nor any loss arising from any investment based on a recommendation, forecast or any information supplied by any third-party.
AUDUSD TRADE We had a full pullback to our Fibonacci level for a continuation trade to the upside on AUDUSD.
Let's see how the market unfolds and how it does it's thing.
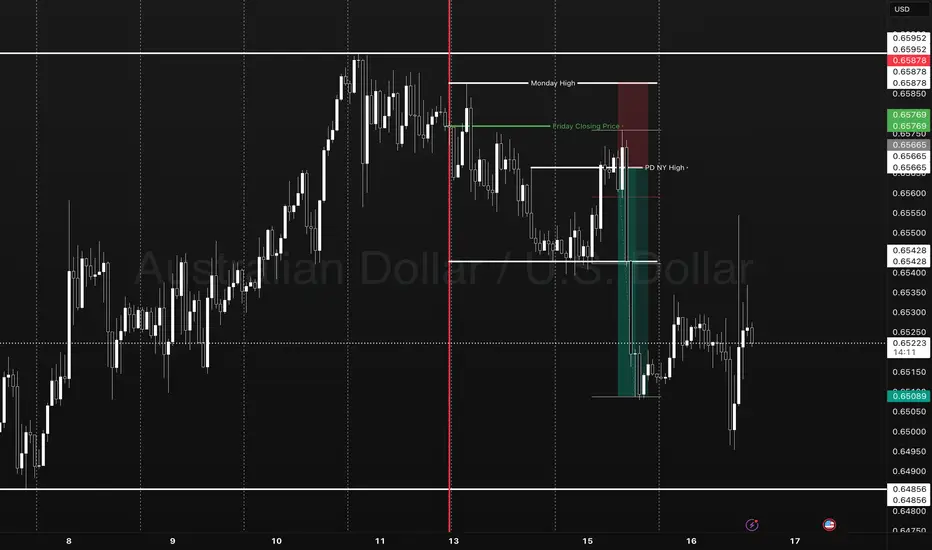
The only key levels you need - DITCH THE INDICATORS- Previous day high/Low
- Weekly high/low
- Session high/low
- Closing Price
In this specific example on OANDA:AUDUSD we have a day 3 Tuesday breakout fail reversal setup on the backside of a previous weeks expansion.
Fridays closing price was plotted going into Monday day 2 on the backside of a new week. Once the initial high low was set on day 2 below the previous weeks high and closing price we than look for short opportunities going into day 3 Tuesday.
In this case day 2 Ny session high acted as the reversal point staying below Friday closing price below the high of the previous week. The Asia/London session printed a beautiful high/low range reversing at near the midpoint of the previous days range (50% retrace.)
A great opportunity for a projected range expansion presented with confluence at a previous days low giving a solid set and forget trade with little to no stress or heat. This parabolic opportunity took place in the NY session below Fridays closing price to a previous weeks LOD level.
- Mondays High (Stop)
- NY session High, Fridays Close (Entry)
- Wed Low, Range expansion (Target)
KEY NOTES:
It is very important to keep your trading simple. As a newer trader I filled my chart with as many indicators as possible trying to find a "signal" because I lacked the patience for the market to give me a setup over multiple days. Now as a more experienced trader I sit back on higher time frames (1H/15M) TO WAIT FOR THE DAILY LEVELS TO PRINT. Avoiding trading inside a range on a low time frame. Lower time frames are only to decrease risk and increase position accuracy already derived from higher time frames. It is key to understand when higher time frame traders are triggered into a market and to understand there are only two main plays from key levels. Keep it simple, find the scalable setups, AND PUT THE SIZE ON WITH CONFIDENCE.
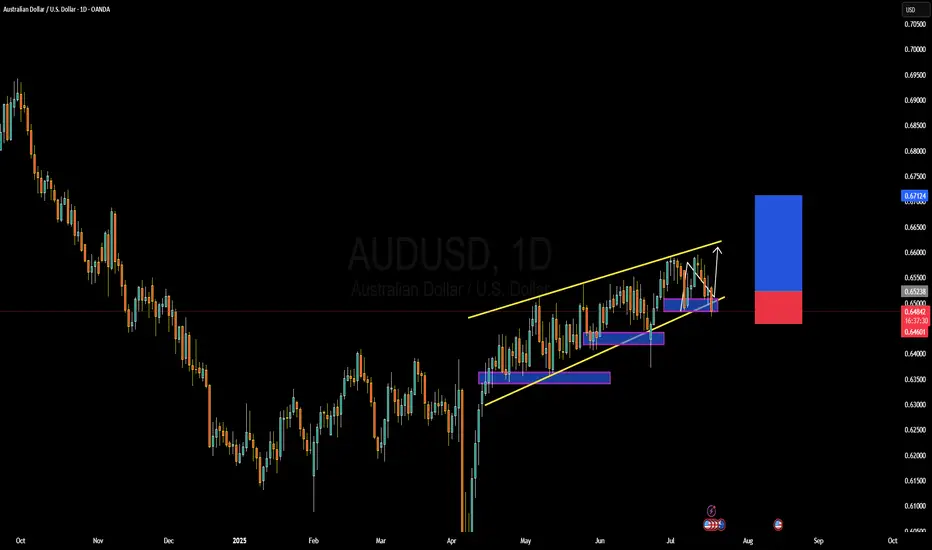
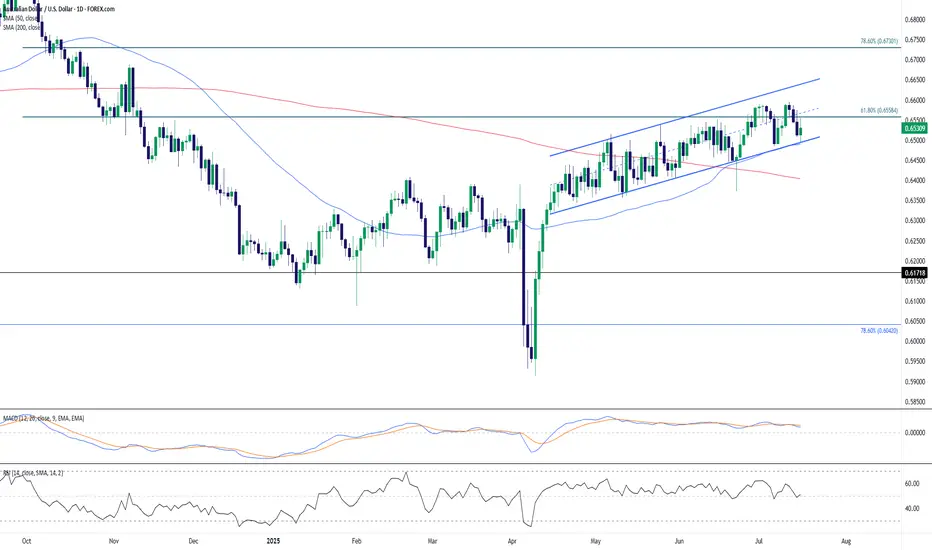
AUD/USD Technical Outlook: Rising Channel Faces Resistance Near The Australian Dollar remains in an upward-sloping channel against the U.S. Dollar on the daily timeframe. Price action has recently bounced from channel support near 0.6500, a key psychological and technical level, and is attempting to regain traction within the structure.
The 61.8% Fibonacci retracement of the July 2023 – April 2024 decline at 0.6558 is currently acting as resistance, coinciding with the upper half of the rising channel. A break above this could see momentum extend toward the 78.6% retracement zone near 0.6730.
The 50-day SMA is crossing above the 200-day SMA, forming a golden cross—typically a bullish continuation signal—though price is slightly below both moving averages, implying short-term indecision.
From an indicator perspective:
RSI hovers around 50, showing a neutral bias and confirming the consolidation phase.
MACD is flat and converging near the zero line, signaling weakening momentum and a possible pause or reversal.
A daily close below channel support could expose the 0.6450–0.6400 zone next, while sustained strength above 0.6558 could re-ignite bullish interest targeting the 0.6700–0.6730 region.
Overall, AUD/USD remains technically constructive as long as the channel holds, but traders should watch closely for a breakout or breakdown confirmation from current levels.
-MW
Australian job numbers and AUDWe are keeping a close eye on the Australian job numbers tonight. If you are trading AUD, then that's the data to watch. Let's dig in.
FX_IDC:AUDUSD
FX_IDC:AUDJPY
FX_IDC:AUDNZD
Let us know what you think in the comments below.
Thank you.
75.2% of retail investor accounts lose money when trading CFDs with this provider. You should consider whether you understand how CFDs work and whether you can afford to take the high risk of losing your money. Past performance is not necessarily indicative of future results. The value of investments may fall as well as rise and the investor may not get back the amount initially invested. This content is not intended for nor applicable to residents of the UK. Cryptocurrency CFDs and spread bets are restricted in the UK for all retail clients.
