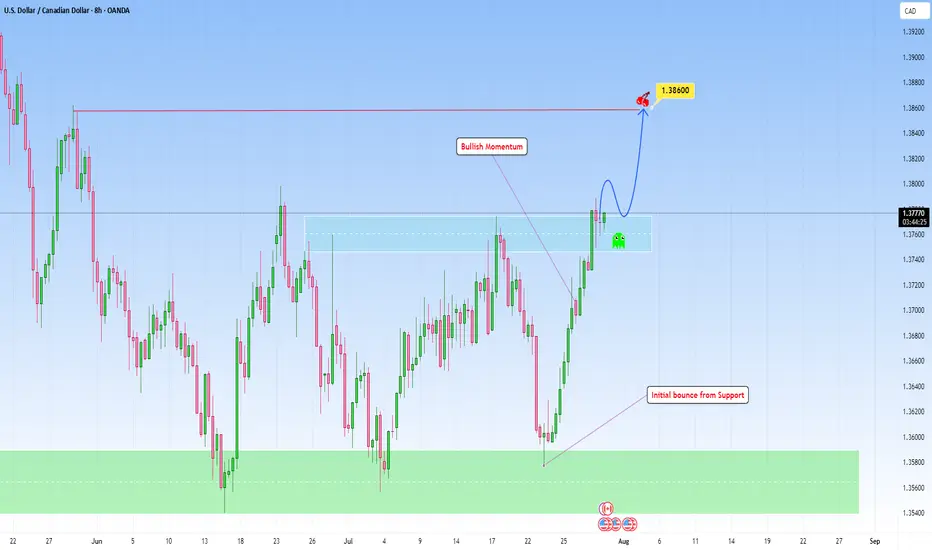
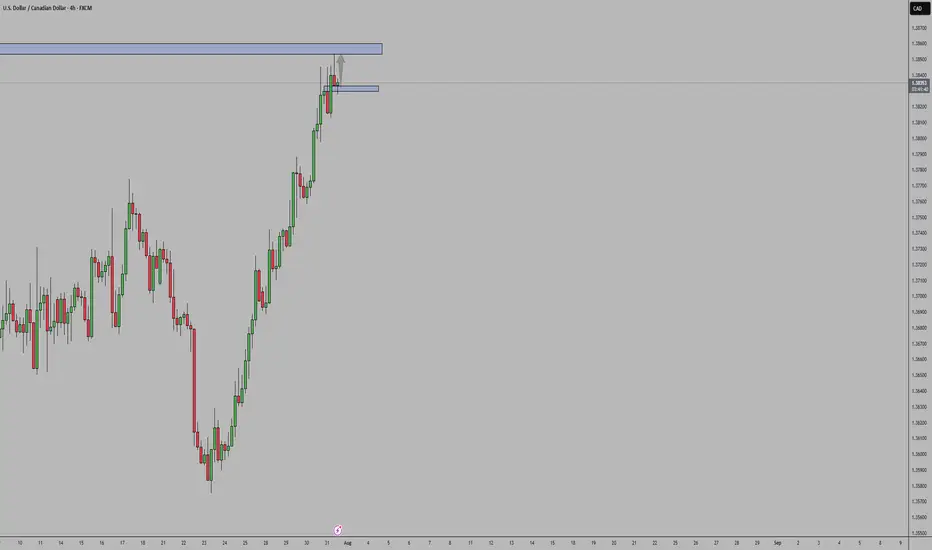
USDCAD bounced from Support and can continue higherLooking at the chart and the overall structure, I think we can favor the continuation setup with a emphasis on price action at key zones, particularly when price breaks out then can revisit this structure for a retest.
This bounce off support has been accomplished in my previous analysis:
Here, if price breaks with strength and dips back into the area and holds with bullish confirmation (likely a wick rejection or bullish engulfing on lower timeframes), that would be the cue to get in.
I am projecting the next target to 1.38600 that makes sense as a logical level for trend continuation and that I find achievable.
USDCAD trade ideas
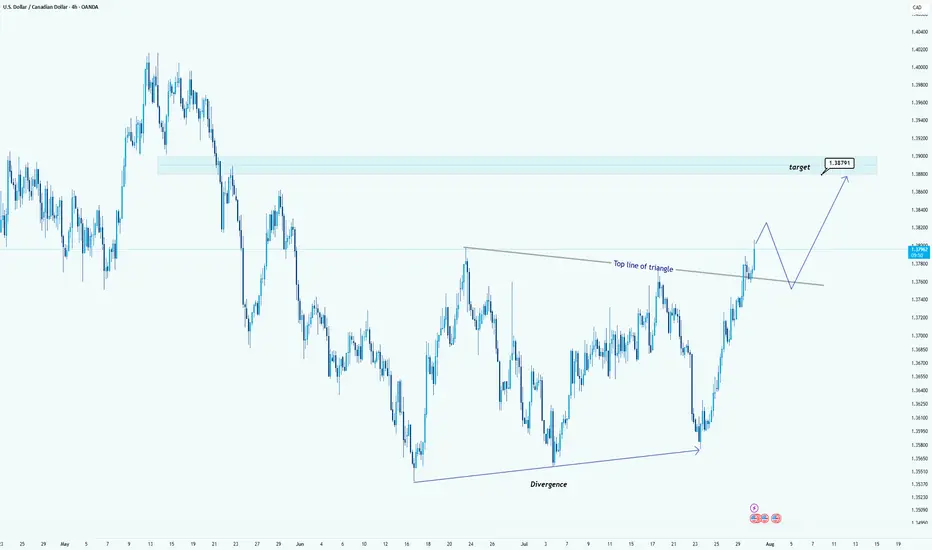
USD/CAD Breaks Triangle: Bullish Target in SightHello guys!
USD/CAD has broken out of a clear triangle formation, signaling strong bullish momentum. The breakout above the top line of the triangle, supported by earlier bullish divergence, confirms that buyers are now in control.
Triangle breakout confirmed
Strong bullish impulse post-breakout
Retest of the broken trendline expected
Target: 1.38791
A clean retest of the breakout level could provide another entry opportunity before price reaches the target zone highlighted in blue.
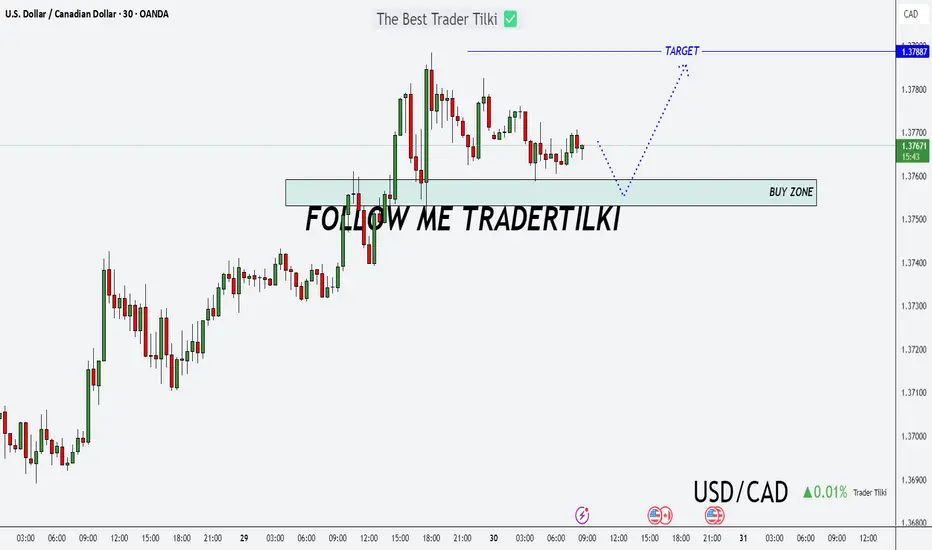
A New Day, A New Opportunity: USDCAD Buy StrategyGood morning Traders,
USDCAD has reached a key support zone between 1.37531 and 1.37592.
I'm opening a buy position from this level, aiming for the 1.37887 target.
Feel free to adjust your stop-loss based on your own margin and risk tolerance.
Your likes are my biggest source of motivation when sharing analysis. Thanks to everyone who supports with a simple like!
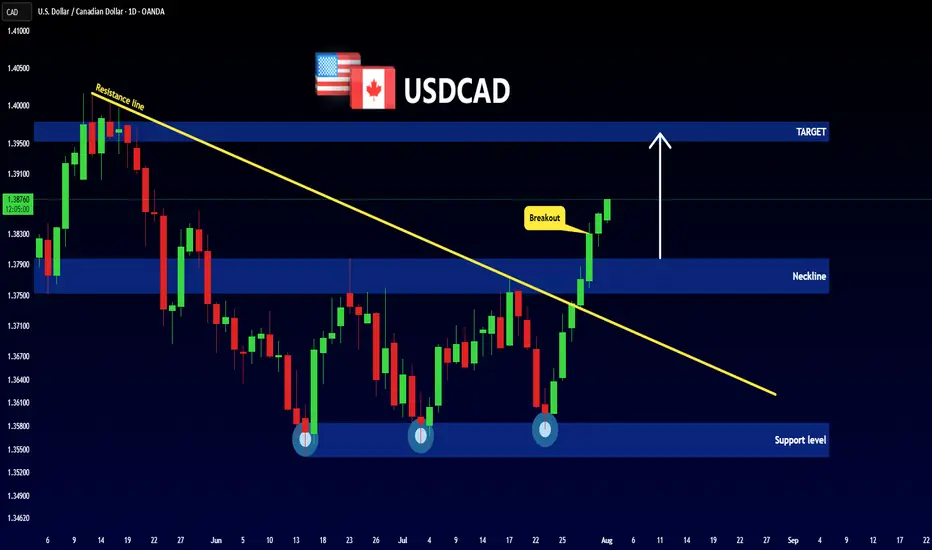
USDCAD - Bullish Triple BottomHello Traders !
The USDCAD price formed a triple bottom pattern.
Currently, The neckline is broken!
So, I expect a bullish move🚀
________________
TARGET: 1.39530🎯
USDCAD: a long positionHello guys.
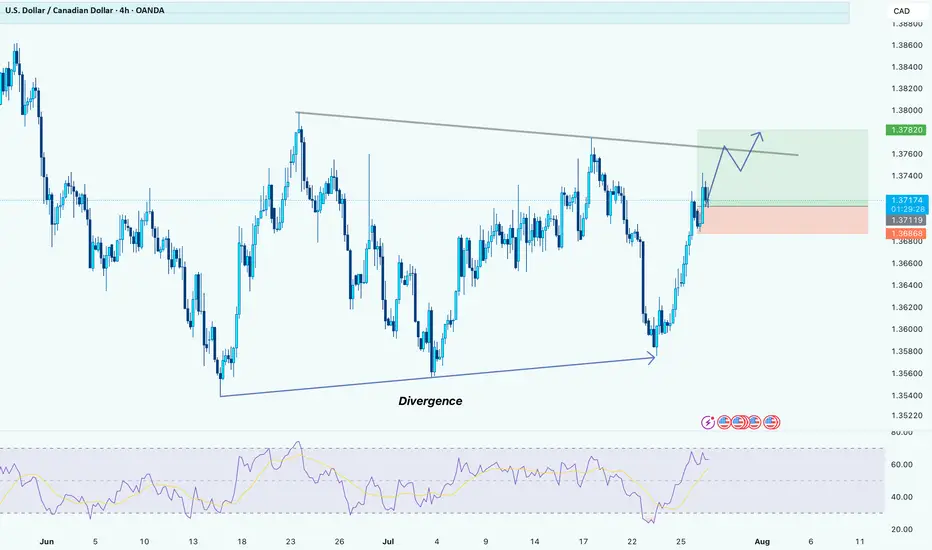
Divergence:
A bullish RSI divergence is noted, price made lower lows while RSI formed higher lows, signaling a potential bullish reversal.
Price Action:
Price has bounced strongly from around the 1.3570–1.3580 zone and is now approaching a descending trendline resistance.
Trade Setup:
Entry: 1.3718
Stop Loss: Below the breakout candle, near 1.3686
Take Profit: Around 1.3782
Risk-to-Reward: 1:3
USDCAD: Strong Bearish Signal?!The 📈USDCAD pair appears to be bullish following more than a month of consolidation.
The bullish breakout from a sideways range support serves as a strong confirmation signal.
Indicating an expected upward movement towards at least the 1.3950 support level.

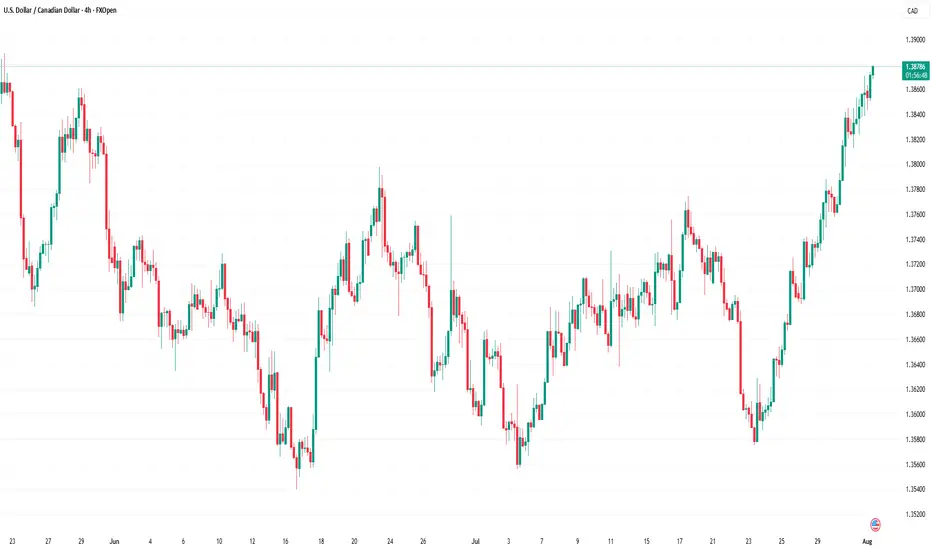
USD/CAD Rises to 2-Month HighUSD/CAD Rises to 2-Month High
Today, the USD/CAD exchange rate briefly exceeded the 1.3870 mark – the highest level seen this summer. In less than ten days, the US dollar has strengthened by over 2% against the Canadian dollar.
Why Is USD/CAD Rising?
Given that both the Federal Reserve and the Bank of Canada left interest rates unchanged on Wednesday (as expected), the primary driver behind the pair’s recent rally appears to be US President Donald Trump's decision to impose tariffs on several countries – including Canada:
→ Despite efforts by Prime Minister of Canada Mark Carney to reach an agreement with Trump, no deal was achieved;
→ Canadian goods exported to the US will now be subject to a 35% tariff;
→ The tariffs take effect from 1 August;
→ Goods compliant with the United States-Mexico-Canada Agreement (USMCA) are exempt.
Media analysts note that the tariffs are likely to increase pressure on the Canadian economy, as approximately 75% of the country's exports are destined for the United States.
USD/CAD Technical Analysis
At the end of July, the price formed a steep ascending channel (A-B), with bullish momentum confirmed by a decisive breakout above the 1.3790 resistance level, as illustrated by the arrow:
→ the pullback before the breakout was relatively shallow;
→ the bullish breakout was marked by a long bullish candlestick with a close near the session high;
→ following the breakout, the price confidently consolidated above 1.3790.
Provided that the fundamental backdrop does not undergo a major shift, bulls might attempt to maintain control in the market. However, the likelihood of a correction is also increasing, as the RSI indicator has entered extreme overbought territory.
Should USD/CAD show signs of a correction after its steep ascent, support might be found at:
→ line C, drawn parallel to the A-B channel at a distance of its width;
→ the previously mentioned 1.3790 level, which now acts as a support following the breakout.
This article represents the opinion of the Companies operating under the FXOpen brand only. It is not to be construed as an offer, solicitation, or recommendation with respect to products and services provided by the Companies operating under the FXOpen brand, nor is it to be considered financial advice.
Will the Canada-US Trade Tension Continue to Impair CAD?Fundamental approach:
- USDCAD advanced this week, supported by broad US dollar strength and renewed trade tensions as the US announced higher tariffs on Canadian imports.
- The pair was further buoyed after the BoC left rates unchanged and signaled caution amid persistent core inflation and ongoing trade negotiations.
- Meanwhile, US labor data indicated that job openings were moderating growth while tariff-related uncertainty weighed on risk sentiment.
- The BoC’s decision to keep its policy rate at 2.75% cited domestic economic resilience and the unpredictable US trade policy outlook.
- At the same time, negotiations between Canada and the US over trade terms remained in an “intense” phase, with additional tariffs entering effect 1 Aug, adding to downside risks for the Canadian economy.
- USDCAD may remain elevated next week as markets monitor follow-through from new tariffs and assess further data on US jobs and Canadian trade. Potential progress or setbacks in Canada-US trade talks and upcoming economic releases could influence direction, while central bank policy signals and risk appetite will remain key catalysts.
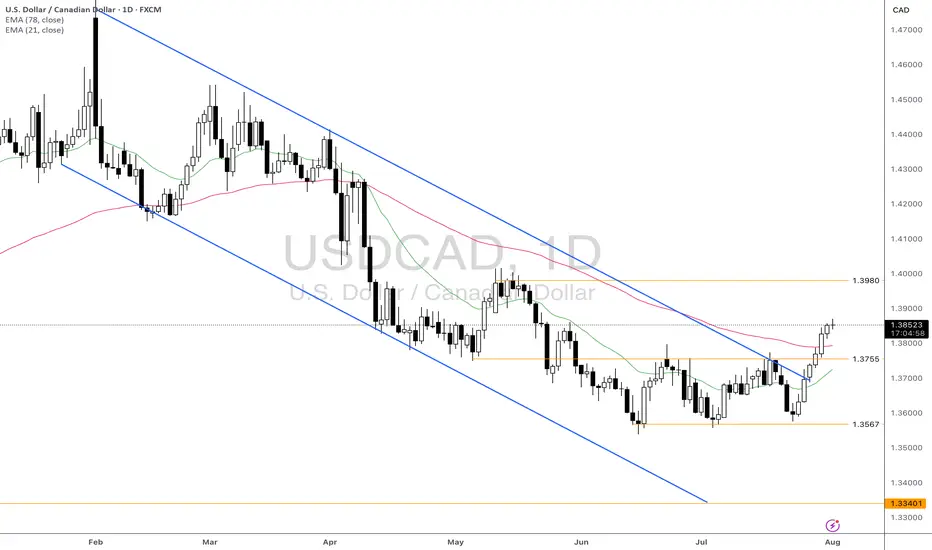
Technical approach:
- USDCAD formed a Triple-bottom pattern at around 1.3567 and bounced up to break the neckline at 1.3755. The price also broke the descending trendline and closed higher than both EMAs, indicating a potential trend reversal.
- If USDCAD remains above the support at 1.3755 and both EMAs, the price may retest the resistance at 1.3980.
- On the contrary, closing below the support at 1.3755 and both EMAs may lead USDCAD to retest the key support at 1.3567.
Analysis by: Dat Tong, Senior Financial Markets Strategist at Exness
USDCADPossible Short, head and shoulder with target matching with fibo levels, i can see down channels

USD/CAD – Possible Pullback on the RadarThis pair is forming a potential pullback setup that we’re keeping a close eye on.
The support zone is decent, but not ideal — which means we’ll need to see extra confirmation from both volume and momentum before considering a trade.
As always, every part of the VMS strategy must align before we take action. Until then, it stays on the watchlist.
Discipline over impulse. Patience over prediction.

USDCAD BUY OPPORTUNITY Price is looking quite interesting for a buy opportunity from the current market price. We can see how price recently rebounded from the dynamic resistance and support trendline. It’s signaling a possible buy opportunity.

USDCAD Will Go Down! Short!
Take a look at our analysis for USDCAD.
Time Frame: 1D
Current Trend: Bearish
Sentiment: Overbought (based on 7-period RSI)
Forecast: Bearish
The price is testing a key resistance 1.378.
Taking into consideration the current market trend & overbought RSI, chances will be high to see a bearish movement to the downside at least to 1.362 level.
P.S
The term oversold refers to a condition where an asset has traded lower in price and has the potential for a price bounce.
Overbought refers to market scenarios where the instrument is traded considerably higher than its fair value. Overvaluation is caused by market sentiments when there is positive news.
Disclosure: I am part of Trade Nation's Influencer program and receive a monthly fee for using their TradingView charts in my analysis.
Like and subscribe and comment my ideas if you enjoy them!

Strong buy usdcadOur last buying idea already running 200+ pips
More bullish correction expected
Daily down trend breaks
Respecting fresh support level
800+ pips minimum target

Market Insights with Gary Thomson: 4 - 8 AugustMarket Insights with Gary Thomson: BoE Interest Rate, Canada Jobs Data & Earnings Reports
In this video, we’ll explore the key economic events, market trends, and corporate news shaping the financial landscape. Get ready for expert insights into forex, commodities, and stocks to help you navigate the week ahead. Let’s dive in!
In this episode of Market Insights, Gary Thomson unpacks the strategic implications of the week’s most critical events driving global markets.
👉 Key topics covered in this episode:
— BoE Interest Rate Decision
— Unemployment Rate in Canada
— Corporate Earnings Statements
— Trade Tensions
Gain insights to strengthen your trading knowledge.
This video represents the opinion of the Companies operating under the FXOpen brand only. It is not to be construed as an offer, solicitation, or recommendation with respect to products and services provided by the Companies operating under the FXOpen brand, nor is it to be considered financial advice.

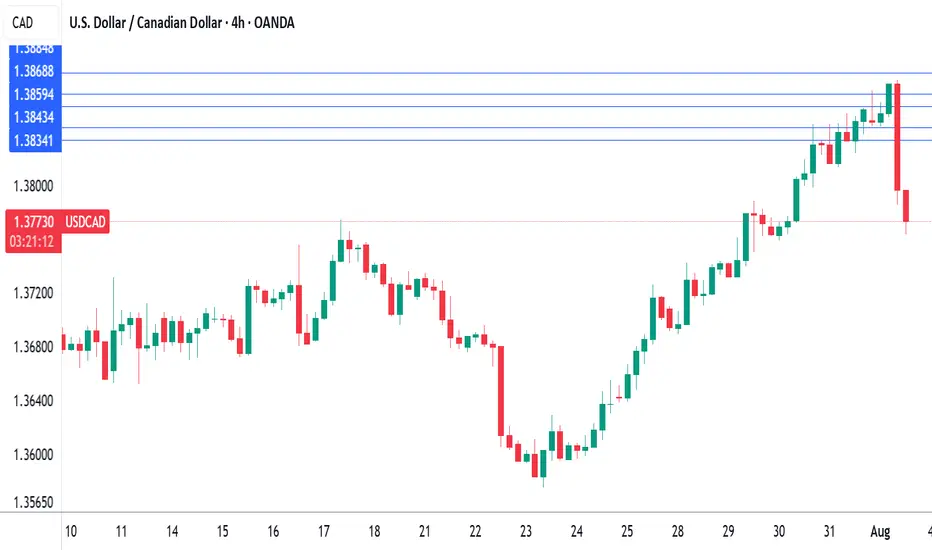
Bearish reversal off multi swing high resistance?USD/CAD is reacting off the resistance level, which is a multi-swing high resistance and could drop from this level to our take profit.
Entry: 1.3782
Why we like it:
There is a multi-swing high resistance.
Stop loss: 1.3855
Why we like it:
There is a swing high resistance that lines up with the 138.2% Fibonacci extension.
Take profit: 1.3702
Why we like it:
There is a pullback support that aligns with the 48.2% Fibonacci retracement.
Enjoying your TradingView experience? Review us!
TradingView (tradingview.sweetlogin.com)
Please be advised that the information presented on TradingView is provided to Vantage (‘Vantage Global Limited’, ‘we’) by a third-party provider (‘Everest Fortune Group’). Please be reminded that you are solely responsible for the trading decisions on your account. There is a very high degree of risk involved in trading. Any information and/or content is intended entirely for research, educational and informational purposes only and does not constitute investment or consultation advice or investment strategy. The information is not tailored to the investment needs of any specific person and therefore does not involve a consideration of any of the investment objectives, financial situation or needs of any viewer that may receive it. Kindly also note that past performance is not a reliable indicator of future results. Actual results may differ materially from those anticipated in forward-looking or past performance statements. We assume no liability as to the accuracy or completeness of any of the information and/or content provided herein and the Company cannot be held responsible for any omission, mistake nor for any loss or damage including without limitation to any loss of profit which may arise from reliance on any information supplied by Everest Fortune Group.

USDCADSupport Zone: Price has retested a strong support area
Price Action: The retest held — buyers defended it, showing rejection wicks / bullish candles.
Bias: Bullish while support holds → look for continuation to next resistance.
Invalidation: Bias weakens if support breaks and closes below the zone.
So as long as price stays above the retested support, USD/CAD remains bullish.
USD/CAD Daily - Triple Bottom Breakout PatternUSD/CAD Daily – Triple Bottom Breakout
The USD/CAD pair on the 1D chart has formed a Triple Bottom pattern, a classic bullish reversal setup after a downtrend. This pattern suggests that sellers were unable to push the price below the established support zone on three separate occasions, signaling strong buying interest.
🔍 Chart Highlights:
Three distinct lows at a consistent support level
Strong bounce after each test of support, confirming bullish defense
Neckline (resistance line) successfully broken, indicating a breakout
Price target projected from the height of the pattern added to the breakout level
📈 Pattern: Triple Bottom
📍 Breakout Level (Neckline): Around 1.37800
🎯 Target: Approx. 1.42000
🛑 Invalidation: A daily close back below the neckline
This breakout may indicate the beginning of a bullish trend continuation, with momentum favoring the bulls as long as price holds above the neckline.

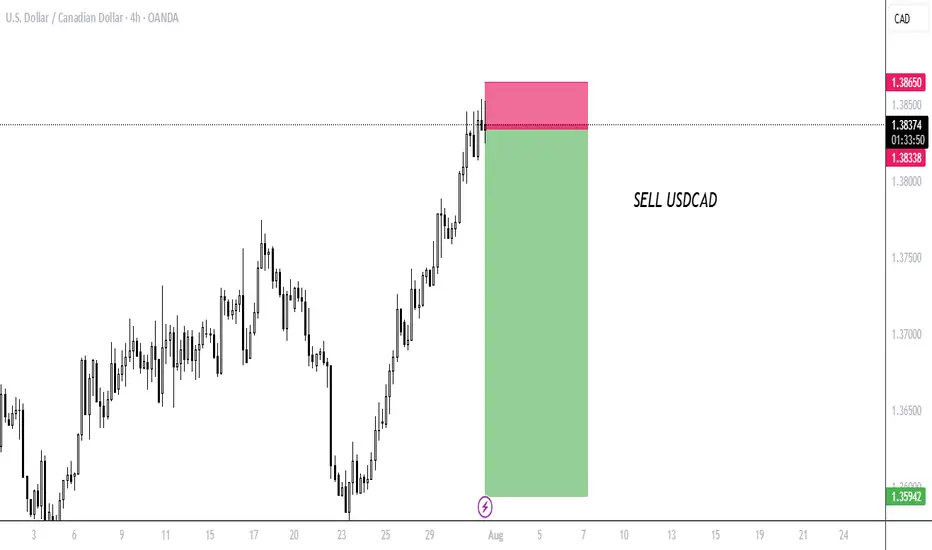
SELL USDCADIf you know familiar with Wyckoff and HS chart patterns ? you should see my reasons for selling USD CAD.Am selling USD CAD
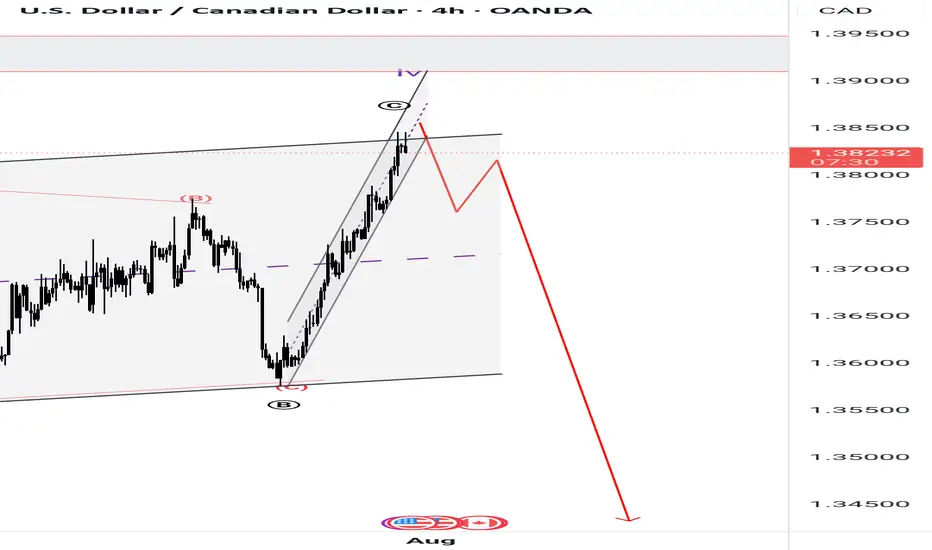
Potential BEARSAfter a prolonged and a complex correction, it looks out to be a FLAT CORRECTION with wave B producing a flat correction as well in a lower degree hence making it all complex. But at the moment we have a perfect channel AB=CD correction which prompts a continuation to the south. Fingers crossed 🤞 as the market rejects a resistance of the channel.
Canada's GDP contracts, US nonfarm payrolls misses forecastThe Canadian dollar continues to lose ground against its US counterpart and is trading at two-month lows. In the European session, the Canadian dollar is trading at 1.3875, down 0.13% on the day. USD/CAD has risen for six straight days, climbing 1.9% during that time.
US nonfarm payrolls for July were softer than expected at 73 thousand, compared to the forecast of 110 thousand. The June report was revised sharply downwards to 14 thousand from an initial 147 thousand.
Canada's GDP posted a small decline of 0.1% m/m in May, matching the market estimate. This followed an identical reading in April, as the economy is essentially treading water. A drop in retail trade was a significant factor in the weak GDP reading, particularly in motor vehicles and parts.
The decline in GDP in April and May can be squarely blamed on the trade war with the US, which has put a chill in economic activity. The markets are expecting a slight improvement in June, with an estimate of a 0.1% gain.
The Bank of Canada held the benchmark rate at 2.75% on Thursday for a third consecutive meeting. The rate statement noted that US trade policy remains "unpredictable" and Governor Macklem reiterated this at his press conference, saying that "some level of uncertainty will continue" until the US and Canada reach a trade agreement.
Meanwhile, the trade war between the two sides is heating up. President Trump announced on Thursday that the US was slapping 35% tariffs on Canadian products, effective Aug. 1. The new tariff will not apply to goods covered under the US-Mexico-Canada Agreement.
Canada's Prime Minister Mark Carney said he was "disappointed" with the US decision and vowed that "Canadians will be our own best customer". These are brave words, but Carney will be under pressure to reach a deal with the US, as 75% of Canadian exports are shipped to the US and Canada can ill-afford a protracted trade war with its giant southern neighbor.
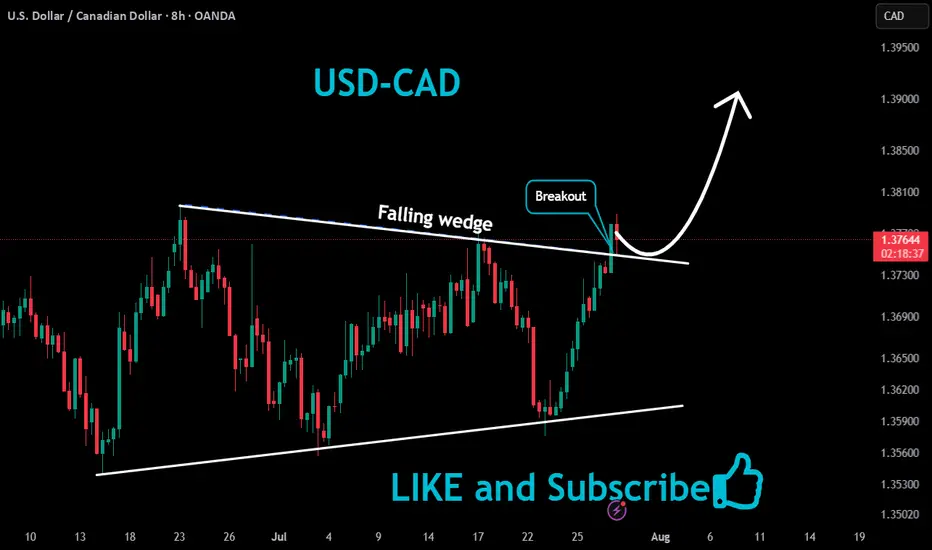
USDCAD Bullish Breakout!
HI,Traders !
#USDCAD was trading in a
Falling wedge pattern
But now we are seeing a
Bullish breakout so we
Will be expecting a
Further bullish move up !
Comment and subscribe to help us grow !
USD/CAD Ascending Triangle Breakout, Support at Prior ResistanceWhile USD/CAD was one of the cleaner pairs for USD-weakness in Q2, the past month and change has seen a shifting backdrop in the pair.
The 1.3750 level remains key and this was the price that set the low in early-May, leading to a rally up to 1.4000, which sellers defended well. That drove another fresh low but bears suddenly got shy above the 1.3500 level, leading to a pullback in June.
Since then - there's been a build of higher-lows with the trendline produced by the June and early-July swing low bringing another support inflection two weeks ago. And then the rally from that finally led to a break of the ascending triangle formation which had built with resistance at 1.3750.
Now that the USD is pulling back, so too is USD/CAD, and interestingly, this could be one of the more attractive venues for looking at USD-strength continuation scenarios given that recent bullish structure. - js

USD/CAD Poised for a Bullish Breakout: All Eyes on 1.41
ه
---
🚀 **
The BAT formation is checking every box—whether you’re analyzing the correction of point **C from AB** or a deeper retracement of **B from XA**, the technical structure is screaming potential.
📊 **Fibonacci Magic**
We’ve got confluence across key Fib levels, with the final projection targeting **1.41**, a crucial resistance that aligns with multiple technical cues.
📉 **Bearish Trendline AC? Consider It Challenged.**
A decisive breach above the descending **AC trendline** would be a powerful confirmation of bullish momentum—and the market’s intent to rally.
⚠️ **Risk Strategy**
The setup remains valid as long as price holds **above point X**. A protective stop-loss below X keeps the trade clean and controlled.
🎯 **Trade Outlook**
With a solid harmonic base, technical alignment across retracement zones, and trendline pressure building, USD/CAD could be gearing up for an aggressive move north. It’s not just a chart—it’s a story, and right now, the plot points to 1.41.
---
