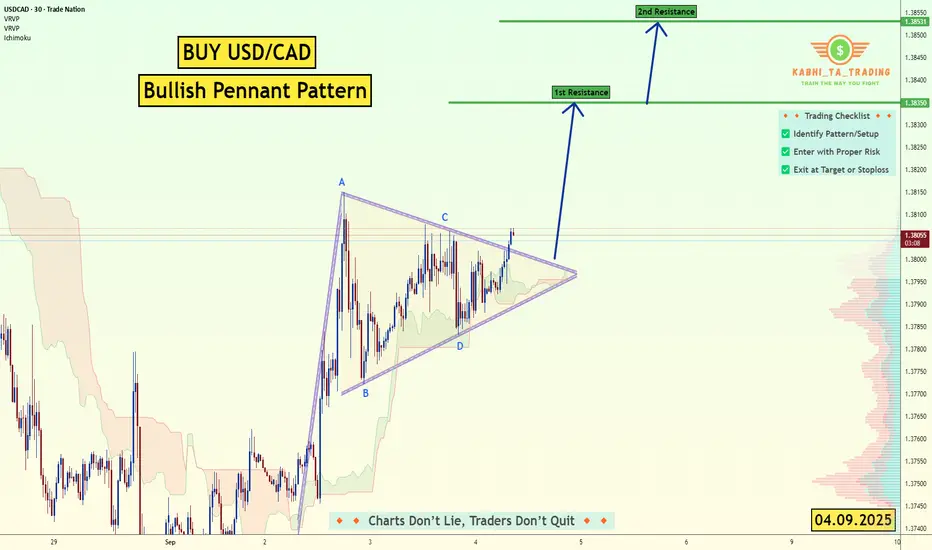
USD/CAD - Bullish Pennant (04.09.2025)The USD/CAD pair on the M30 timeframe presents a Potential Buying Opportunity due to a recent Formation of a Bullish Pennant Breakout Pattern. This suggests a shift in momentum towards the upside and a higher likelihood of further advances in the coming hours.
Possible Long Trade:
Entry: Consider Entering A Long Position around Trendline Of The Pattern.
Target Levels:
1st Resistance – 1.3835
2nd Resistance – 1.3853
🎁 Please hit the like button and
🎁 Leave a comment to support for My Post !
Your likes and comments are incredibly motivating and will encourage me to share more analysis with you.
Best Regards, KABHI_TA_TRADING
Thank you.
Disclosure: I am part of Trade Nation's Influencer program and receive a monthly fee for using their TradingView charts in my analysis.
USDCAD trade ideas
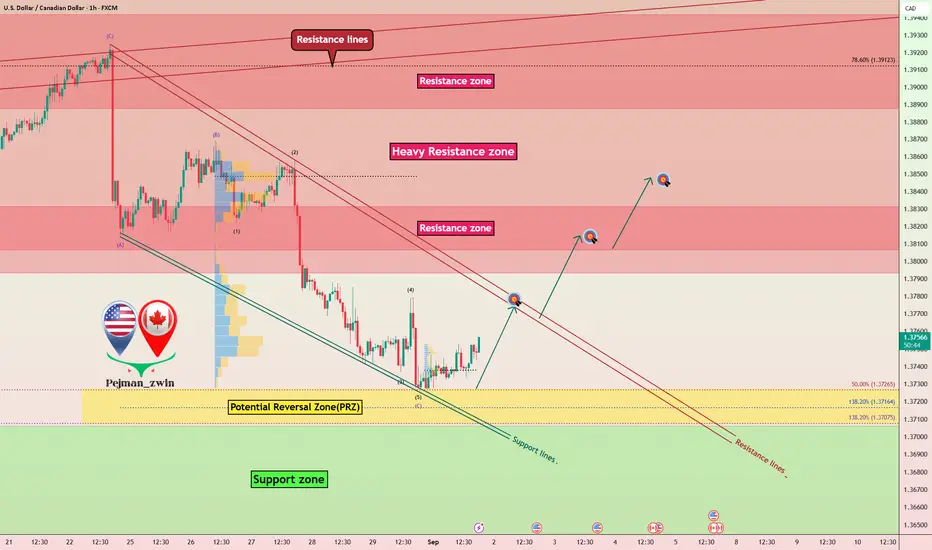
USDCAD Long Setup: From PRZ to Resistance LinesToday, I want to review the USDCAD ( OANDA:USDCAD ) long position with you.
USDCAD has reacted well to Support lines and the Potential Reversal Zone(PRZ)(1.373 CAD-1.370 CAD) .
From the perspective of Elliott wave theory , it seems that USDCAD has completed the microwave 5 of the main wave C .
I expect USDCAD to rise to the Resistance lines in the short term.
Second Target: 1.3817 CAD
Stop Loss(SL): 1.3698 CAD
Please respect each other's ideas and express them politely if you agree or disagree.
U.S. Dollar/Canadian Dollar Analyze (USDCAD), 1-hour time frame.
Be sure to follow the updated ideas.
Do not forget to put a Stop loss for your positions (For every position you want to open).
Please follow your strategy and updates; this is just my Idea, and I will gladly see your ideas in this post.
Please do not forget the ✅' like '✅ button 🙏😊 & Share it with your friends; thanks, and Trade safe.
USD/CAD – Bulls Eyeing a Bounce from Key Demand ZoneAfter an aggressive correction from the 1.3920 highs, USD/CAD has now landed on a heavy demand zone near 1.3720 – 1.3740. This area has proven to be a launchpad for rallies in recent weeks, and price is once again testing buyers’ conviction. With both technical structure and macro fundamentals in play, this zone could determine the next major swing.
Current Bias
Bullish bias as long as 1.3720 holds, with upside potential toward 1.3818 and 1.3920 supply.
Key Fundamental Drivers
USD: Supported by sticky inflation (Core PCE 2.9% y/y) and resilient consumer spending (+0.5% m/m). Fed rate cut expectations have softened, keeping the dollar supported.
CAD: Weighed down by weaker Canadian GDP (Q2 annualized -1.6%, q/q -0.4%) and slowing momentum in domestic growth. Oil remains weak near $64, offering little support to the loonie.
Macro Context
Rates: The Fed remains cautious with cuts, while the BoC faces pressure from economic contraction. Interest rate divergence favors the USD.
Growth Trends: US growth remains firmer compared to Canada’s slowdown.
Commodities: Oil’s weakness is a drag on CAD, making the currency vulnerable.
Geopolitics: Ongoing tariff disputes and Middle East energy risks keep USD demand steady as a safe haven, further weighing on CAD.
Primary Risk to the Trend
A deeper selloff in USD on unexpected Fed dovishness or a sharp rebound in oil prices (driven by geopolitical shocks or supply cuts) could strengthen CAD and invalidate the bullish setup.
Most Critical Upcoming News/Event
US ISM PMI & NFP (this week): Key drivers for Fed policy path.
Canada Jobs Report (Friday): Critical for CAD sentiment after the weak GDP print.
Leader/Lagger Dynamics
USD/CAD tends to lag oil and broader USD moves. It often follows the dollar’s momentum, while oil price shocks can lead moves on CAD. Currently, the pair is USD-led, making it more reactive to Fed data than Canadian domestic flows.
Key Levels
Support Levels: 1.3720 – 1.3740 (demand zone), 1.3660.
Resistance Levels: 1.3818 (mid-resistance), 1.3918 – 1.3925 (major supply).
Stop Loss (SL): 1.3650 (below demand zone invalidation).
Take Profit (TP): 1.3818 (first target), 1.3920 (extended target).
Summary: Bias and Watchpoints
USD/CAD is sitting at a key demand zone around 1.3720 – 1.3740, where buyers need to defend the trend. The bias remains bullish above this level, with upside targets at 1.3818 and 1.3920. A break below 1.3650 would invalidate the long setup and expose further downside. With US data in focus and CAD weighed down by weak GDP and soft oil prices, the pair is more likely to follow USD momentum in the near term. Traders should watch NFP and Canada’s jobs data closely, as these will dictate whether this bounce carries to new highs or fades into deeper consolidation.
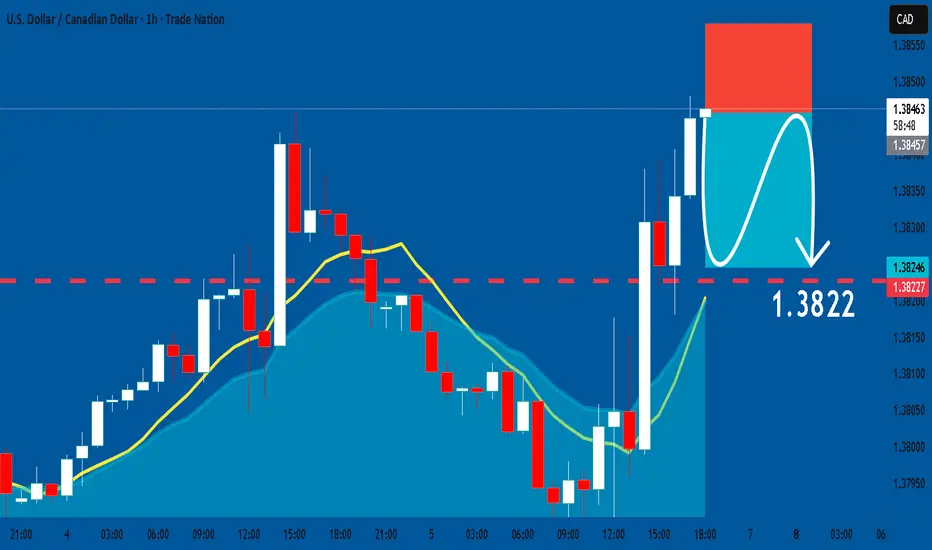
USDCAD: Short Trading Opportunity
USDCAD
- Classic bearish formation
- Our team expects fall
SUGGESTED TRADE:
Swing Trade
Sell USDCAD
Entry Level - 1.3845
Sl - 1.3857
Tp - 1.3822
Our Risk - 1%
Start protection of your profits from lower levels
Disclosure: I am part of Trade Nation's Influencer program and receive a monthly fee for using their TradingView charts in my analysis.
❤️ Please, support our work with like & comment! ❤️
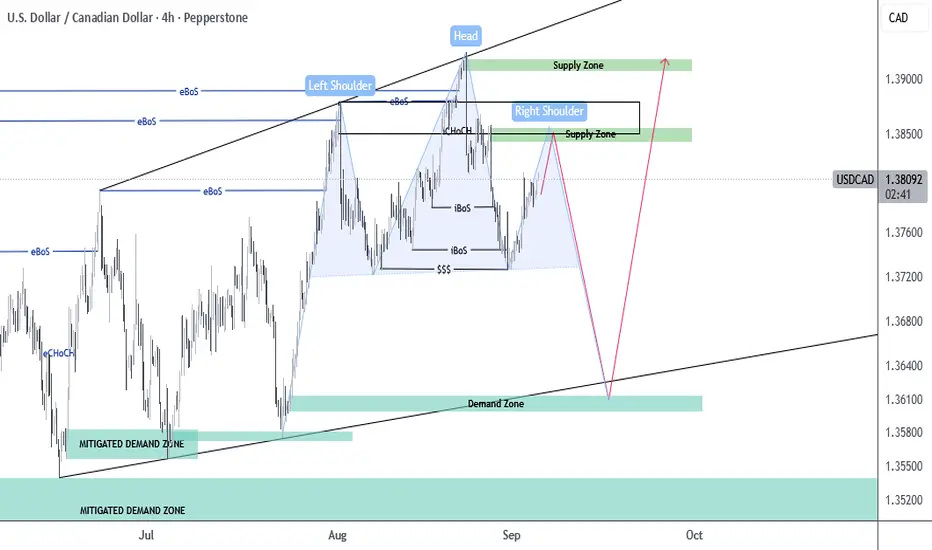
COMPLETION OF HEAD AND SHOULDERSLooking for opportunity to short USDCAD on completion of the right shoulder down to my demand zone that is support of my ascending structure.
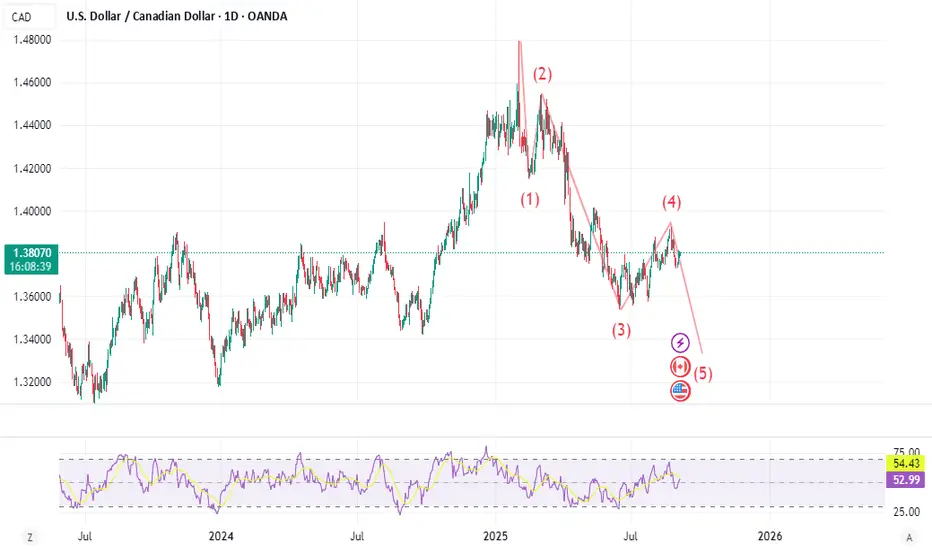
USDCAD DAILY FORECASTLooking at the moves from the chat D1, the wave 1 to 3 is completed, and giving us wave 4 already, so from here we are expecting a strong impulse move to complete wave 5.
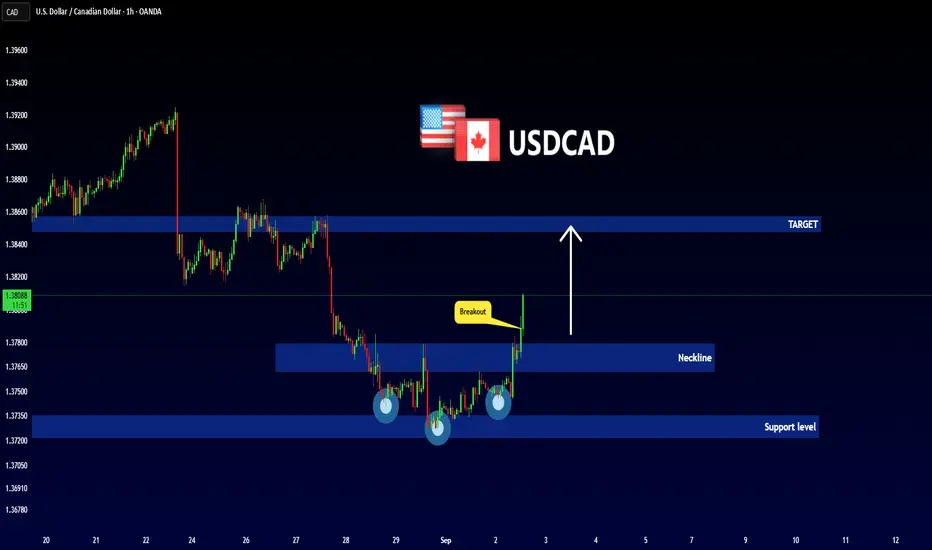
USDCAD - BULLISH MOVE!Hello Traders!
The USDCAD price formed an inverted head and shoulders pattern.
Currently, the neckline is broken!
So, I expect a bullish move🚀
______________
TARGET: 1.38480🎯
USDCADSwing trading idea for #USDCAD, following a strong bearish trend, USDCAD is expected to continue the trend, till the monthly support area, then change character and break the former high
War Room Note – Heads UpRight now, I’ve been sharing both pre-setups and after-action reports here.
In the near future, once some projects are complete, I’ll still share the after-action reports (wins, losses, lessons) publicly — but the pre-setups and trade preparation will be moving to my private notes.
Just giving a heads up early. For now, you’ll still see both here as I continue to document how the VMS Strategy plays out in real time.
⚔️ Aligned Execution.
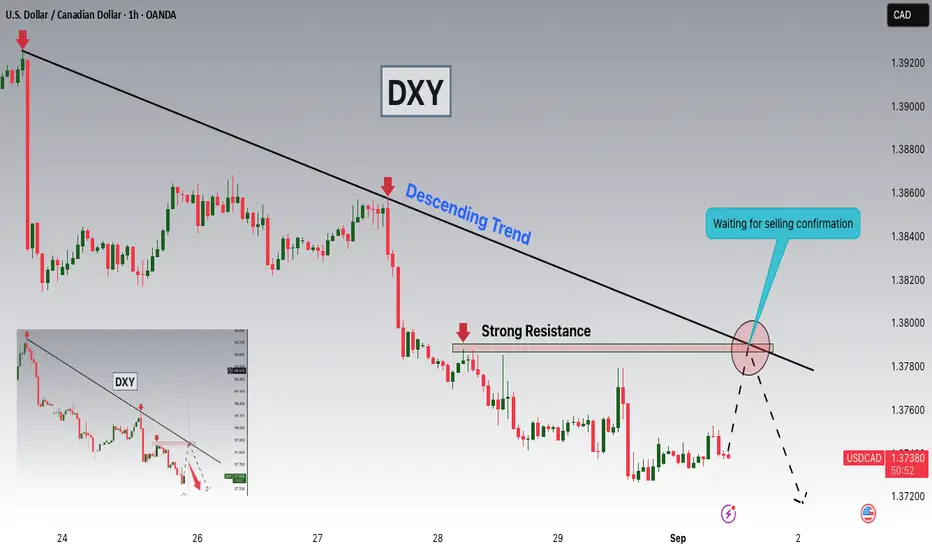
USDCAD Pullback Toward 1.37900 as Dollar Weakness PersistsHey Traders, in today's trading session we are monitoring USDCAD for a selling opportunity around the 1.37900 zone. USDCAD is trading in a downtrend, with price currently correcting toward this key support/resistance level.
Structure: The broader bias remains bearish, but price is retracing upward after recent lows.
Key level in focus: 1.37900 — a critical area where sellers may look to re-enter and push the pair lower.
Fundamentals: The U.S. Dollar Index (DXY) maintains a bearish tone as Jerome Powell’s recent dovish stance weighs on the greenback. With DXY approaching 97.800 resistance, further downside pressure on USD could reinforce USDCAD weakness.
Trade safe,
Joe.
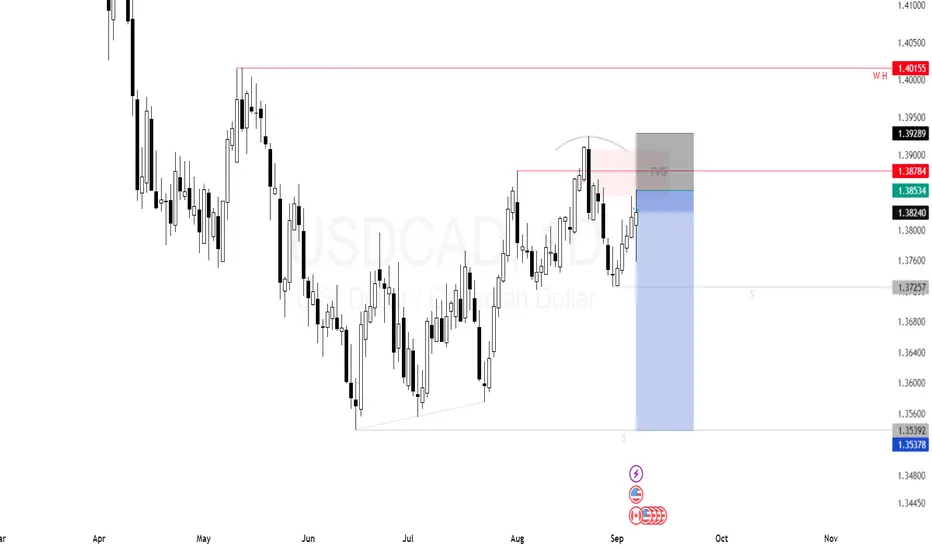
USDCAD (Daily) – Swing Short Setup📉 USDCAD (Daily) – Swing Short Setup
USDCAD has tapped into a Fair Value Gap (FVG) while simultaneously sweeping liquidity above recent highs (~1.3929). This classic combination of a liquidity grab + imbalance fill points toward bearish continuation.
🔑 Why bearish?
• Liquidity above 1.3929 has been swept, leaving a liquidity trap behind.
• Price reacted inside the FVG, a common reversal zone after a sweep.
• Bearish order flow suggests price is likely to target liquidity pools below ~1.3538.
📌 Trade Plan:
• Entry: ~1.3853 (short)
• Stop: Above 1.3929
• Target: 1.3538 (next liquidity pool)
• R:R: ~1:4 (risking ~75 pips to capture ~315 pips)
Again, this is a swing setup on the daily timeframe – patience is required, but the structure supports downside expansion.
⚠️ Risk management is the key.
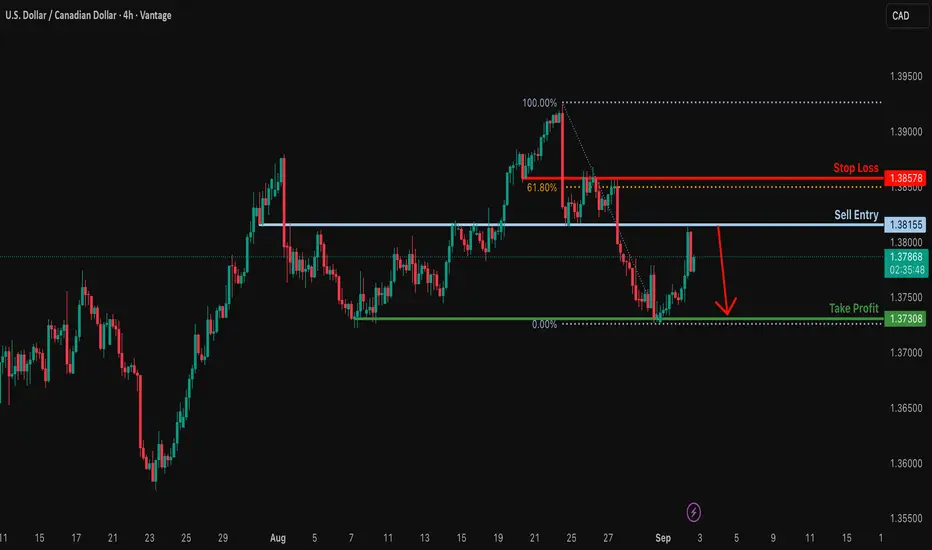
Bearish reversal off major resistance?The Loonie (USD/CAD) has rejected off the resistance level, which is an overlap resistance, and could potentially drop from this level to our take profit.
Entry: 1.3915
Why we like it:
There is an overlap resistance level.
Stop loss: 1.3857
Why we like it:
There is an overlap resistance that lines up with the 61.8% Fibonacci retracement.
Take profit: 1.3730
Why we like it:
There is a multi-swing low support.
Enjoying your TradingView experience? Review us!
Please be advised that the information presented on TradingView is provided to Vantage (‘Vantage Global Limited’, ‘we’) by a third-party provider (‘Everest Fortune Group’). Please be reminded that you are solely responsible for the trading decisions on your account. There is a very high degree of risk involved in trading. Any information and/or content is intended entirely for research, educational and informational purposes only and does not constitute investment or consultation advice or investment strategy. The information is not tailored to the investment needs of any specific person and therefore does not involve a consideration of any of the investment objectives, financial situation or needs of any viewer that may receive it. Kindly also note that past performance is not a reliable indicator of future results. Actual results may differ materially from those anticipated in forward-looking or past performance statements. We assume no liability as to the accuracy or completeness of any of the information and/or content provided herein and the Company cannot be held responsible for any omission, mistake nor for any loss or damage including without limitation to any loss of profit which may arise from reliance on any information supplied by Everest Fortune Group.
Usdcad Usdcad we hv market on a down trend on a 1 week and also on a 1 day so am expecting price to sell to de down side
USDCAD Double Top Signals a Potential BreakdownUSDCAD pair is testing a critical resistance area near 1.3830 after a strong rebound. But the price structure is beginning to flash signs of exhaustion. With repeated rejections and a clear double-top pattern forming, the setup favors a bearish move. If momentum turns, we could see a meaningful correction toward the 1.3730 support zone, with deeper downside risk into mid-September.
Current Bias
Bearish rejection at resistance, structure favors downside continuation.
Key Fundamental Drivers
Canada: Weak August jobs report (unemployment 7.1%, wages cooling) raised BoC cut expectations, pressuring CAD. But oil prices (Brent ~$65) limit the downside risk, giving CAD some commodity support.
U.S.: Weaker jobs (+142k NFP, unemployment 4.3%) keeps Fed cuts on the table, capping USD upside. Core PCE sticky at 2.9%, but inflation trend is moderating.
Macro Context
Interest Rates: Fed expected to cut in coming months; BoC markets price ~90% chance of a September cut.
Economic Growth: U.S. slowing but still resilient, Canada contracting (Q2 GDP −0.4% q/q).
Commodities: Oil’s soft rebound provides CAD with some stability.
Geopolitics: Trade tensions (U.S. tariffs, China-Russia bond coordination) keep USD supported as a defensive hedge.
Primary Risk to the Trend
A sharp oil sell-off would weaken CAD and trigger USD/CAD upside.
U.S. CPI surprise to the upside could reprice Fed expectations, boosting USD.
Most Critical Upcoming News/Event
U.S. CPI (this week): Will decide Fed cut timing.
BoC September rate decision: High probability of a cut, market focus on forward guidance.
Leader/Lagger Dynamics
USD/CAD is typically a lagger — following USD direction (via Fed expectations) and CAD flows (via oil). It often mirrors oil price action and diverges from USD/JPY, reflecting risk sentiment shifts.
Key Levels
Support Levels: 1.3732, 1.3585
Resistance Levels: 1.3830, 1.3875
Stop Loss (SL): 1.3875
Take Profit (TP): 1.3732 (first), 1.3585 (extended)
Summary: Bias and Watchpoints
USD/CAD is leaning bearish after failing to break cleanly above 1.3830. Fundamentals point to a tug-of-war between dovish BoC expectations and weaker U.S. data, but the chart structure favors downside into 1.3732 and potentially 1.3585. My stop loss sits above 1.3875 to protect against a breakout. Watch U.S. CPI as the key driver: a hotter print could revive USD strength, while a softer read could accelerate CAD gains. Oil’s stability remains a secondary but important factor for CAD resilience.
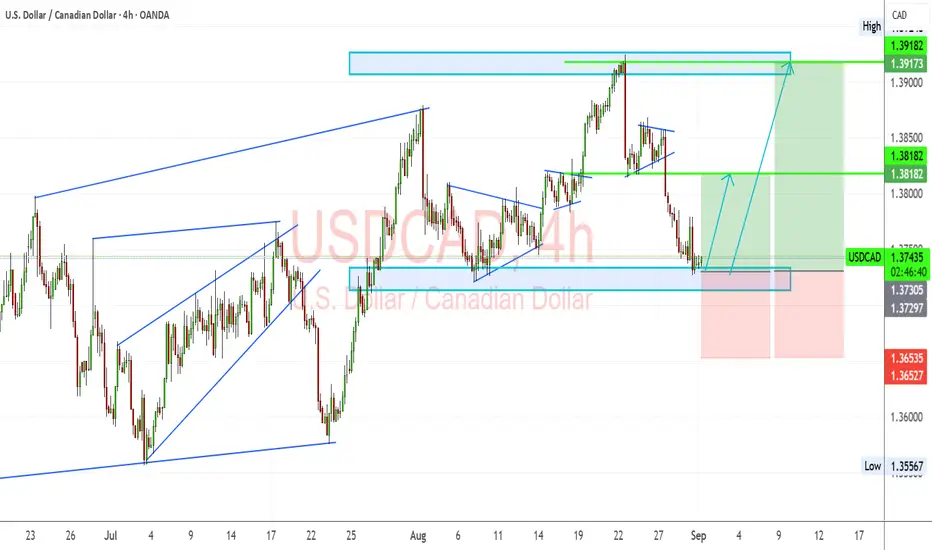
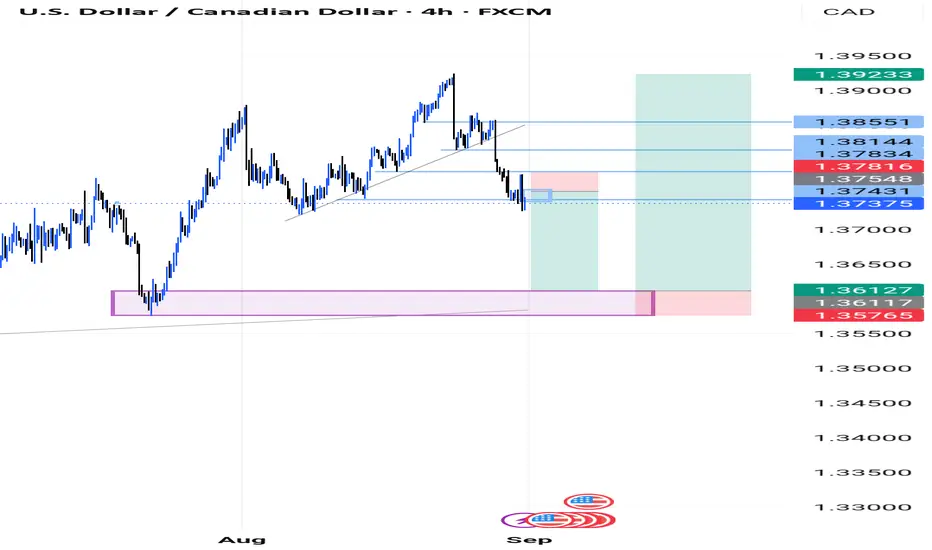
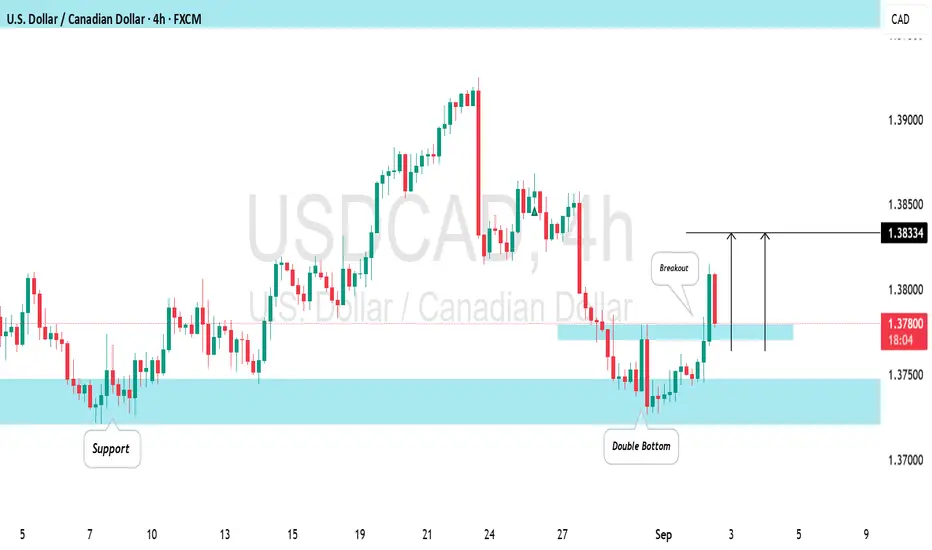
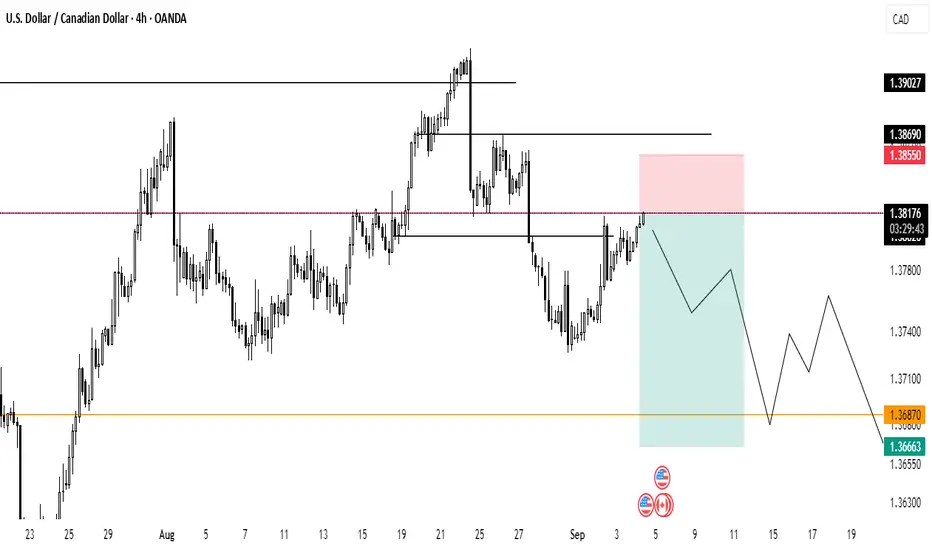
USDCAD: Pullback From SupportThere is a strong likelihood that the 📈USDCAD will experience a pullback from the support level.
This expectation is reinforced by the formation of a double bottom pattern on the 4-hour time frame, along with a breakout above the neckline of that pattern.
If this bullish momentum continues, the target for the upward movement is set at 1.3833.
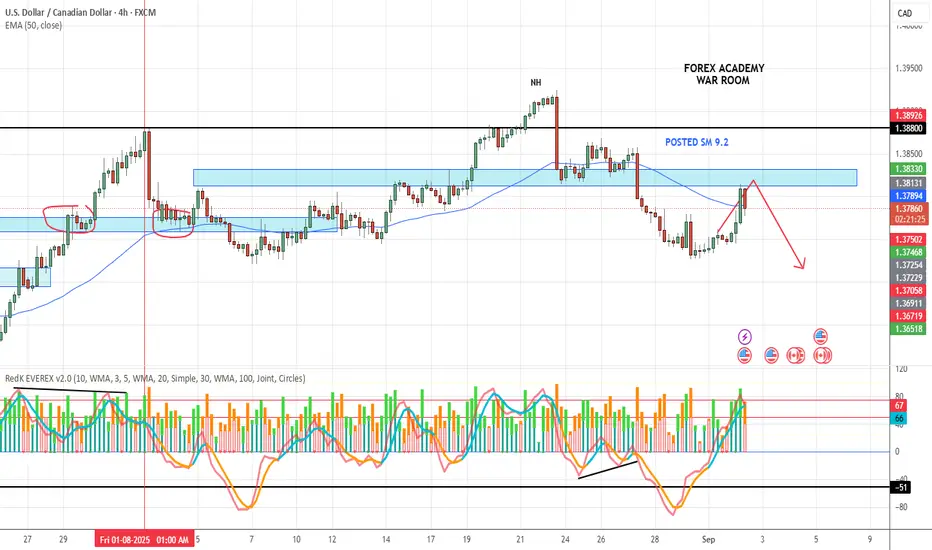
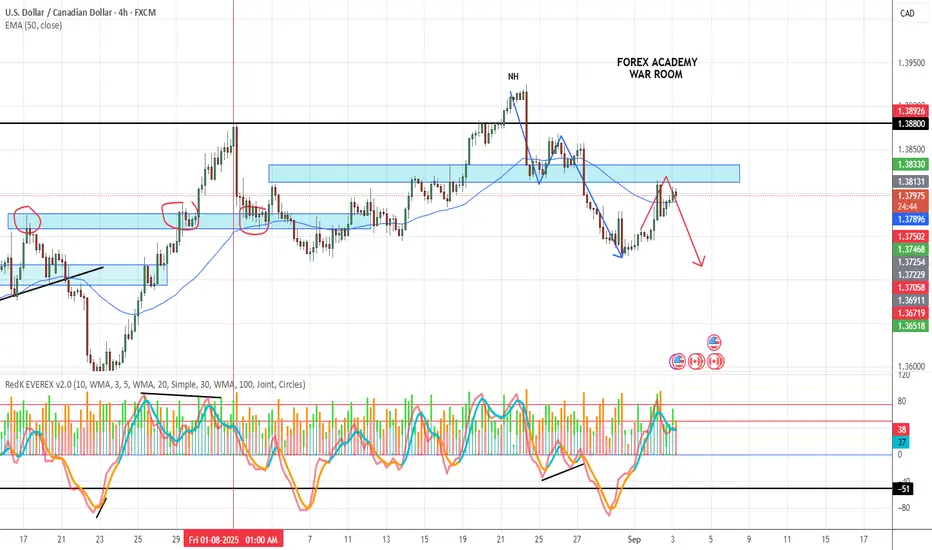
USD/CAD – Pullback WatchReport from the War Room:
USD/CAD is pulling back into a marked support/resistance zone. The battlefield is clear, but the confirmation is not yet in place.
Structure: Price is pressing into the SR zone.
Momentum: Currently high, but needs alignment.
Volume: Still waiting for conviction.
Signal: Watching for a completed pullback with a strong engulfing candle to mark the entry.
⚔️ War Room Lesson:
A pullback is only complete when all three soldiers — Volume, Momentum, and Structure — stand together. Until then, we wait.
👉 Discipline wins more battles than impatience ever will.
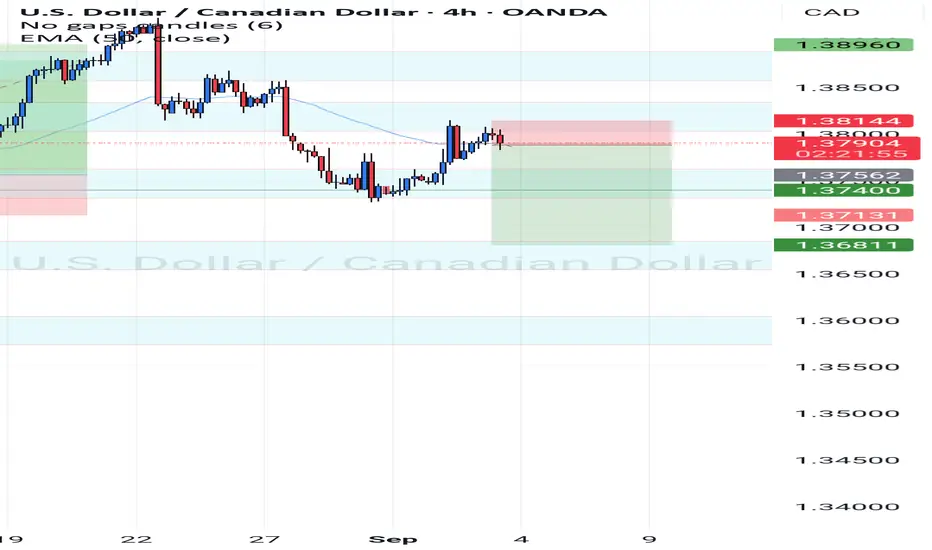
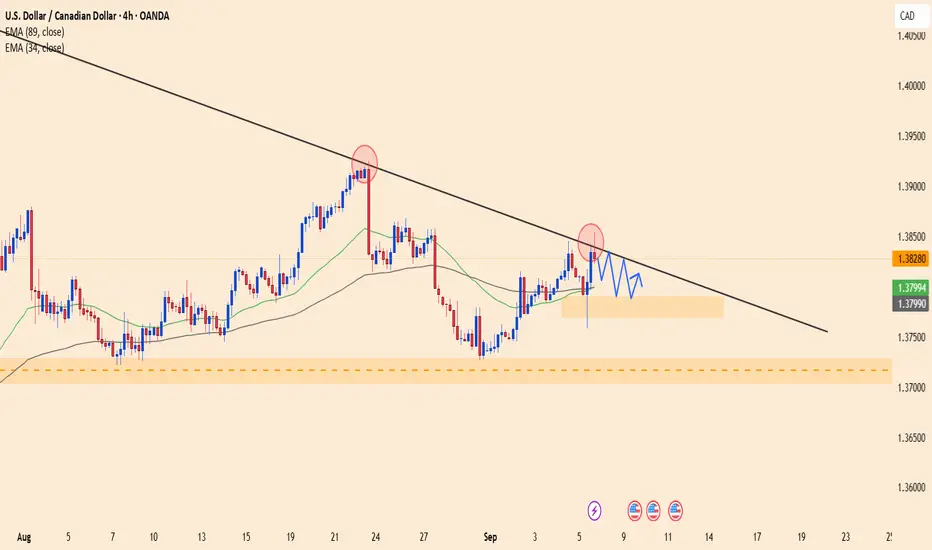
USD/CAD – Sideways Accumulation, Preparing for a Mild UpsideThe August Nonfarm Payrolls report came in at only 22K, far below expectations of 75K and the previous 79K, causing the USD to weaken. However, Canadian labor data was also underwhelming, leaving the CAD too weak to drag the pair significantly lower. As a result, USD/CAD has maintained balance and is moving within a narrow range.
On the H4 chart, the price is fluctuating around 1.38280, closely tracking the long-term descending trendline. The EMA34 and EMA89 are moving sideways, reflecting an accumulation phase. If support at 1.3787 holds, USD/CAD could rebound and push up towards 1.3833 before confirming the next trend direction.
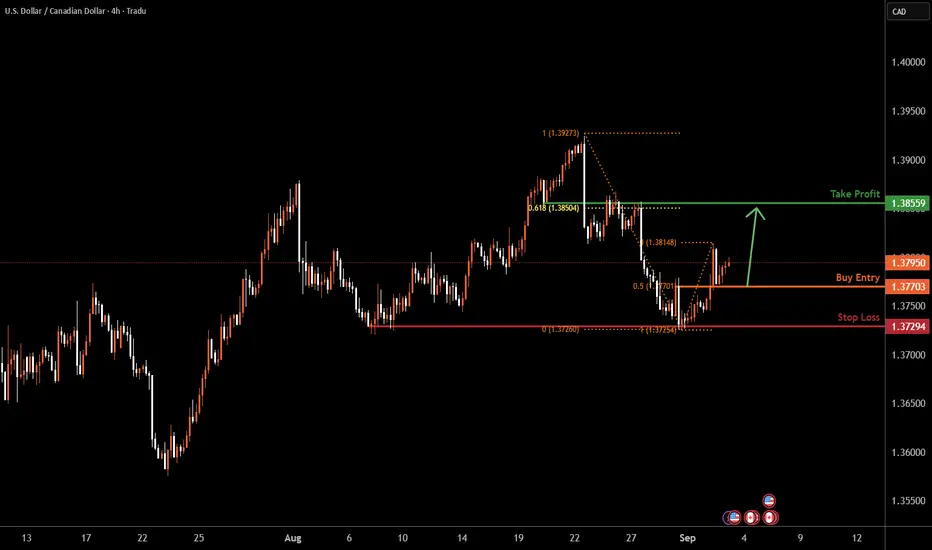
Bulllish bounce off pullback support?USD/CAD is falling towards the support level, which is a pullback support that aligns with the 50% Fibonacci retracement and could bounce from this level to our take profit.
Entry: 1.3770
Why we like it:
There is a pullback support that aligns with the 50% Fibonacci retracement.
Stop loss: 1.3728
Why we like it:
There is a multi-swing low support.
Take profit: 1.3855
Why we like it:
There is a pullback resistance level that aligns with the 61.8% Fibonacci retracement.
Enjoying your TradingView experience? Review us!
Please be advised that the information presented on TradingView is provided to Vantage (‘Vantage Global Limited’, ‘we’) by a third-party provider (‘Everest Fortune Group’). Please be reminded that you are solely responsible for the trading decisions on your account. There is a very high degree of risk involved in trading. Any information and/or content is intended entirely for research, educational and informational purposes only and does not constitute investment or consultation advice or investment strategy. The information is not tailored to the investment needs of any specific person and therefore does not involve a consideration of any of the investment objectives, financial situation or needs of any viewer that may receive it. Kindly also note that past performance is not a reliable indicator of future results. Actual results may differ materially from those anticipated in forward-looking or past performance statements. We assume no liability as to the accuracy or completeness of any of the information and/or content provided herein and the Company cannot be held responsible for any omission, mistake nor for any loss or damage including without limitation to any loss of profit which may arise from reliance on any information supplied by Everest Fortune Group.
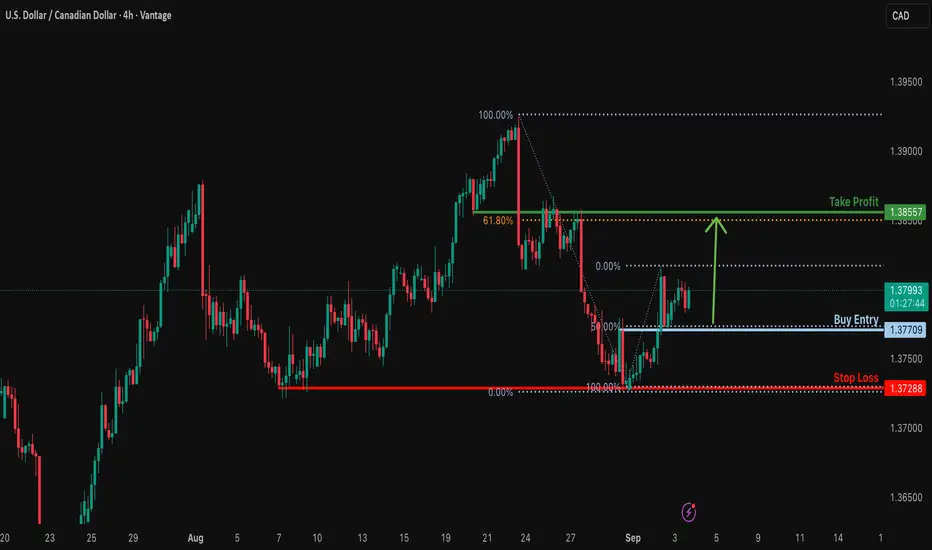
USDCAD H4 | Bullish bounce offUSD/CAD has bounced off the buy entry which has been identified as a pullback support that lines up with the 50% Fibonacci retracement and could bounce from this level to the upside.
Buy entry is at 1.3770, which is a pullback support that lines up with the 50% Fibonacci retracement.
Stop loss is at 1.3729, which is a multi-swing low support.
Take profit is at 1.3855, which is an overlap resistance that laigns withthe 61.8% Fibonacci retracement.
High Risk Investment Warning
Trading Forex/CFDs on margin carries a high level of risk and may not be suitable for all investors. Leverage can work against you.
Stratos Markets Limited (tradu.com ):
CFDs are complex instruments and come with a high risk of losing money rapidly due to leverage. 65% of retail investor accounts lose money when trading CFDs with this provider. You should consider whether you understand how CFDs work and whether you can afford to take the high risk of losing your money.
Stratos Europe Ltd (tradu.com ):
CFDs are complex instruments and come with a high risk of losing money rapidly due to leverage. 66% of retail investor accounts lose money when trading CFDs with this provider. You should consider whether you understand how CFDs work and whether you can afford to take the high risk of losing your money.
Stratos Global LLC (tradu.com ):
Losses can exceed deposits.
Please be advised that the information presented on TradingView is provided to Tradu (‘Company’, ‘we’) by a third-party provider (‘TFA Global Pte Ltd’). Please be reminded that you are solely responsible for the trading decisions on your account. There is a very high degree of risk involved in trading. Any information and/or content is intended entirely for research, educational and informational purposes only and does not constitute investment or consultation advice or investment strategy. The information is not tailored to the investment needs of any specific person and therefore does not involve a consideration of any of the investment objectives, financial situation or needs of any viewer that may receive it. Kindly also note that past performance is not a reliable indicator of future results. Actual results may differ materially from those anticipated in forward-looking or past performance statements. We assume no liability as to the accuracy or completeness of any of the information and/or content provided herein and the Company cannot be held responsible for any omission, mistake nor for any loss or damage including without limitation to any loss of profit which may arise from reliance on any information supplied by TFA Global Pte Ltd.
The speaker(s) is neither an employee, agent nor representative of Tradu and is therefore acting independently. The opinions given are their own, constitute general market commentary, and do not constitute the opinion or advice of Tradu or any form of personal or investment advice. Tradu neither endorses nor guarantees offerings of third-party speakers, nor is Tradu responsible for the content, veracity or opinions of third-party speakers, presenters or participants.
Canadian Dollar Falls After Labour Market Data ReleaseCanadian Dollar Falls After Labour Market Data Release
On Friday, disappointing figures showed that in August the Canadian economy lost 65,500 jobs (the forecast had been for an increase of 10,000), while the unemployment rate rose to 7.1%. This is the highest level of unemployment since May 2016, excluding the pandemic period.
It is believed that:
→ the deterioration in the labour market (primarily in manufacturing) is a consequence of the trade war with the United States;
→ the fall in employment in Canada has increased the likelihood that the Bank of Canada will resume its monetary easing campaign.
As a result, the CAD weakened sharply against other currencies. However, the depreciation against the US dollar was less pronounced, as the USD itself is under pressure from various factors.
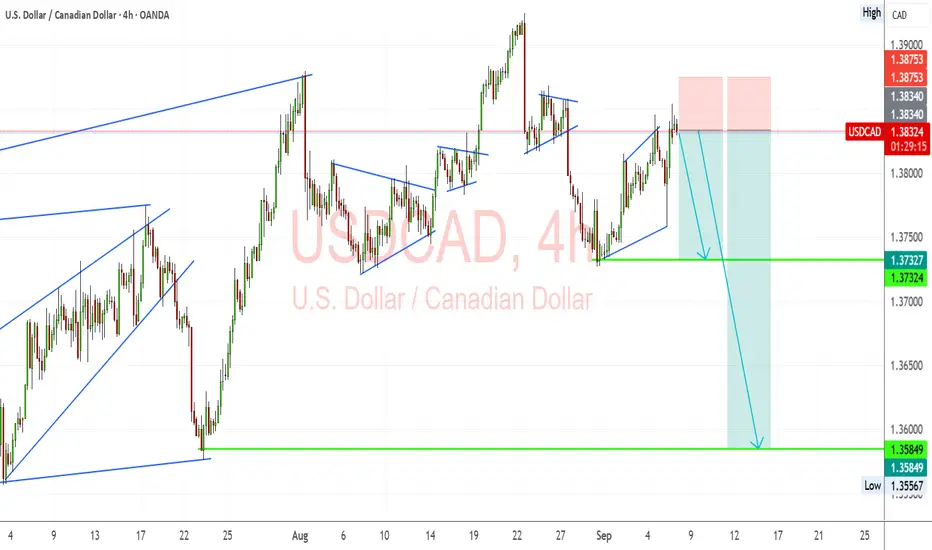
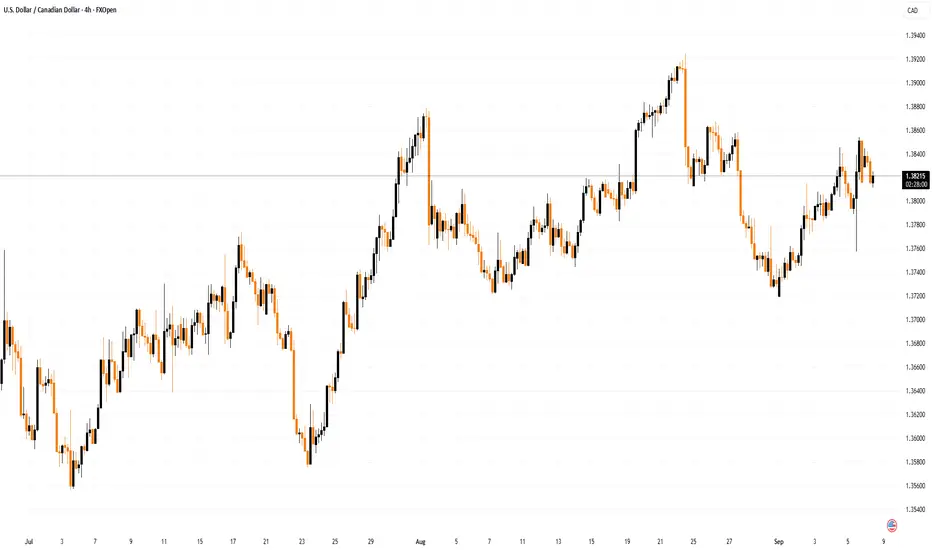
Technical Analysis of USD/CAD
From a long-term perspective, the USD/CAD pair remains within a downward trend, highlighted by a red descending channel.
From a medium-term perspective, since July the rate has risen from the 1.3550–1.3600 support zone, forming an ascending channel (shown in blue).
Price action (indicated by arrows) shows that:
→ sellers are aggressive, pushing the price down from the upper boundary of the red channel;
→ buyers are aggressive, driving the price up from the lower boundary of the blue channel. Its median line acts as resistance.
This is compressing USD/CAD fluctuations into a pattern resembling a symmetrical narrowing triangle (shown in black), with recent overbought (1) and oversold (2) conditions on the RSI marking price reversals back into the triangle from its boundaries.
Thus, we could assume that supply and demand forces will keep USD/CAD in a state of temporary balance while awaiting key news next week:
→ 16 September – Canada CPI report;
→ 17 September – interest rate decisions from both the Bank of Canada and the Federal Reserve.
This article represents the opinion of the Companies operating under the FXOpen brand only. It is not to be construed as an offer, solicitation, or recommendation with respect to products and services provided by the Companies operating under the FXOpen brand, nor is it to be considered financial advice.
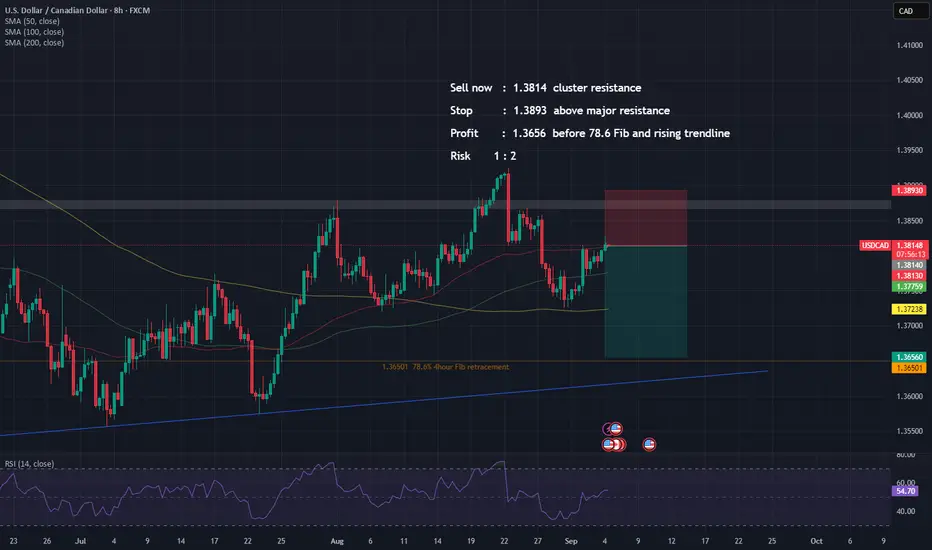
Sell USD/CAD now at cluster resistance.CAD was one of the top performing majors last week and I expect it to continue. It's the start of a new month and the top wick of the new monthly candle before the downtrend continues. There is Non Farm Payrolls on Friday at the end of the week, so price action before the news event will influence this trades outcome.
Sell now : 1.3814 cluster resistance
Stop : 1.3893 above major resistance
Profit : 1.3656 before 78.6 Fib and rising trendline
Risk 1 : 2
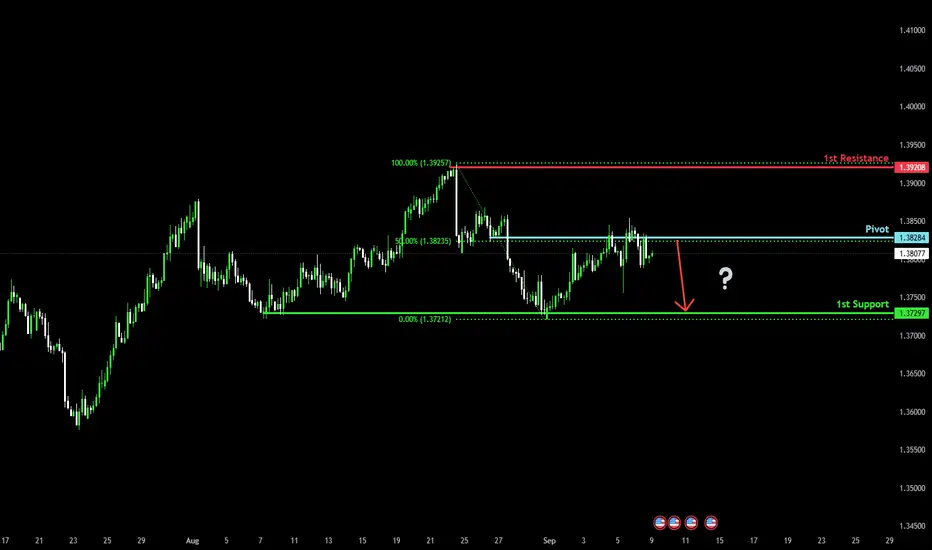
Bearish setup in play?The Loonie (USD/CAD) has rejected off the pivot and could drop to the 1st support, which acts as a multi-swing low support.
Pivot: 1.3828
1st Support: 1.3729
1st Resistance: 1.3920
Disclaimer:
The above opinions given constitute general market commentary, and do not constitute the opinion or advice of IC Markets or any form of personal or investment advice.
Any opinions, news, research, analyses, prices, other information, or links to third-party sites contained on this website are provided on an "as-is" basis, are intended only to be informative, is not an advice nor a recommendation, nor research, or a record of our trading prices, or an offer of, or solicitation for a transaction in any financial instrument and thus should not be treated as such. The information provided does not involve any specific investment objectives, financial situation and needs of any specific person who may receive it. Please be aware, that past performance is not a reliable indicator of future performance and/or results. Past Performance or Forward-looking scenarios based upon the reasonable beliefs of the third-party provider are not a guarantee of future performance. Actual results may differ materially from those anticipated in forward-looking or past performance statements. IC Markets makes no representation or warranty and assumes no liability as to the accuracy or completeness of the information provided, nor any loss arising from any investment based on a recommendation, forecast or any information supplied by any third-party.