USDCAD Confirms Triple Bottom: Bullish Momentum BuildingUSDCAD Confirms Triple Bottom: Bullish Momentum Building
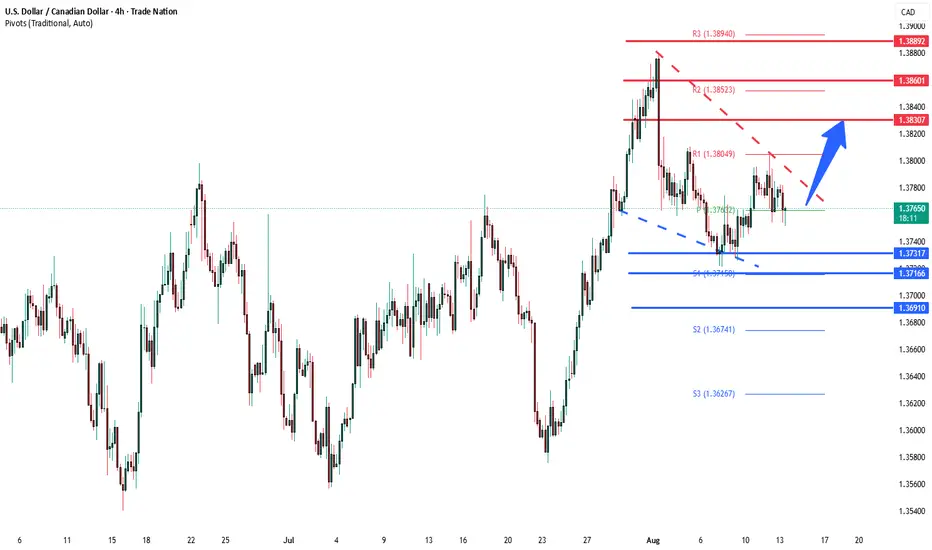
USDCAD has confirmed a triple bottom pattern, signaling a potential shift from a bearish to a bullish trend. This formation typically suggests that selling pressure has exhausted and buyers are beginning to take control.
Following the bullish confirmation, price action appears poised for an upward move. The current weakness in the USD stems from market expectations of a possible rate cut at the September FOMC meeting—a topic that remains open to interpretation.
While the dollar is showing softness today, volume may stabilize in the near term. If the U.S. continues to deliver strong economic data, the odds favor further upside for USDCAD.
As outlined in the chart, I expect USDCAD to follow the projected path. That said, the extent of the move is uncertain. Market analysis is a dynamic process that requires ongoing evaluation and adjustment.
You may find more details in the chart!
Thank you and Good Luck!
PS: Please support with a like or comment if you find this analysis useful for your trading day
Disclosure: I am part of Trade Nation's Influencer program and receive a monthly fee for using their TradingView charts in my analysis.
USDCAD trade ideas

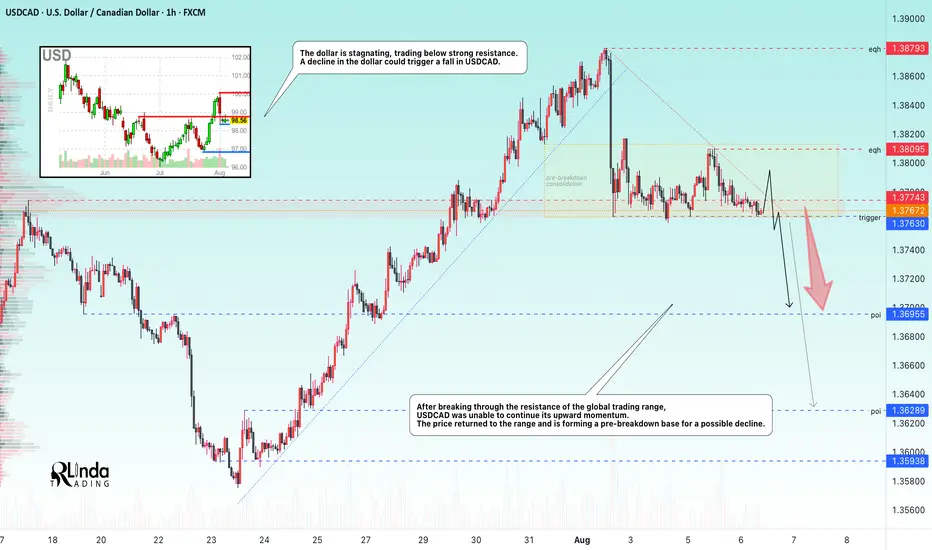
USDCAD → Short squeeze for further declineFX:USDCAD is forming another short squeeze relative to the global price range ahead of a possible decline within the global downtrend.
After breaking through the resistance of the global trading range, USDCAD was unable to continue its upward momentum. The price returned to the range, under strong resistance, and is forming a pre-breakdown base for a possible decline. The trigger in our case is support at 1.3762. The dollar is stagnating, trading below strong resistance. A decline in the dollar could trigger a fall in USDCAD
Support levels: 1.376, 1.3695, 1.3629
Resistance levels: 1.3774, 1.3809
The market structure is quite weak, both globally and locally. In addition, against the backdrop of an expected rate cut, the dollar may continue its downward global trend, which may also affect the price of the currency pair, which has formed a false breakout of resistance...
Best regards, R. Linda!
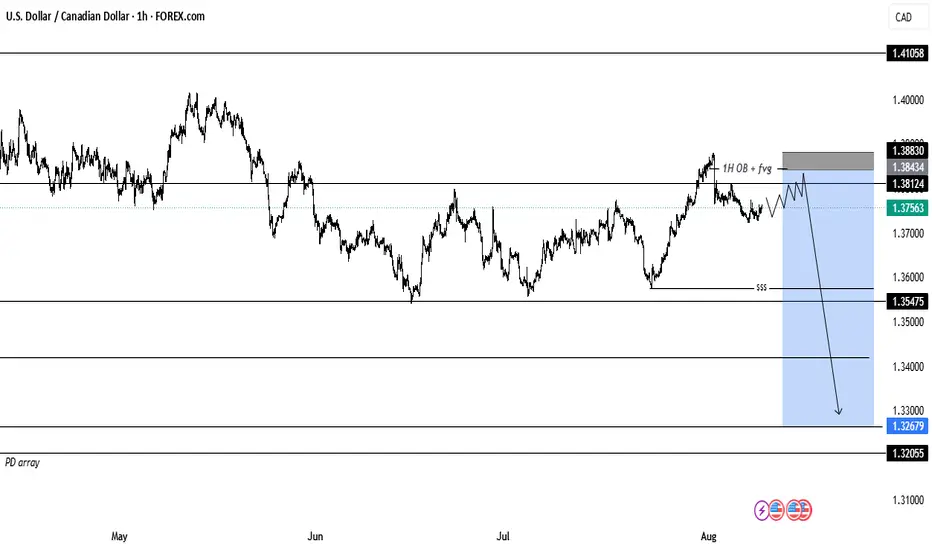
USDCAD 1H sell analysislooking for sell opportunities if/when the market hits the 1H order block + fvg area
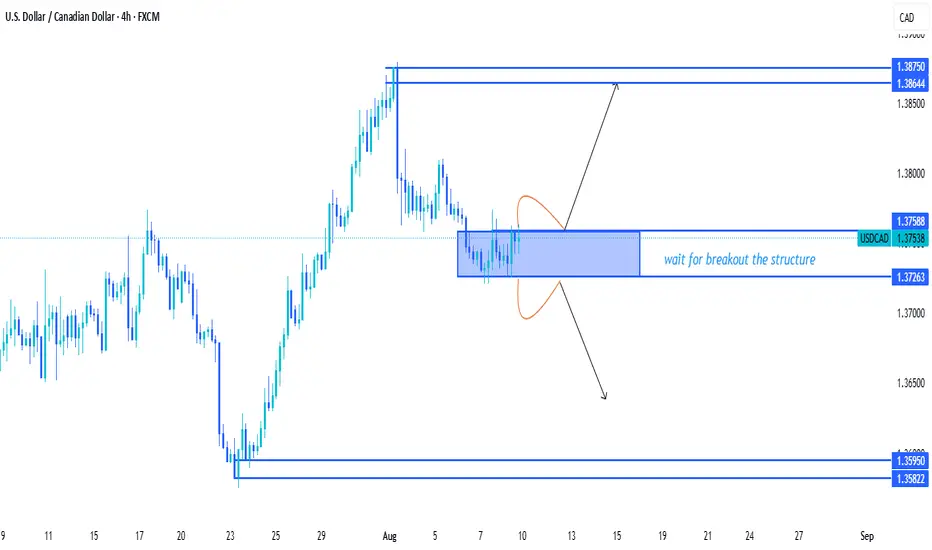
USDCAD TRADE SETUPWait for breakout the structure then take a trade for Market bias otherwise skip this setup
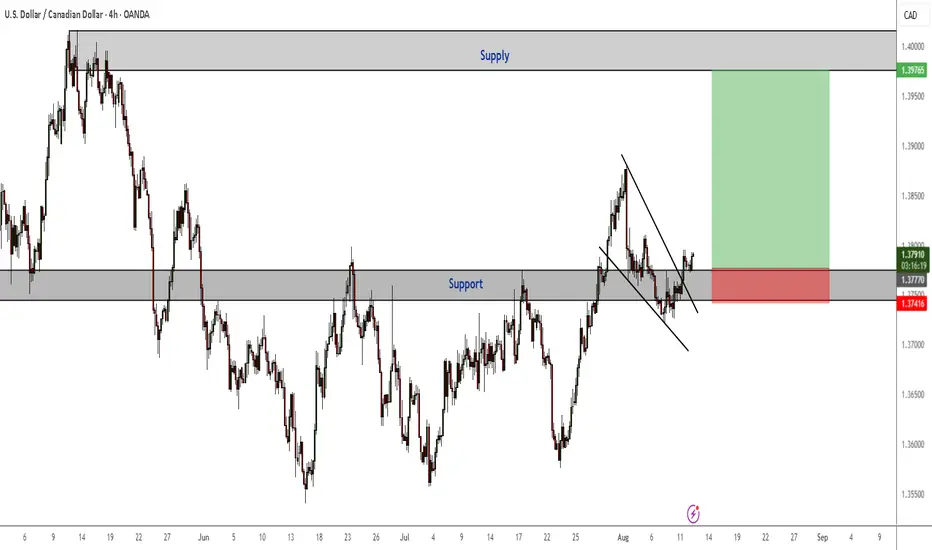
USDCAD Bull Flag and Other Long ConfirmationsPrice is currently in a support zone on H4 after it broke out of a bullish flag and retested it. My bias is bullish and target will be in the supply zone.
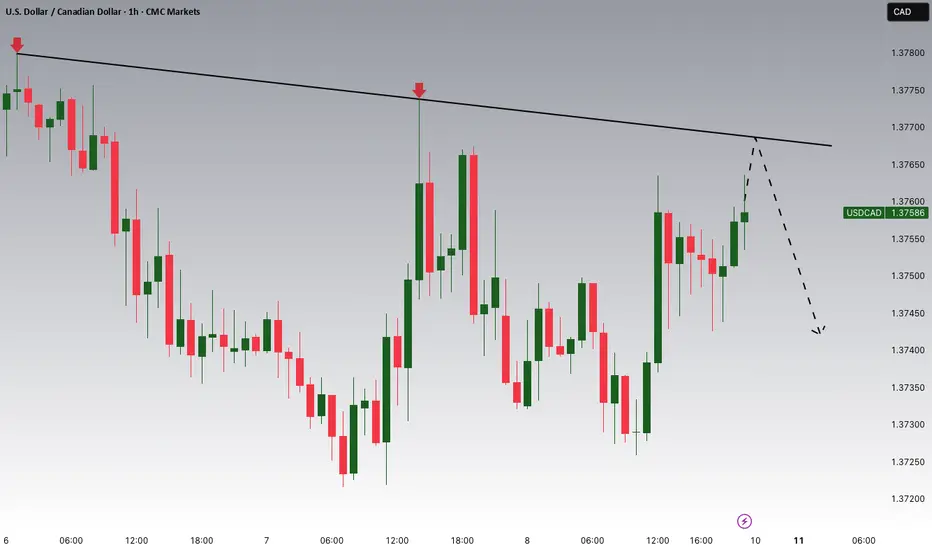
USDCAD Potential DownsidesHey Traders, in the coming week we are monitoring USDCAD for a selling opportunity around 1.37700 zone, USDCAD is trading in a downtrend and currently is in a correction phase in which it is approaching the trend at 1.37700 support and resistance area.
Trade safe, Joe.
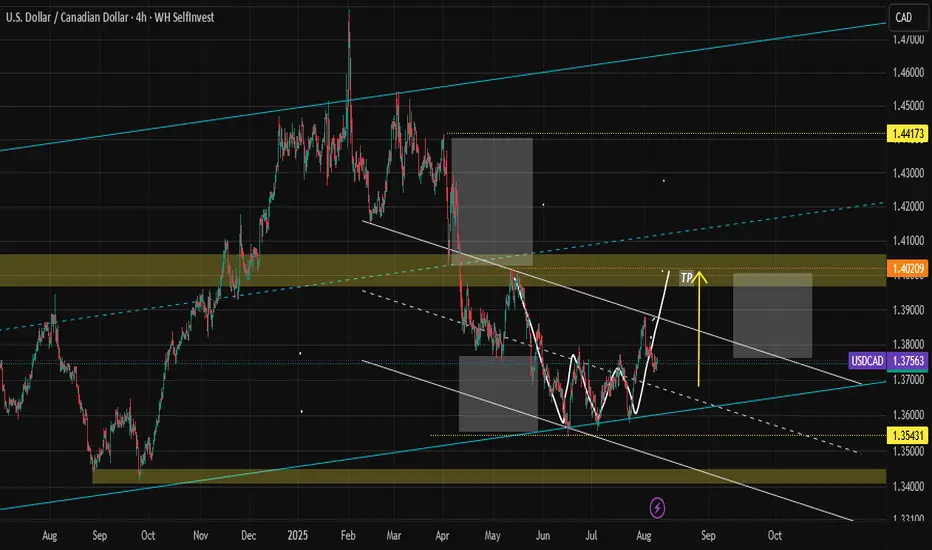
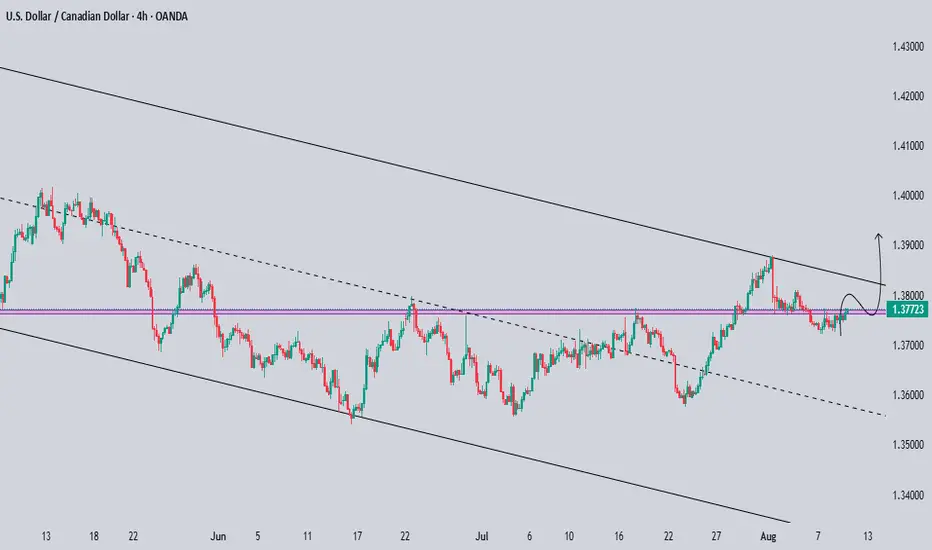
USDCADProbability of reaching the TP (rise to the 1.4020 area): about 65% to 70%
Probability of reversal before reaching the TP: about 30% to 35%
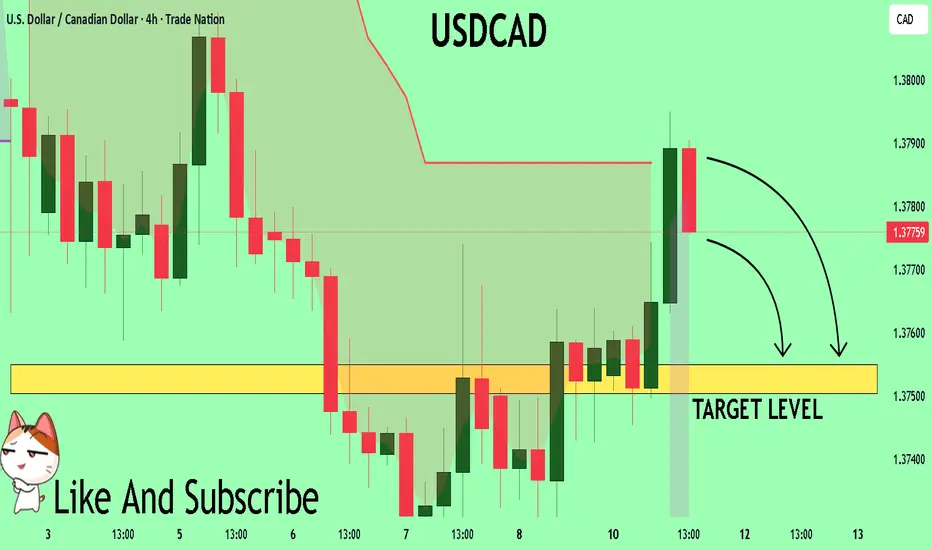
USDCAD Set To Fall! SELL!
My dear subscribers,
My technical analysis for USDCAD is below:
The price is coiling around a solid key level - 1.3779
Bias - Bearish
Technical Indicators: Pivot Points Low anticipates a potential price reversal.
Super trend shows a clear sell, giving a perfect indicators' convergence.
Goal - 1.3755
About Used Indicators:
By the very nature of the supertrend indicator, it offers firm support and resistance levels for traders to enter and exit trades. Additionally, it also provides signals for setting stop losses
Disclosure: I am part of Trade Nation's Influencer program and receive a monthly fee for using their TradingView charts in my analysis.
———————————
WISH YOU ALL LUCK
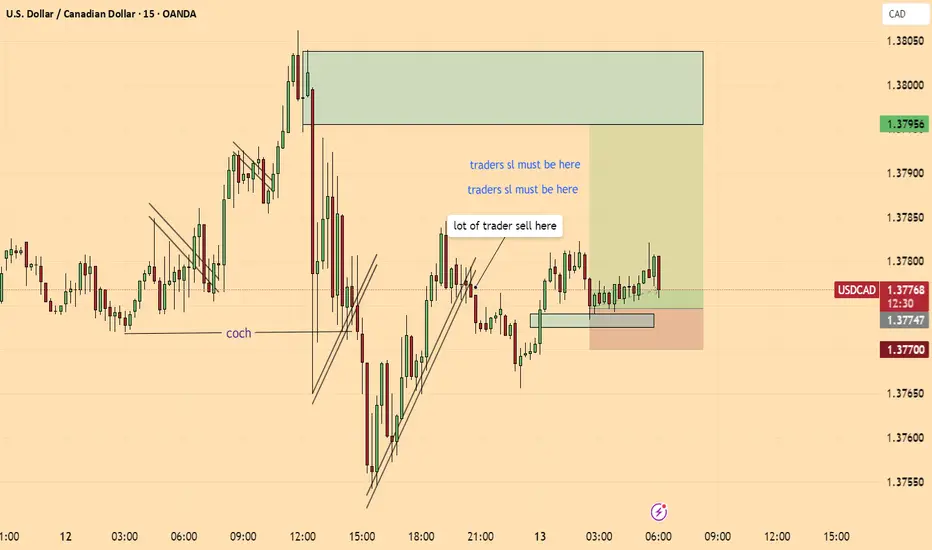
buyI buy here beacuse at the previous break of treand lot of trader must be sell and there sl must be in up ,, I got a strong demand zone for buying , so what you think I am gonna win or loss?
USDCAD BUY!!Strong signs of a bullish market, Triple bottom , break of the last market high, now a clear retest and price is moving towards the daily FVG.

USDCAD Technical & Order Flow AnalysisOur analysis is based on a multi-timeframe top-down approach and fundamental analysis.
Based on our assessment, the price is expected to return to the monthly level.
DISCLAIMER: This analysis may change at any time without notice and is solely intended to assist traders in making independent investment decisions. Please note that this is a prediction, and I have no obligation to act on it, nor should you.
Please support our analysis with a boost or comment!
USDCAD ProbableOn the M30 chart, USDCAD has dropped to a low (marked “x”), which acts as a liquidity sweep zone. Price has since pulled back into a sell-side order block (B2S OB) , which has a FVG , that is currently serving as resistance. From here, two main scenarios are possible. In the first, price taps the OB and forms a lower-time-frame bearish reversal pattern (such as a CHOCH or engulf), giving a short opportunity targeting a sweep of “x.” After that sweep, a bullish reversal at “x” could provide a long entry toward the fills and the blue-line, which is a major buy-side level. In the second scenario, price breaks cleanly above the OB and holds, treating the OB as failed supply. A retrace into new demand (like an FVG or the move’s origin) could then be a long setup to the blue-line. Shorts are invalidated if price closes above the OB high, while longs from “x” are invalidated if price closes back below the sweep low without reclaiming it.
Watch for two main paths:
1. Short-first, then long
Wait for a tap of the OB + a lower time-frame (“LTF”) bearish reversal (CHOCH, engulf).
Short targeting a sweep of “x”.
After sweep, wait for bullish LTF confirmation at “x” → then long up to fills and the blue-line (major buy-side level).
2. Break-and-go long
If price breaks through the OB and holds above, treat the OB as failed supply.
Wait for a retrace into new demand (FVG or origin), then long to the blue-line.
Key triggers & invalidations:
Short fails if price closes above OB high.
Long from “x” fails if price closes back below the sweep low without reclaiming it.

usdcadpotentially trading USDCAD down to discount pricing and then waiting to look for longs if daily orderflow stays bullish

USDCAD MM triggered a false breakout to fallMM provoked a false breakout of the resistance range; there is no continuation of the upward momentum. The price has returned to the range and is forming a consolidation, the goal of which may be to accumulate potential for the continuation of the downward movement.
The market has a strong downward trend structure. After a false breakout of resistance, MM has the potential to move the price down. The target is the liquidity area consisting of a cascade bottom: 1.357, 1.355, 1.354.

USDCAD: Strong Bearish Signal?!The 📈USDCAD pair appears to be bullish following more than a month of consolidation.
The bullish breakout from a sideways range support serves as a strong confirmation signal.
Indicating an expected upward movement towards at least the 1.3950 support level.

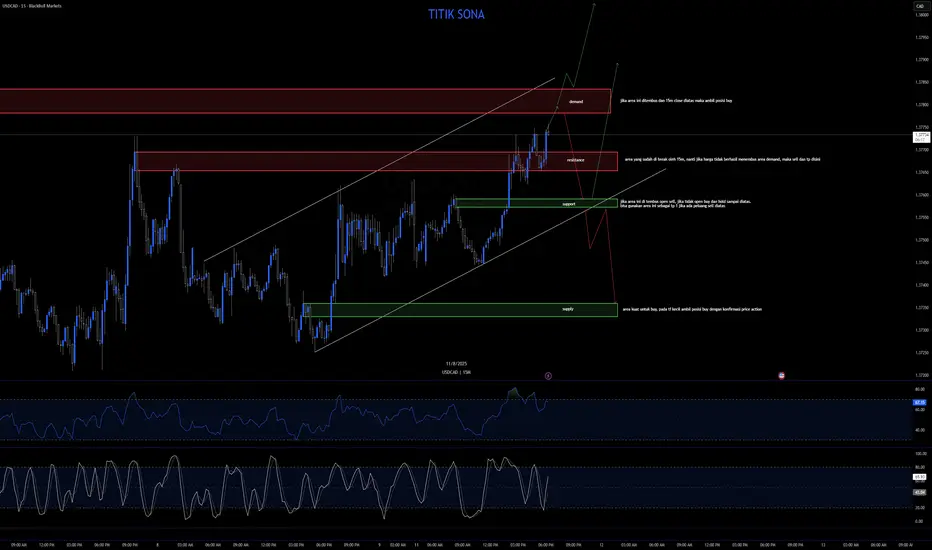
usdcad terlihat akan strong bullishConsider placing a buy stop in this area, as it represents a strong zone for potential upward movement. A confirmed breakout above this level could trigger further bullish momentum. However, if the price fails to break through and shows signs of rejection, shift your focus towards identifying selling opportunities instead.
USDCAD sell opportunity and potential weekly bearish closurePrice is playig around the H4 DAILY sell zone in red. Dollar TVC:DXY currently looking bearish not only technically but also fundamentally. By positive correlation DXY weakness means CMCMARKETS:USDCAD bearish. Of course if dollar shows bullish signs we will adapt. From now , looking to see a bearish weekly close above the WO price level.

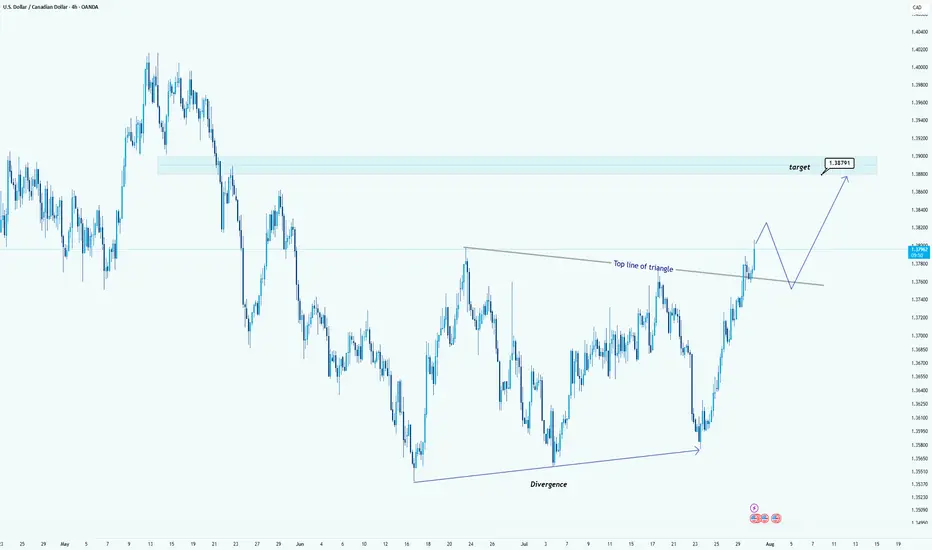
USD/CAD Breaks Triangle: Bullish Target in SightHello guys!
USD/CAD has broken out of a clear triangle formation, signaling strong bullish momentum. The breakout above the top line of the triangle, supported by earlier bullish divergence, confirms that buyers are now in control.
Triangle breakout confirmed
Strong bullish impulse post-breakout
Retest of the broken trendline expected
Target: 1.38791
A clean retest of the breakout level could provide another entry opportunity before price reaches the target zone highlighted in blue.
USDCAD: Bearish Continuation Setup from Premium SupplyGreetings Traders,
In today’s analysis of USDCAD, recent price action confirms the presence of bearish institutional order flow. This reaffirms our downside bias and positions us to seek high-probability selling opportunities.
Key Observations on H4:
Weekly Fair Value Gap Rejection: Last week, price rejected a weekly bearish FVG, aligning with the higher timeframe bearish draw toward discount liquidity.
Bearish Market Structure Shift: The H4 chart confirmed a market structure shift to the downside, signaling institutional alignment with the weekly timeframe.
Premium Bearish Order Block Confluence: Price has retraced into a premium-priced H4 bearish order block, which overlaps with an FVG—creating a strong institutional resistance zone.
Trading Plan:
Entry Strategy: Monitor lower timeframes (M15 and below) for bearish confirmation entries within the confluence zone.
Target Objective: Aim for the liquidity pools resting in discount pricing, in line with the overall bearish narrative.
For a detailed market walkthrough and in-depth execution zones, be sure to watch this week’s Forex Market Breakdown:
As always, remain patient, wait for confirmation, and manage your risk with precision.
Kind regards,
The Architect 🏛️📉

USD/CAD Bullish Heist Plan – Will You Join the Crew?💼💸 USD/CAD "The Loonie" – Bullish Vault Heist Plan 🕶️📈
"Layer the Entry. Stack the Cash. Escape Clean."
🧠 Mastermind Setup (Thief Trader Blueprint)
🔍 Asset: USD/CAD – The Loonie (Forex Market)
📜 Plan: Bullish — Thief is moving in with precision layering strategy.
📈 Entry Plan:
Thief’s not kicking the door once—he’s picking multiple locks!
Layer those buy limits for stealth entries:
(1.37700) 🏦 | (1.37500) 💰 | (1.37300) 🔑 | (1.37000) 🚪
💡 Add more layers if the vault’s deeper than expected.
🛑 Stop Loss (SL):
🎯 Official Thief SL parked @ 1.37000.
But remember—OG thieves adjust SL to match their risk appetite & personal strategy.
🎯 Target: 1.38680 – Grab the loot and vanish!
📢 Heist Intel (Market Context)
USD/CAD is eyeing upside momentum, powered by USD strength + oil price plays.
Expect pullbacks before the real breakout—perfect for layered infiltration.
⚠️ Thief’s Street Rules:
Don’t enter during high-impact news — guards will be on alert.
Use trailing stops to protect the loot once in profit.
Layer patiently—don’t rush the vault door.
💣 Final Words from the Crew:
Every pip is a coin in the bag. Stay disciplined, stay layered, and leave no trace. 🐱👤💎
💖 Boost the plan, share with the crew, and let’s make this Loonie Heist legendary. 🚀💼

USDCAD: Expecting Bearish Continuation! Here is Why:
The recent price action on the USDCAD pair was keeping me on the fence, however, my bias is slowly but surely changing into the bearish one and I think we will see the price go down.
Disclosure: I am part of Trade Nation's Influencer program and receive a monthly fee for using their TradingView charts in my analysis.
❤️ Please, support our work with like & comment! ❤️

USDCAD: Intraday Bullish Reversal 🇺🇸🇨🇦
USDCAD will likely go up, following a confirmed
bullish Change of Character CHoCH.
Next resistance is 1.3805
❤️Please, support my work with like, thank you!❤️
I am part of Trade Nation's Influencer program and receive a monthly fee for using their TradingView charts in my analysis.

USDCAD consolidation triggered by US inflation data The USDCAD remains in a bullish trend, with recent price action showing signs of a corrective pullback within the broader uptrend.
Support Zone: 1.3730 – a key level from previous consolidation. Price is currently testing or approaching this level.
A bullish rebound from 1.3730 would confirm ongoing upside momentum, with potential targets at:
1.3830 – initial resistance
1.3860 – psychological and structural level
1.3890 – extended resistance on the longer-term chart
Bearish Scenario:
A confirmed break and daily close below 1.3730 would weaken the bullish outlook and suggest deeper downside risk toward:
1.3716 – minor support
1.3690 – stronger support and potential demand zone
Outlook:
Bullish bias remains intact while the WTI Crude holds above 1.3730. A sustained break below this level could shift momentum to the downside in the short term.
This communication is for informational purposes only and should not be viewed as any form of recommendation as to a particular course of action or as investment advice. It is not intended as an offer or solicitation for the purchase or sale of any financial instrument or as an official confirmation of any transaction. Opinions, estimates and assumptions expressed herein are made as of the date of this communication and are subject to change without notice. This communication has been prepared based upon information, including market prices, data and other information, believed to be reliable; however, Trade Nation does not warrant its completeness or accuracy. All market prices and market data contained in or attached to this communication are indicative and subject to change without notice.