USDCAD: Strong Bearish Signal?!The 📈USDCAD pair appears to be bullish following more than a month of consolidation.
The bullish breakout from a sideways range support serves as a strong confirmation signal.
Indicating an expected upward movement towards at least the 1.3950 support level.
USDCAD trade ideas

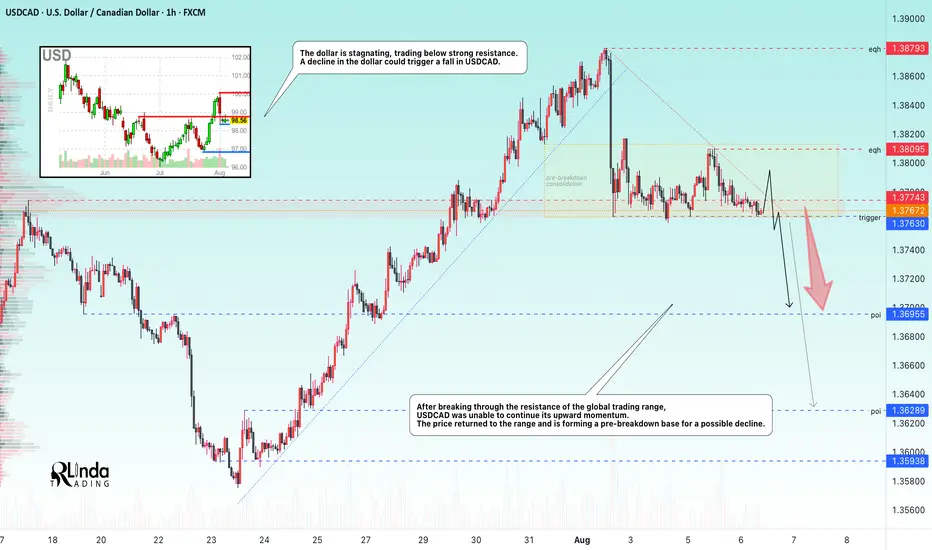
USDCAD → Short squeeze for further declineFX:USDCAD is forming another short squeeze relative to the global price range ahead of a possible decline within the global downtrend.
After breaking through the resistance of the global trading range, USDCAD was unable to continue its upward momentum. The price returned to the range, under strong resistance, and is forming a pre-breakdown base for a possible decline. The trigger in our case is support at 1.3762. The dollar is stagnating, trading below strong resistance. A decline in the dollar could trigger a fall in USDCAD
Support levels: 1.376, 1.3695, 1.3629
Resistance levels: 1.3774, 1.3809
The market structure is quite weak, both globally and locally. In addition, against the backdrop of an expected rate cut, the dollar may continue its downward global trend, which may also affect the price of the currency pair, which has formed a false breakout of resistance...
Best regards, R. Linda!
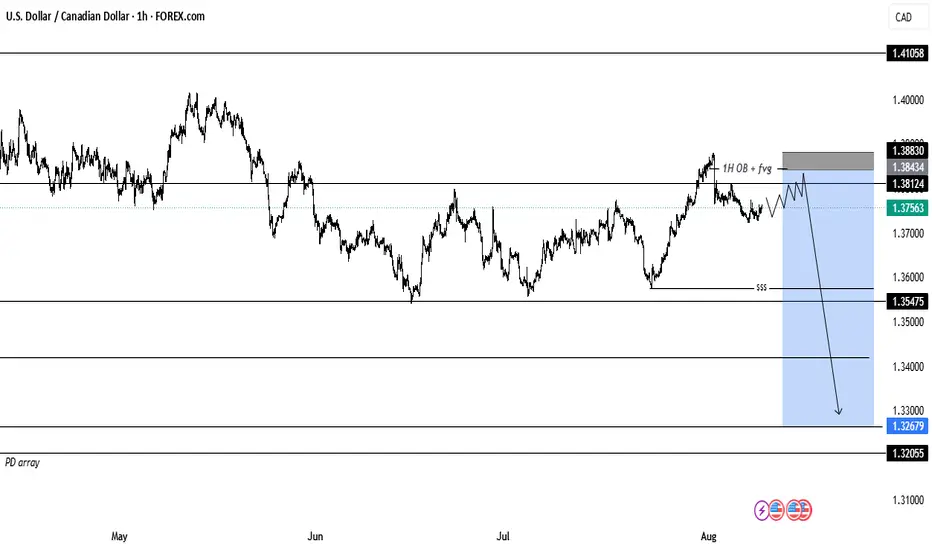
USDCAD 1H sell analysislooking for sell opportunities if/when the market hits the 1H order block + fvg area
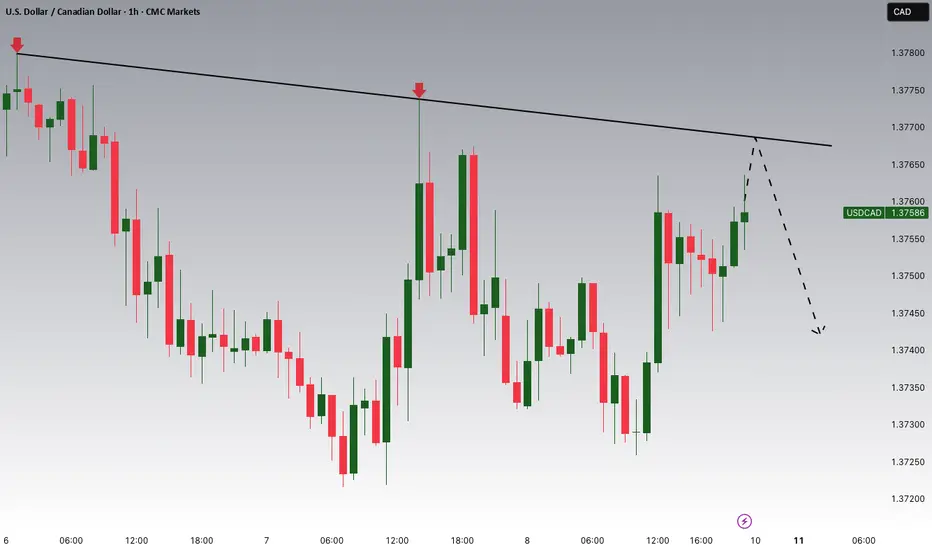
USDCAD Potential DownsidesHey Traders, in the coming week we are monitoring USDCAD for a selling opportunity around 1.37700 zone, USDCAD is trading in a downtrend and currently is in a correction phase in which it is approaching the trend at 1.37700 support and resistance area.
Trade safe, Joe.
USDCADPossible Short, head and shoulder with target matching with fibo levels, i can see down channels

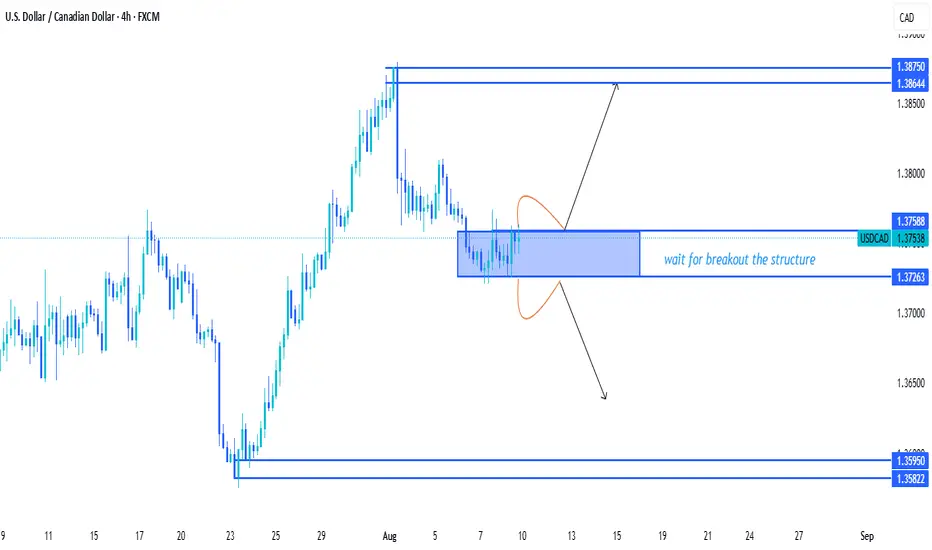
USDCAD TRADE SETUPWait for breakout the structure then take a trade for Market bias otherwise skip this setup
USDCAD BUY!!Strong signs of a bullish market, Triple bottom , break of the last market high, now a clear retest and price is moving towards the daily FVG.

USD/CAD – Possible Pullback on the RadarThis pair is forming a potential pullback setup that we’re keeping a close eye on.
The support zone is decent, but not ideal — which means we’ll need to see extra confirmation from both volume and momentum before considering a trade.
As always, every part of the VMS strategy must align before we take action. Until then, it stays on the watchlist.
Discipline over impulse. Patience over prediction.

usdcadpotentially trading USDCAD down to discount pricing and then waiting to look for longs if daily orderflow stays bullish

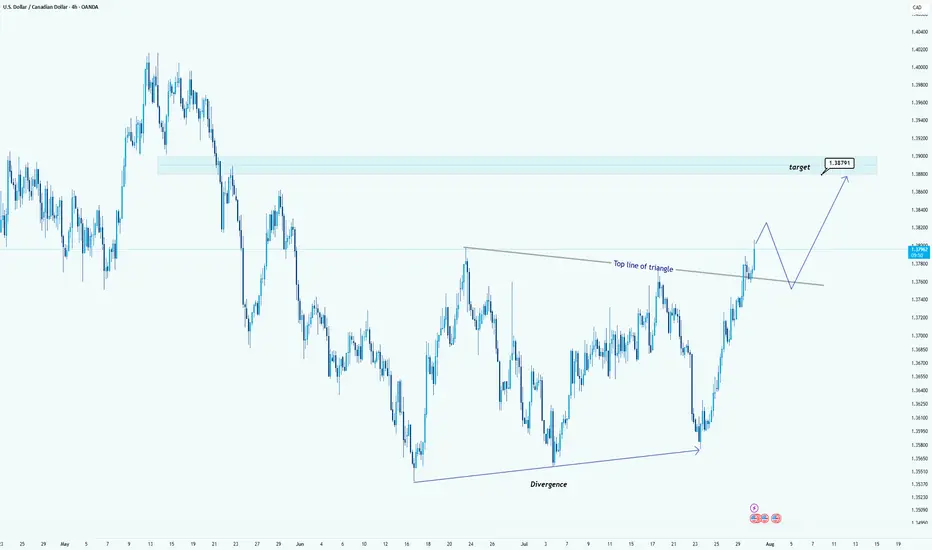
USD/CAD Breaks Triangle: Bullish Target in SightHello guys!
USD/CAD has broken out of a clear triangle formation, signaling strong bullish momentum. The breakout above the top line of the triangle, supported by earlier bullish divergence, confirms that buyers are now in control.
Triangle breakout confirmed
Strong bullish impulse post-breakout
Retest of the broken trendline expected
Target: 1.38791
A clean retest of the breakout level could provide another entry opportunity before price reaches the target zone highlighted in blue.
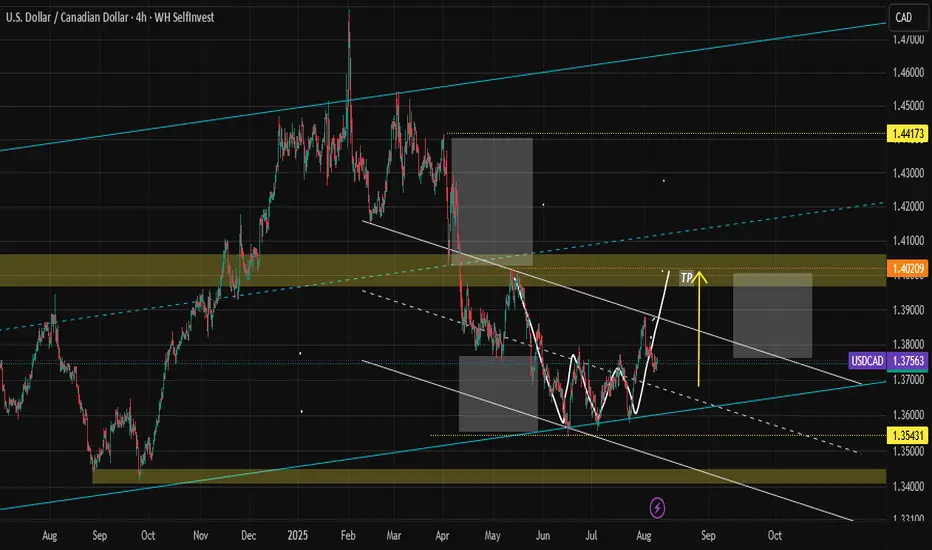
USDCADProbability of reaching the TP (rise to the 1.4020 area): about 65% to 70%
Probability of reversal before reaching the TP: about 30% to 35%
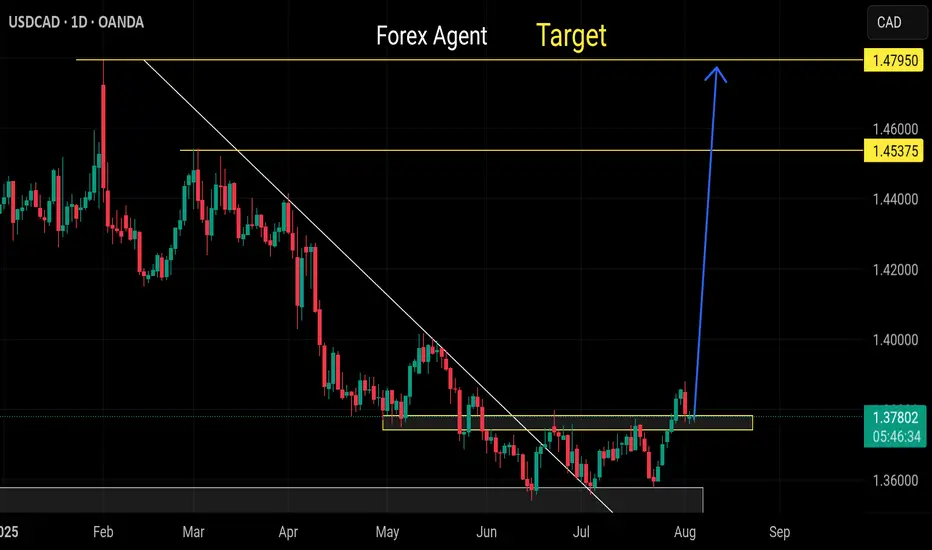
USDCAD Will Go Down! Short!
Take a look at our analysis for USDCAD.
Time Frame: 1D
Current Trend: Bearish
Sentiment: Overbought (based on 7-period RSI)
Forecast: Bearish
The price is testing a key resistance 1.378.
Taking into consideration the current market trend & overbought RSI, chances will be high to see a bearish movement to the downside at least to 1.362 level.
P.S
The term oversold refers to a condition where an asset has traded lower in price and has the potential for a price bounce.
Overbought refers to market scenarios where the instrument is traded considerably higher than its fair value. Overvaluation is caused by market sentiments when there is positive news.
Disclosure: I am part of Trade Nation's Influencer program and receive a monthly fee for using their TradingView charts in my analysis.
Like and subscribe and comment my ideas if you enjoy them!

Market Insights with Gary Thomson: 4 - 8 AugustMarket Insights with Gary Thomson: BoE Interest Rate, Canada Jobs Data & Earnings Reports
In this video, we’ll explore the key economic events, market trends, and corporate news shaping the financial landscape. Get ready for expert insights into forex, commodities, and stocks to help you navigate the week ahead. Let’s dive in!
In this episode of Market Insights, Gary Thomson unpacks the strategic implications of the week’s most critical events driving global markets.
👉 Key topics covered in this episode:
— BoE Interest Rate Decision
— Unemployment Rate in Canada
— Corporate Earnings Statements
— Trade Tensions
Gain insights to strengthen your trading knowledge.
This video represents the opinion of the Companies operating under the FXOpen brand only. It is not to be construed as an offer, solicitation, or recommendation with respect to products and services provided by the Companies operating under the FXOpen brand, nor is it to be considered financial advice.

USD/CAD Poised for a Bullish Breakout: All Eyes on 1.41
ه
---
🚀 **
The BAT formation is checking every box—whether you’re analyzing the correction of point **C from AB** or a deeper retracement of **B from XA**, the technical structure is screaming potential.
📊 **Fibonacci Magic**
We’ve got confluence across key Fib levels, with the final projection targeting **1.41**, a crucial resistance that aligns with multiple technical cues.
📉 **Bearish Trendline AC? Consider It Challenged.**
A decisive breach above the descending **AC trendline** would be a powerful confirmation of bullish momentum—and the market’s intent to rally.
⚠️ **Risk Strategy**
The setup remains valid as long as price holds **above point X**. A protective stop-loss below X keeps the trade clean and controlled.
🎯 **Trade Outlook**
With a solid harmonic base, technical alignment across retracement zones, and trendline pressure building, USD/CAD could be gearing up for an aggressive move north. It’s not just a chart—it’s a story, and right now, the plot points to 1.41.
---

Usdcad buy Remain strong bullish
Trend broken
Respecting its support level wait for LTF confirmation the. Straight buy

Strong buy usdcadOur last buying idea already running 200+ pips
More bullish correction expected
Daily down trend breaks
Respecting fresh support level
800+ pips minimum target

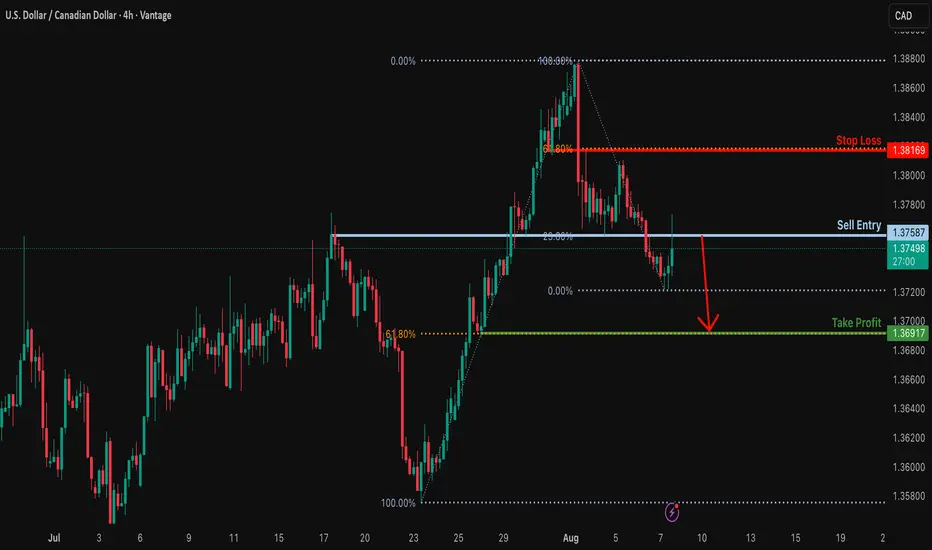
Potential bearish drop?The Loonie (USD/CAD) is reacting off the resistance levl which is an overlap resistance that lines up with the 23.6% Fibonacci retracement and could drop from this level to our take profit.
Entry: 1.3758
Why we like it:
There is an overlap resistance level that lines up with the 23.6% Fibonacci retracement.
Stop loss: 1.3816
Why we like it:
There is a pullback resistance level that aligns with the 61.8% Fibonacci retracement.
Take profit: 1.3691
Why we like it:
There is a pullback support level that aligns with the 61.8% Fibonacci retracement.
Enjoying your TradingView experience? Review us!
Please be advised that the information presented on TradingView is provided to Vantage (‘Vantage Global Limited’, ‘we’) by a third-party provider (‘Everest Fortune Group’). Please be reminded that you are solely responsible for the trading decisions on your account. There is a very high degree of risk involved in trading. Any information and/or content is intended entirely for research, educational and informational purposes only and does not constitute investment or consultation advice or investment strategy. The information is not tailored to the investment needs of any specific person and therefore does not involve a consideration of any of the investment objectives, financial situation or needs of any viewer that may receive it. Kindly also note that past performance is not a reliable indicator of future results. Actual results may differ materially from those anticipated in forward-looking or past performance statements. We assume no liability as to the accuracy or completeness of any of the information and/or content provided herein and the Company cannot be held responsible for any omission, mistake nor for any loss or damage including without limitation to any loss of profit which may arise from reliance on any information supplied by Everest Fortune Group.
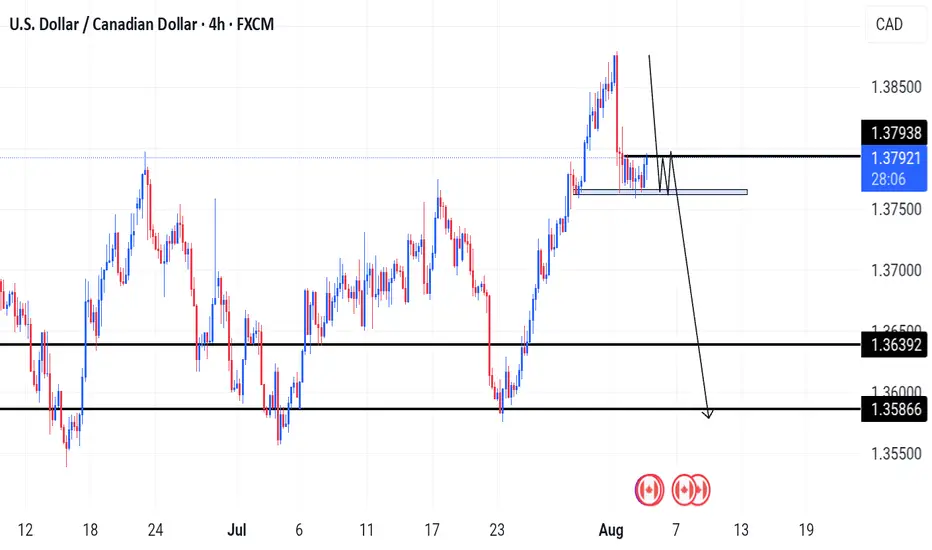
USDCAD MM triggered a false breakout to fallMM provoked a false breakout of the resistance range; there is no continuation of the upward momentum. The price has returned to the range and is forming a consolidation, the goal of which may be to accumulate potential for the continuation of the downward movement.
The market has a strong downward trend structure. After a false breakout of resistance, MM has the potential to move the price down. The target is the liquidity area consisting of a cascade bottom: 1.357, 1.355, 1.354.

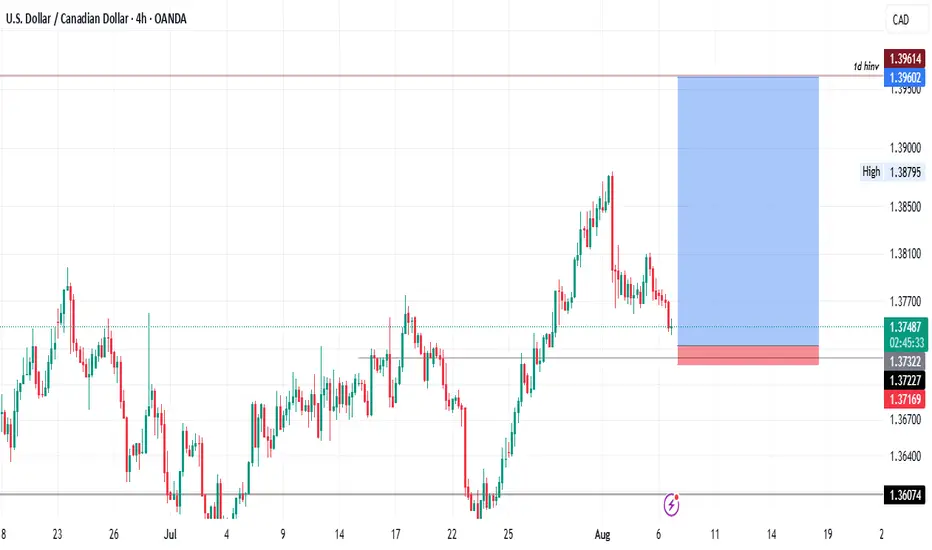
USDCAD drop to order block?Hello traders, this is a complete multiple timeframe analysis of this pair. We see could find significant trading opportunities as per analysis upon price action confirmation we may take this trade. Smash the like button if you find value in this analysis and drop a comment if you have any questions or let me know which pair to cover in my next analysis.

USDCAD- In the monthly (higher timeframes), USDCAD is bullish.
- In the weekly timeframe, price reaction seems to trace a clear uptrend
- In the daily timeframe, it is also in a clear uptrend but at retracement phase due to a hidden 1 day invalidation.
- With our current 4hr timeframe we are tracing for low risk (15 Pips) high reward of up to 1:15 on the trade.
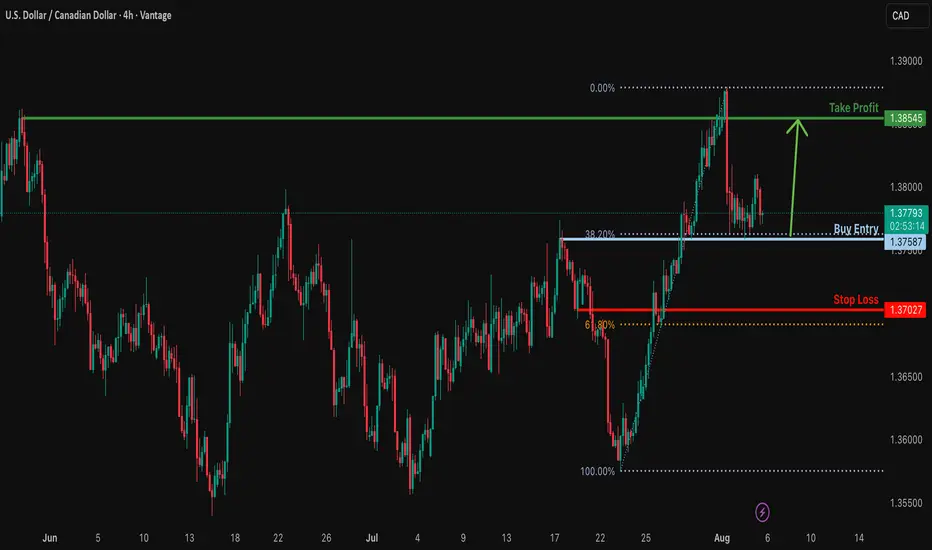
Bullish bounce off for the Loonie?The price is falling towards the support which is a pullback support that aligns with the 38.2% Fibonacci retracement and could bounce from this level to our take profit.
Entry: 1.3758
Why we like it:
There is a pullback support that lines up with the 38.2% Fibonacci retracement.
Stop loss: 1.3702
Why we like it:
There is a pullback support that is slightly above the 61.8% Fibonacci retracement.
Take profit: 1.3854
Why we like it:
There is a pullback resistance.
Enjoying your TradingView experience? Review us!
Please be advised that the information presented on TradingView is provided to Vantage (‘Vantage Global Limited’, ‘we’) by a third-party provider (‘Everest Fortune Group’). Please be reminded that you are solely responsible for the trading decisions on your account. There is a very high degree of risk involved in trading. Any information and/or content is intended entirely for research, educational and informational purposes only and does not constitute investment or consultation advice or investment strategy. The information is not tailored to the investment needs of any specific person and therefore does not involve a consideration of any of the investment objectives, financial situation or needs of any viewer that may receive it. Kindly also note that past performance is not a reliable indicator of future results. Actual results may differ materially from those anticipated in forward-looking or past performance statements. We assume no liability as to the accuracy or completeness of any of the information and/or content provided herein and the Company cannot be held responsible for any omission, mistake nor for any loss or damage including without limitation to any loss of profit which may arise from reliance on any information supplied by Everest Fortune Group.
USDCADOANDA:USDCAD price overall is bullish but since there's no liquidity above after that distribution we're most likely to see a sell. But anything can happen we'll see it goes but you guys do let me know what you think on the comment session 💯🤔 your ideas matter to me.