Running Flat FormationHere we have a Running Flat Formation. At point C it looks to me that price has broken the small upward trend it was in and has imprinted a H&S formation and broken to the downside. I'm waiting for a retest on the previous new structure low (NSL) before taking an entry.
USDCAD trade ideas

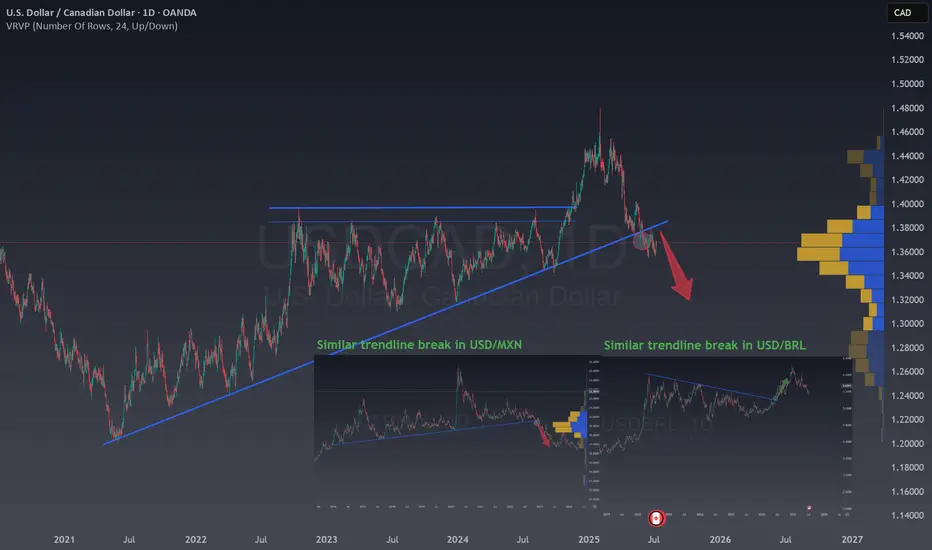
The importance of trendlines in FOREXIn the world of currencies or FOREX, there are certain entry points that only happen a few times a year , but they’re incredibly powerful . These opportunities come after a trend breaks, a trend that has been touched and confirmed as a support or resistance zone over several years.
Right now, with OANDA:USDCAD , we’re seeing a break and pullback to one of these long-term trends. That makes this a great moment to go short on this pair.
Let me share a couple of examples with USDBRL and USDMXN. In both cases, after similar long-term trends were broken, the price moved strongly in one direction, these are the kinds of moves that can really grow your account.
There are other pairs showing similar breakouts.
Have you spotted them? If not, leave a comment and I’ll share the other pairs with you!
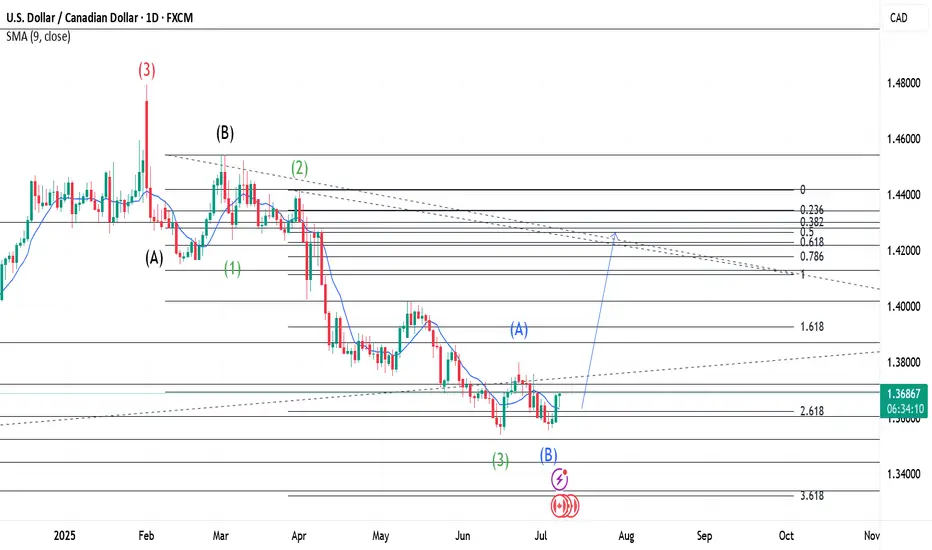
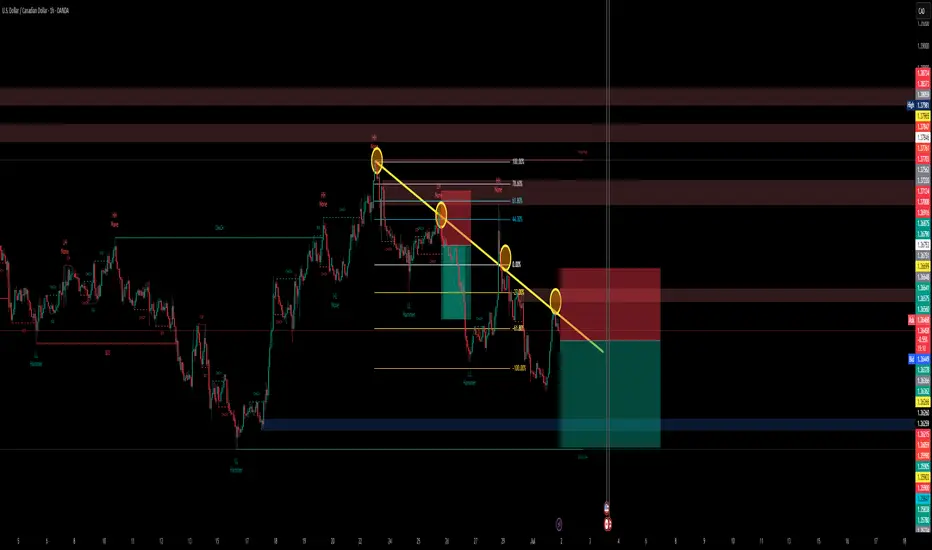
USDCAD obeying Elliott Wave Principles.Our D1 chart is a continuation of a wave that started earlier and had a Flat correction for its Wave 2(Red), hence a Zigzag should be expected for our Wave 4(Red). When Wave 3(Red) completes, an aggressive selling move is triggered this is our Wave A(Black). A correction of this move occurs in the form of a Flat and this is now our Wave B(Black) of the major Zigzag correction that started when Wave 3(Red) completed. When Wave B(Black) is done, we should expect a Wave C(Black) to complete the Zigzag. Our Wave C(Black) unfolds in a 5 wave move and this is very normal. This 5 wave move is marked in Green. When Wave 1(Green) completes, our Wave 2(Green) unfolds in a Flat correction, meaning our Wave 4(Green) should be a Zigzag correction. After Wave 2(Green) completes, Wave 3(Green) is a strong downward move that reaches the 261.8% Fib. level. On reaching this level, we see a retest and a confirmation occurring. This is is to signal the end of Wave 3(Green) and the start of Wave 4(Green). As mentioned earlier, we should expect a Zigzag correction for Wave (Green) and we can see a shallow pullback and retest. The pullback is our first wave of the three wave Zigzag and is marked as Wave A(Blue). The retest as noted, does not go beyond Wave 3(Green) and this confirms it is a Zigzag. This retest is marked as Wave B(Blue). Next would be a Wave C(Blue) to complete Wave 4(Green). A retest and confirmation gives us an entry for the Wave C(Blue) which is also Wave 4(Green).
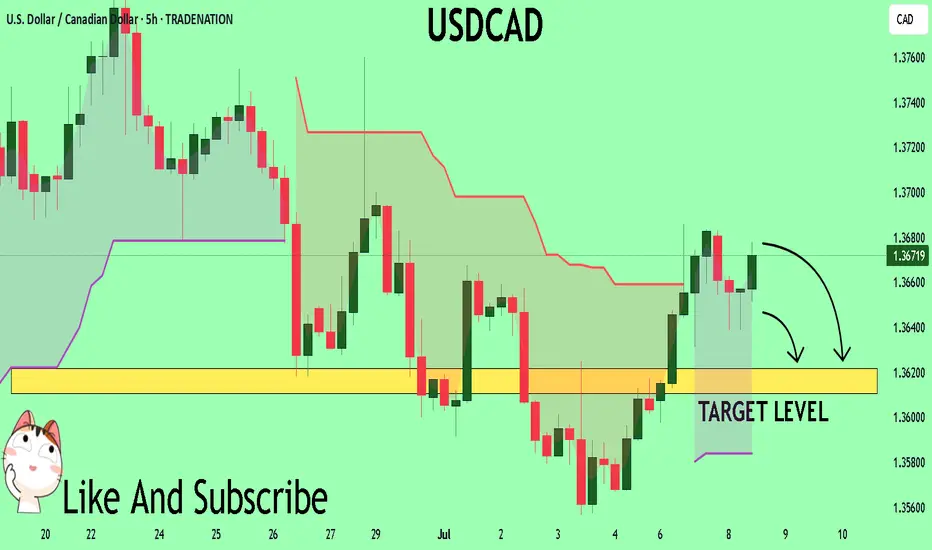
USDCAD My Opinion! SELL!
My dear friends,
Please, find my technical outlook for USDCAD below:
The price is coiling around a solid key level - 1.3669
Bias - Bearish
Technical Indicators: Pivot Points High anticipates a potential price reversal.
Super trend shows a clear sell, giving a perfect indicators' convergence.
Goal - 1.3621
About Used Indicators:
The pivot point itself is simply the average of the high, low and closing prices from the previous trading day.
Disclosure: I am part of Trade Nation's Influencer program and receive a monthly fee for using their TradingView charts in my analysis.
———————————
WISH YOU ALL LUCK
USDCAD AnalysisPrice broke the descending trendline and is forming a base above the 1.36422 support zone. This may signal a bullish continuation targeting 1.36828 and 1.37093.
⚠️ Invalidation: Break below 1.36215 cancels the idea.
This is a market idea, not a signal.

USD/CAD) Down Trand Read The captionSMC trading point update
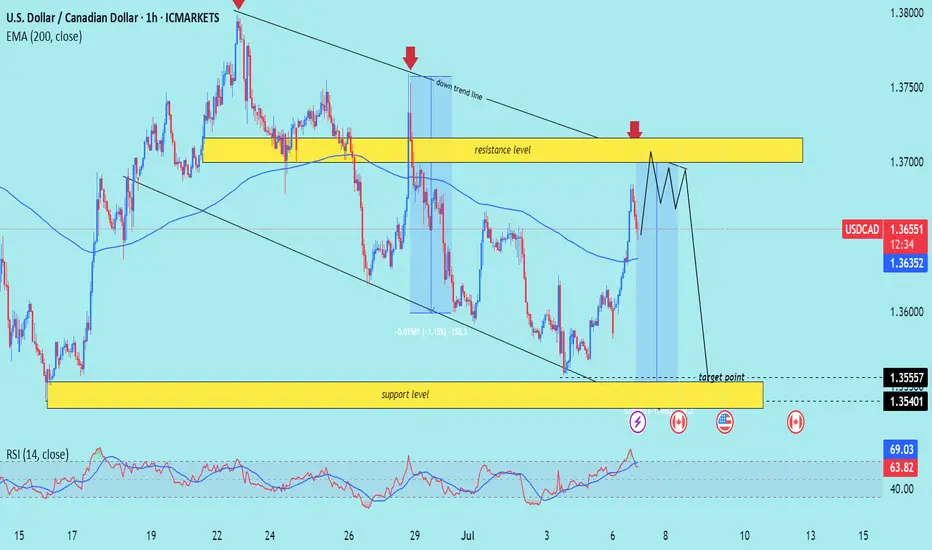
Technical analysis of USD/CAD (U.S. Dollar / Canadian Dollar) on the 1-hour timeframe, with a focus on a potential double-top formation at strong resistance, followed by a drop toward support:
---
Analysis Overview
Trend Structure: Downward-sloping channel with lower highs and lower lows.
Confluence Area: The current rally is approaching both the upper channel boundary and a significant horizontal resistance zone (~1.3660–1.3700).
---
Key Technical Elements
1. Resistance & Double-Top Setup
The price nears the resistance zone (yellow) where it previously reversed (noted by red arrows).
A cap-and-float pattern (double/top-like structure) is projected: price pushes higher, hesitates, tests resistance again, then fails—a sign of weakening bullish momentum.
2. EMA 200 Interaction
The 1-hour EMA 200 (blue line at ~1.3635) sits just below current price.
A failure to sustain above this level reinforces the bearish case.
3. RSI Overextension
RSI (14) is around 64–69, indicating near-overbought conditions on this timeframe, suggesting a potential pullback.
4. Price Targets
Initial target: Lower channel boundary near 1.3556 (highlighted support).
Extended target: Beneath to 1.3540, aligning with the broader Demand zone.
---
Proposed Trade Setup
Step Action Level
Entry Short near top of resistance/channel (after double-top confirmation) 1.3680–1.3700
Stop-Loss Above recent high and channel resistance ~1.3720
Take Profit 1 Near EMA 200/lower channel bounce ~1.3556
Take Profit 2 Extended move to demand zone ~1.3540
Estimated Move ~1.15% drop from midday highs –
---
Risk & Event Factors
Scheduled Canadian or U.S. data releases (icons shown) could introduce volatility and disrupt technical patterns.
A breakout above ~1.3720 would invalidate this bearish thesis and shift bias bullish.
Mr SMC Trading point
---
Summary
Expecting a cap-and-float double-top formation at key resistance near 1.3660–1.3700, followed by a trend continuation drop toward 1.3556–1.3540. The bearish setup is supported by a down-channel structure, EMA 200 failure, and overbought RSI conditions.
Please support boost 🚀 this analysis)
USDCAD Bullish RallyGet ready to buy USDCAD. Falling channel breakout and retest. Price should escalate after breaking below 1,36312. Aiming for 1,37 and 1,1376
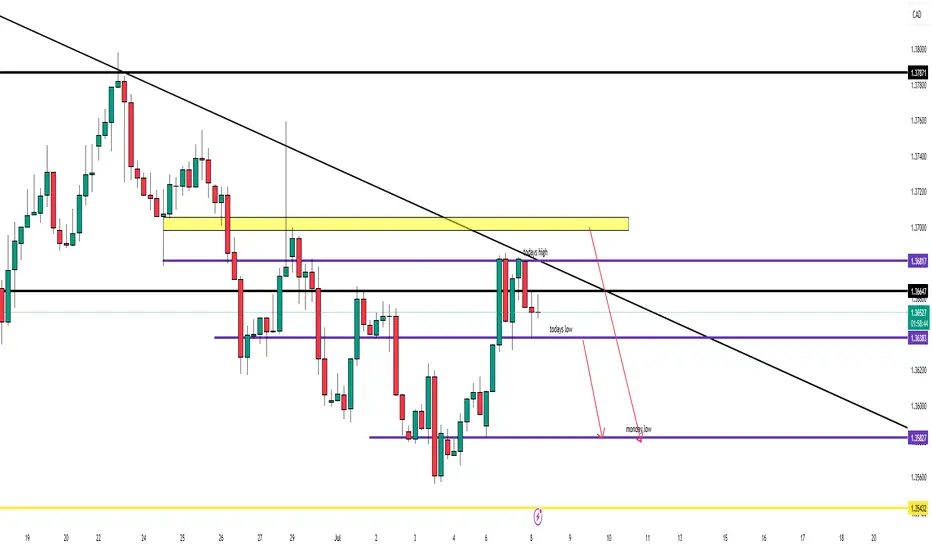
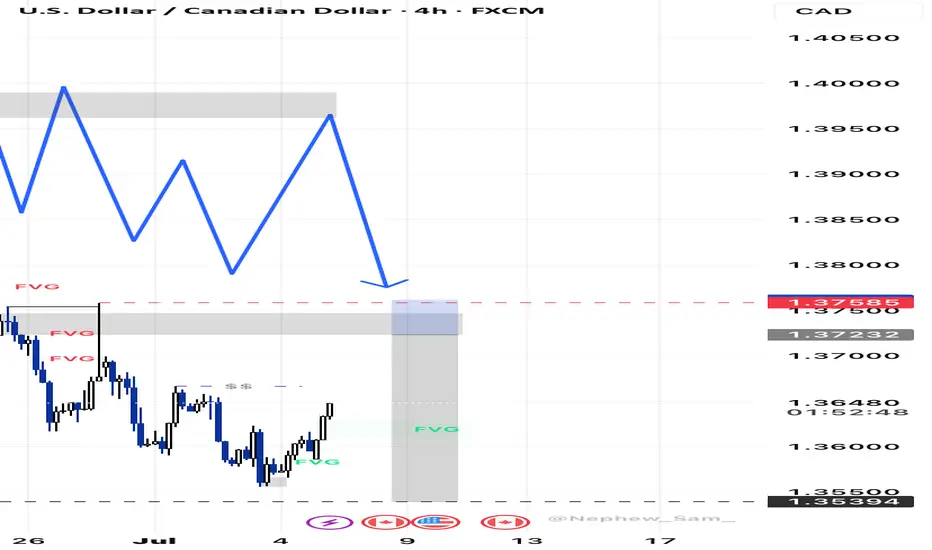
🇨🇦 USDCAD – July 8 | Trendline Test and Liquidity WatchYesterday USDCAD closed strong bullish (+100 pips) into the March 2024 trendline, which it’s respected multiple times this year.
But there’s a key detail:
➡️ Today’s high is a pip away from yesterday’s — and there’s no upper wick.
That makes this a liquidity risk zone.
📌 What I’m watching:
🔻 Break of 1.36383 = potential shift to bearish intraday structure
→ First target: 1.35827 (yesterday’s low)
→ Then: 1.35432 for swing sell continuation
🔺 Small liquidity grab above today's high possible before drop
🧭 Bias: Bearish on daily + higher timeframes
🎯 Waiting for confirmation, not assumption
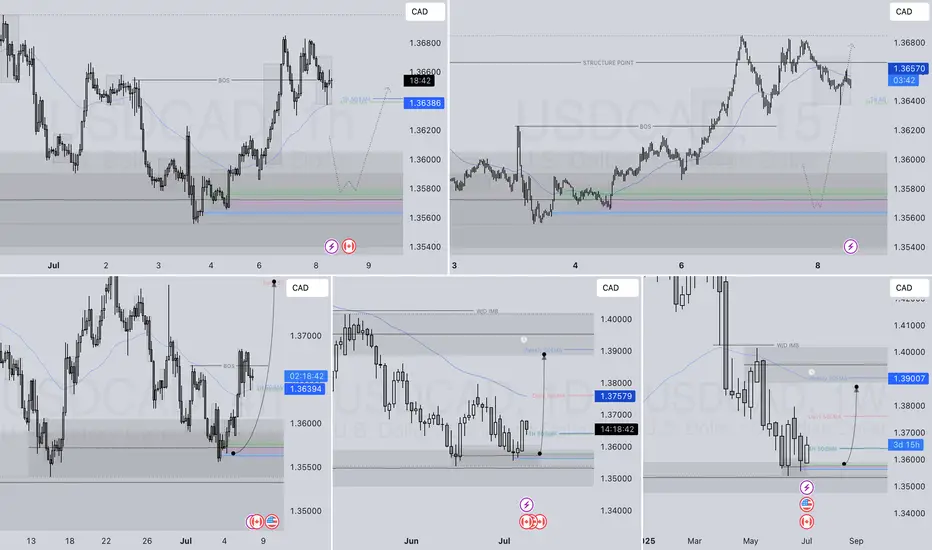
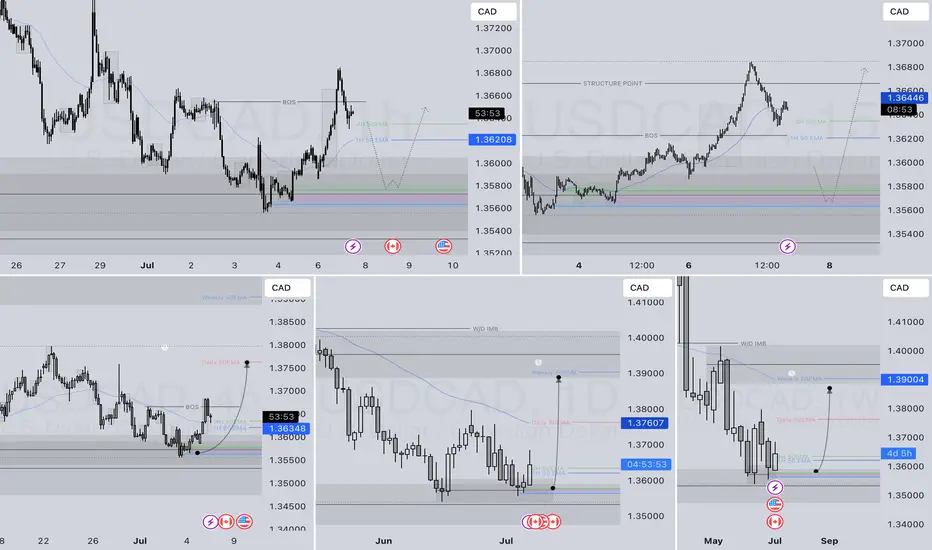
USDCAD LONG DAILY FORECAST Q3 D8 W28 Y25USDCAD LONG DAILY FORECAST Q3 D8 W28 Y25
Professional Risk Managers👋
Welcome back to another FRGNT chart update📈
Diving into some Forex setups using predominantly higher time frame order blocks alongside confirmation breaks of structure.
Let’s see what price action is telling us today! 👀
💡Here are some trade confluences📝
✅Daily Order block identified
✅4H Order Block identified
✅1H Order Block identified
🔑 Remember, to participate in trading comes always with a degree of risk, therefore as professional risk managers it remains vital that we stick to our risk management plan as well as our trading strategies.
📈The rest, we leave to the balance of probabilities.
💡Fail to plan. Plan to fail.
🏆It has always been that simple.
❤️Good luck with your trading journey, I shall see you at the very top.
🎯Trade consistent, FRGNT X
Potential bearish drop?The Loonie (USD/CAD) has rejected off the pivot, which has been identified as an overlap resistance and could drop to the 61.8% Fibonacci support.
Pivot: 1.3688
1st Support: 1.3599
1st Resistance: 1.3743
Risk Warning:
Trading Forex and CFDs carries a high level of risk to your capital and you should only trade with money you can afford to lose. Trading Forex and CFDs may not be suitable for all investors, so please ensure that you fully understand the risks involved and seek independent advice if necessary.
Disclaimer:
The above opinions given constitute general market commentary, and do not constitute the opinion or advice of IC Markets or any form of personal or investment advice.
Any opinions, news, research, analyses, prices, other information, or links to third-party sites contained on this website are provided on an "as-is" basis, are intended only to be informative, is not an advice nor a recommendation, nor research, or a record of our trading prices, or an offer of, or solicitation for a transaction in any financial instrument and thus should not be treated as such. The information provided does not involve any specific investment objectives, financial situation and needs of any specific person who may receive it. Please be aware, that past performance is not a reliable indicator of future performance and/or results. Past Performance or Forward-looking scenarios based upon the reasonable beliefs of the third-party provider are not a guarantee of future performance. Actual results may differ materially from those anticipated in forward-looking or past performance statements. IC Markets makes no representation or warranty and assumes no liability as to the accuracy or completeness of the information provided, nor any loss arising from any investment based on a recommendation, forecast or any information supplied by any third-party.

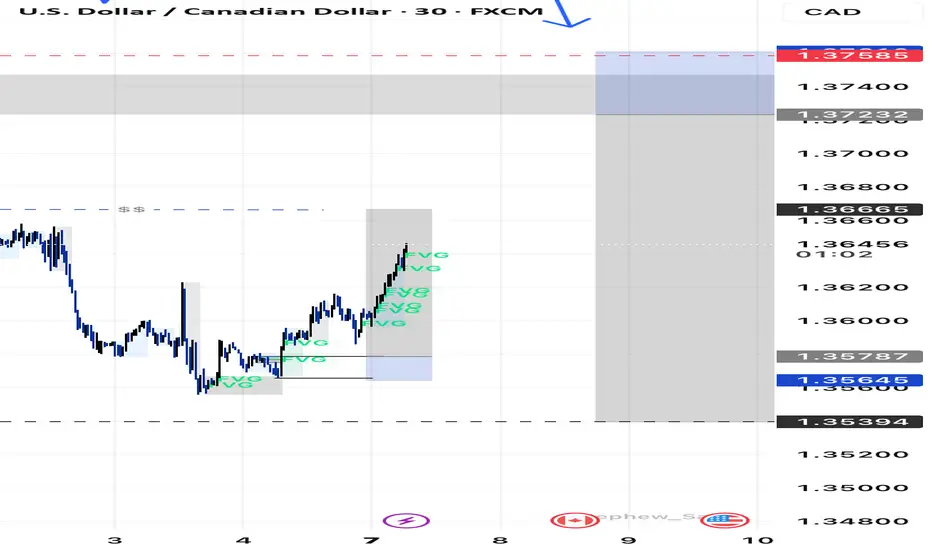
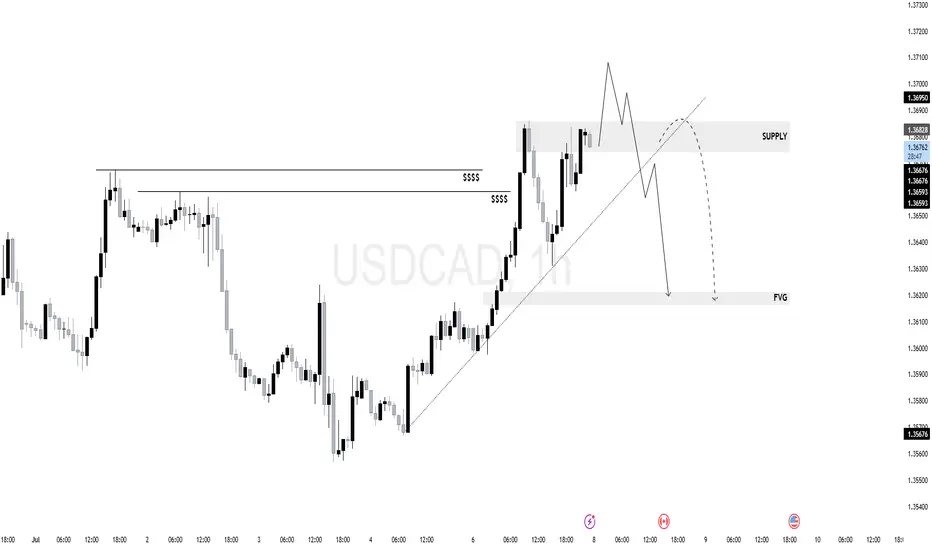
$UC (USDCAD) 1H Liquidity has been swept. Supply has been met.
The price entered a previously established supply area (1.36950–1.36700) and showed early signs of rejection
The break of the short-term trendline coupled with price failing to hold above the highs could signal a shift in structure toward a bearish leg.
If the rejection confirms, price is likely to seek rebalancing at the FVG below (1.36200–1.36000 zone).
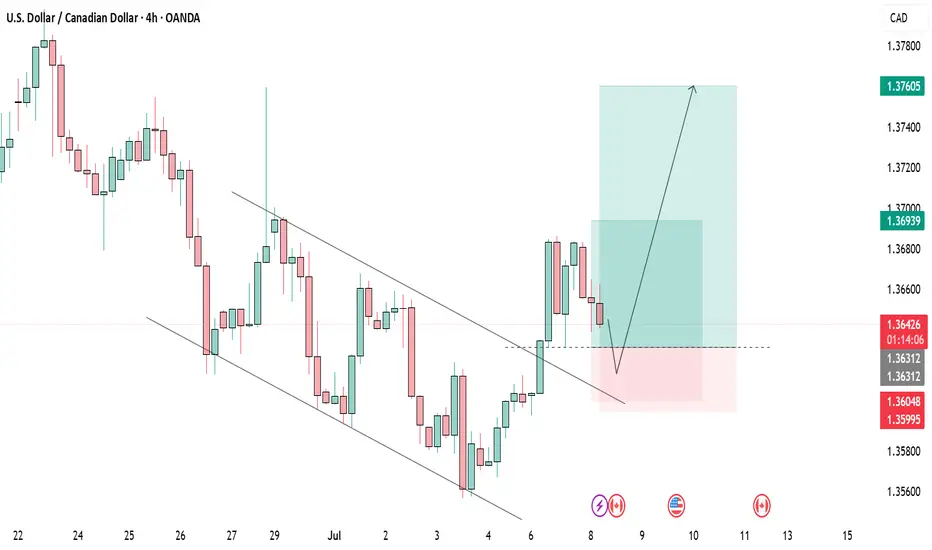
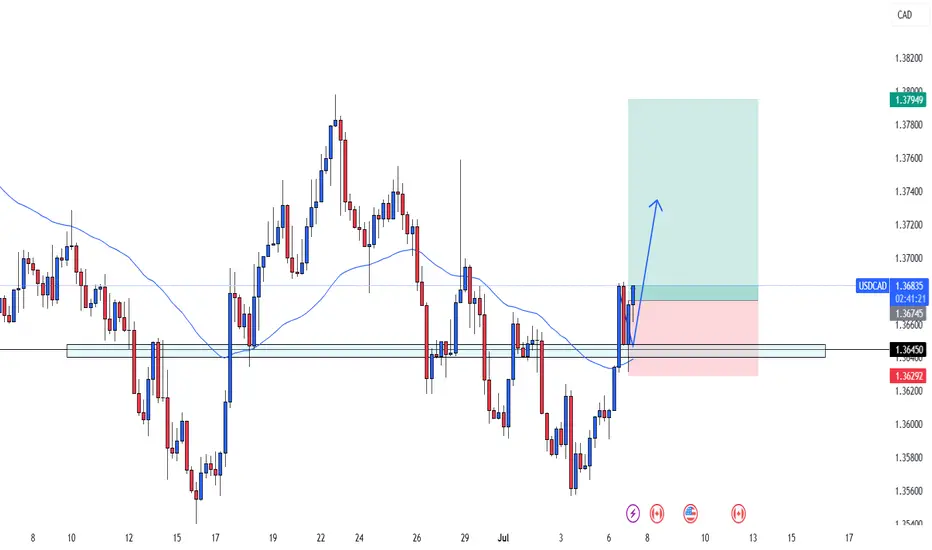
USDCAD buyThe USDCAD 4-hour chart shows a potential long setup, but it comes with increased risk. Price has recently broken above a key resistance-turned-support level and is now pulling back for a possible retest. This could trigger a bullish continuation, especially with the 50 EMA now below price, supporting upward momentum.
However, the setup is riskier because the breakout is still fresh, and there's a chance price could dip back below the support zone.
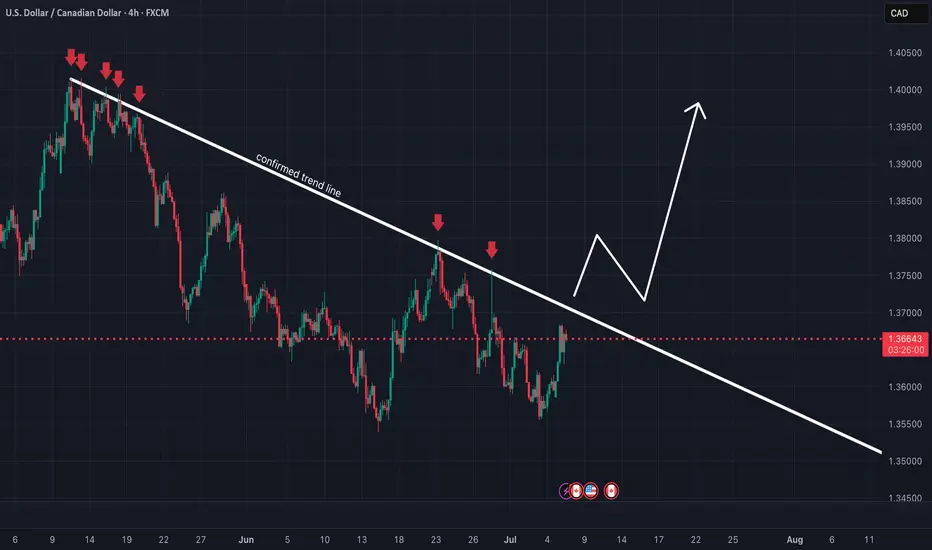
Potential Long Position on USDCADReasons I think this pair will rise:
- Confirmed trend line means harder breakout potential.
- Price printed a double bottom.
- Bullish RSI divergence on H4
- RSI oversold on H4
What do you think?
USDCAD Potential UpsidesHey Traders, in tomorrow's trading session we are monitoring USDCAD for a buying opportunity around 1.35750 zone, USDCAD is trading in an uptrend and currently is in a correction phase in which it is approaching the trend at 1.35750 support and resistance area.
Trade safe, Joe.
USDCAD LONG DAILY FORECAST Q3 W28 Y25USDCAD LONG DAILY FORECAST Q3 W28 Y25
Professional Risk Managers👋
Welcome back to another FRGNT chart update📈
Diving into some Forex setups using predominantly higher time frame order blocks alongside confirmation breaks of structure.
Let’s see what price action is telling us today! 👀
💡Here are some trade confluences📝
✅Daily Order block identified
✅4H Order Block identified
✅1H Order Block identified
🔑 Remember, to participate in trading comes always with a degree of risk, therefore as professional risk managers it remains vital that we stick to our risk management plan as well as our trading strategies.
📈The rest, we leave to the balance of probabilities.
💡Fail to plan. Plan to fail.
🏆It has always been that simple.
❤️Good luck with your trading journey, I shall see you at the very top.
🎯Trade consistent, FRGNT X
Buy USDCADUSDCAD falling channel breakout on display. Price broke upwards with strong bullish momentum, and has since been reversing for the past few hours. Soon, the bulls will continue

USD /CAD) bearish reversal analysis Read The captionSMC trading point update
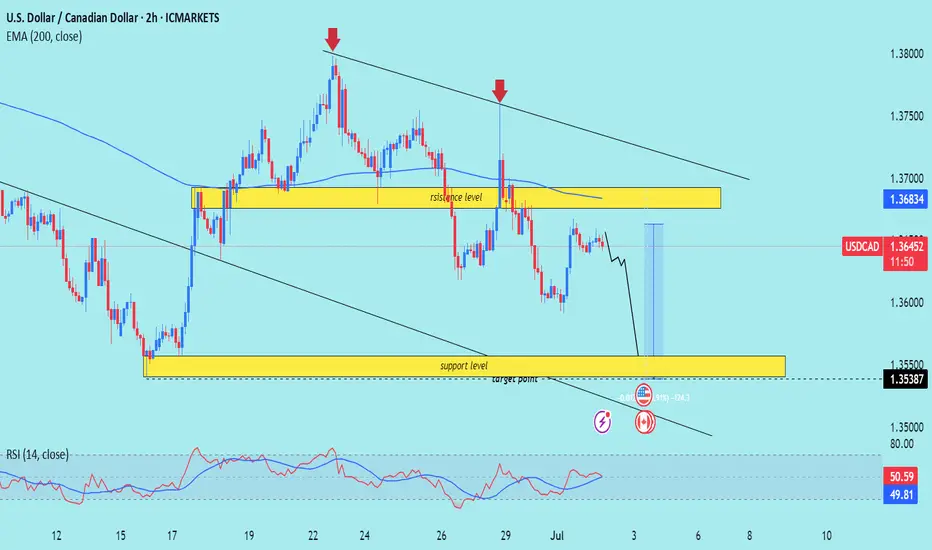
Technical analysis of USD/CAD pair on the 2-hour timeframe, suggesting that the price is likely to drop toward the support zone. Here's the detailed idea behind the analysis:
---
Chart Breakdown (2H – USD/CAD)
1. Resistance Zone (Yellow Box - Top):
Marked as a strong supply area where price has repeatedly been rejected (highlighted by red arrows).
Acts as a key zone where sellers are in control.
Also aligns with a descending trendline, reinforcing bearish pressure.
2. Support Zone (Yellow Box - Bottom):
This is the target point marked at 1.35387, which previously served as a demand zone.
The chart suggests this level as the next significant area where price might find buyers.
3. Trend Context:
Price is moving within a descending channel (black trendlines), confirming the overall downtrend.
The 200 EMA (1.36834) is acting as dynamic resistance, keeping price under pressure.
4. Projected Move (Blue Box):
Shows a potential drop of ~91 pips toward the support level.
A bearish wave is anticipated as per the black zigzag line on the chart.
5. RSI Indicator:
RSI is near neutral (49.02 and 49.70) — suggesting no overbought/oversold conditions, but confirming lack of bullish momentum.
RSI is aligned with price trending down.
Mr SMC Trading point
---
Summary:
Bias: Bearish
Entry Zone: Near current price or minor pullback (1.364–1.365)
Target: 1.35387 (support zone)
Invalidation: Break and close above resistance level / 200 EMA (~1.3685)
Trend: Downtrend within channel
---
Please support boost 🚀 analysis)
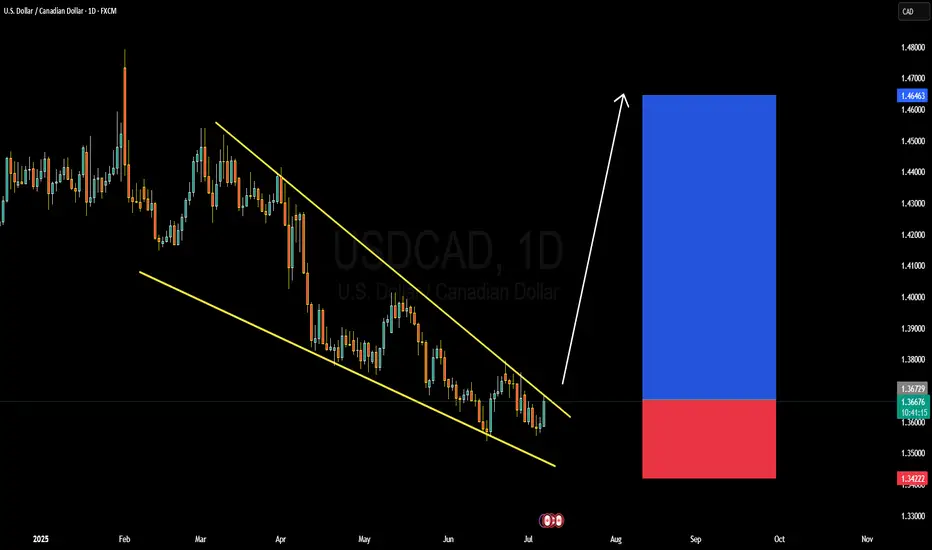
USDCAD BULLISH OR BEARISH DETAILED ANALYSISUSDCAD has just completed a clean falling wedge breakout—a classic bullish reversal pattern often signaling trend exhaustion. After months of consistent lower highs and lower lows within a well-defined wedge, price has now broken decisively above the descending resistance. The current price sits around 1.367, and we are confidently targeting the 1.407 level in the coming weeks. This breakout aligns perfectly with the seasonal USD strength historically seen in Q3, especially following soft Canadian economic data.
From a fundamental perspective, the Canadian dollar is facing downside pressure amid falling crude oil prices and softening domestic data. Canada’s most recent GDP growth came in below expectations, raising concerns around economic resilience. Meanwhile, the Bank of Canada is expected to remain dovish with growing speculation of another rate cut in the next quarter. In contrast, the US dollar has been gaining traction following stronger-than-expected ISM services data and a better-than-anticipated ADP employment report, supporting the Fed’s “higher for longer” stance on interest rates.
Technically, the breakout is further supported by increasing bullish momentum and a break of market structure on lower timeframes. We’re seeing volume confirmation with this push, adding conviction that buyers are stepping in with strength. The risk-to-reward ratio remains highly favorable here, and any pullback into the 1.36 zone would provide an excellent re-entry opportunity for continuation.
With sentiment shifting in favor of USD bulls and oil-related weakness dragging CAD, USDCAD looks primed for a rally. The 1.407 target aligns with both key resistance levels and Fibonacci projections from the breakout structure. Momentum is with the bulls, and this setup has the potential to deliver solid profits as we head deeper into Q3.
US
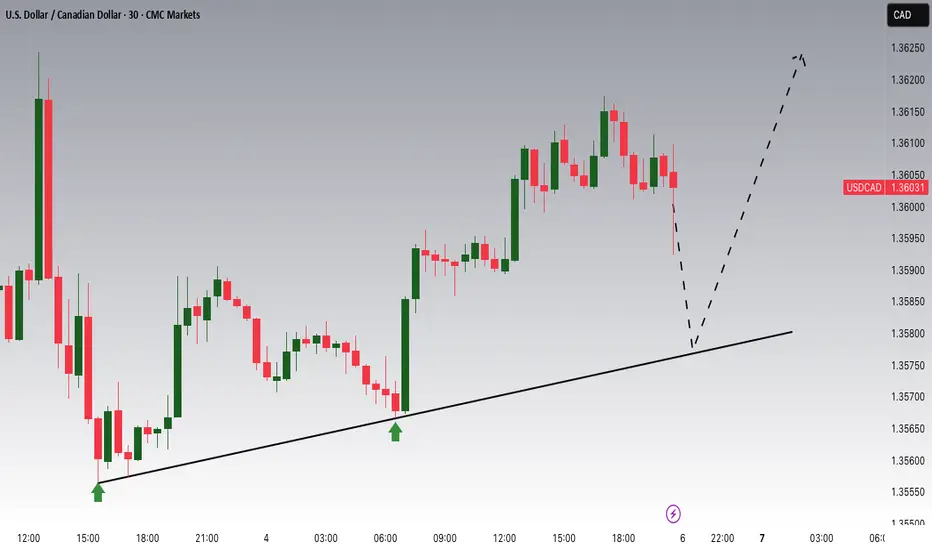
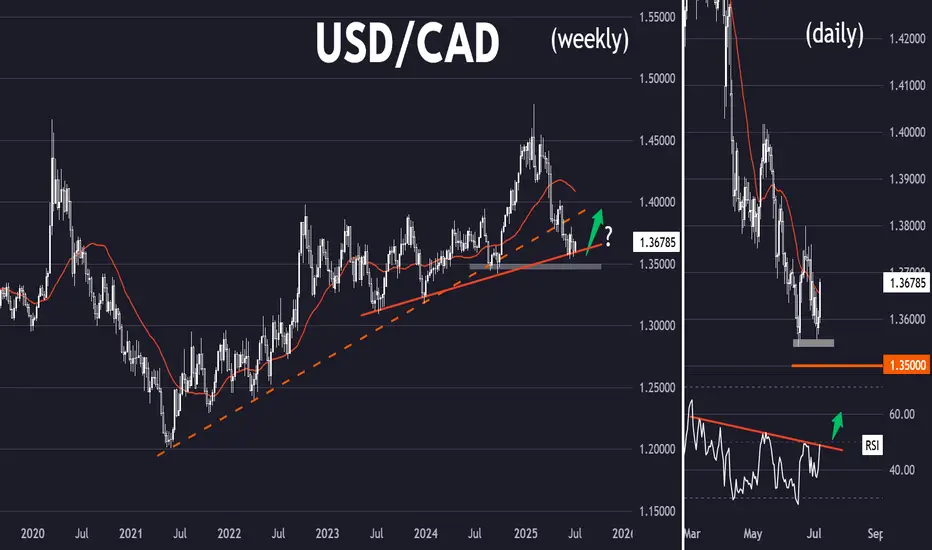
Bullish Maple Syrup (USD/CAD)Setup
USD/CAD has broken below its long term uptrend line and is making lower lows while below the 30 week SMA, indicating a downtrend.
Signal
The daily chart shows a steep downtrend with RSI having twice been oversold at the May and June lows. However, on the most recent re-test of the lows RSI has held up. A double bottom pattern confirmed by a break back over 50 RSI could signal a more sustained bounce.
Uptrend The uptrend is expected to continue to the identified resistance levels. Then, based on the price behavior within this range, possible scenarios are identified.

USDCADTrend Reversal Structure + Lower High + Supply Zone Rejection
Key Confirmations:
1.Market Shift from Bullish to Bearish (Structure Break)
Price formed a Lower High (LH) after a Higher High (HH).
A clear Break of Structure (BOS) to the downside occurred (marked on the chart), indicating a shift in trend from bullish to bearish.
2.Trendline Respect + Rejection
A clean downward trendline is drawn connecting HH → LH → lower LH.
Price rejected perfectly from the trendline, confirming resistance and bearish momentum.
3.Supply Zone Rejection
Price action touches a previously tested supply zone (highlighted in red).
That zone acted as resistance, and price failed to break above.
4.Bearish Continuation Setup
After forming a Lower Low (LL), price pulls back to create another Lower High (LH) – classic bearish continuation pattern.
DOWN TREND CONTINUES Price has been in a downward trend, now experiencing a pull back into a higher time frame POI!
A clear uptrend to a Quasimodo entry type zone! MISSED ME ON THAPrice has been in a downward trend for a while. The lower time frame is experiencing a correction that will pick orders from the higher time frame POI and continue its downward trajectory