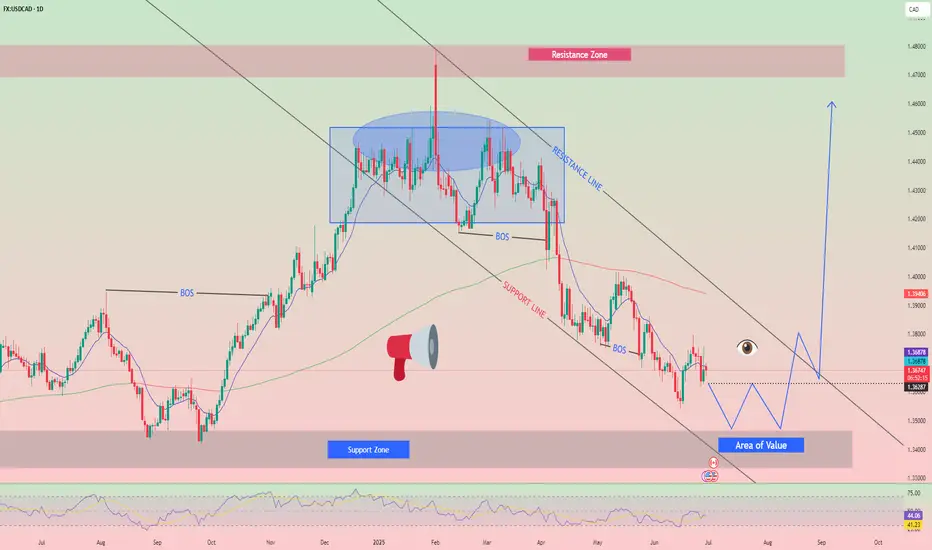
Possibility of uptrend The triangle pattern is expected to complete at the current support level according to the indicated directions. Then, a trend change is likely to occur and the start of an uptrend is likely. A break of the red support level will likely indicate a continuation of the downtrend.
USDCAD trade ideas
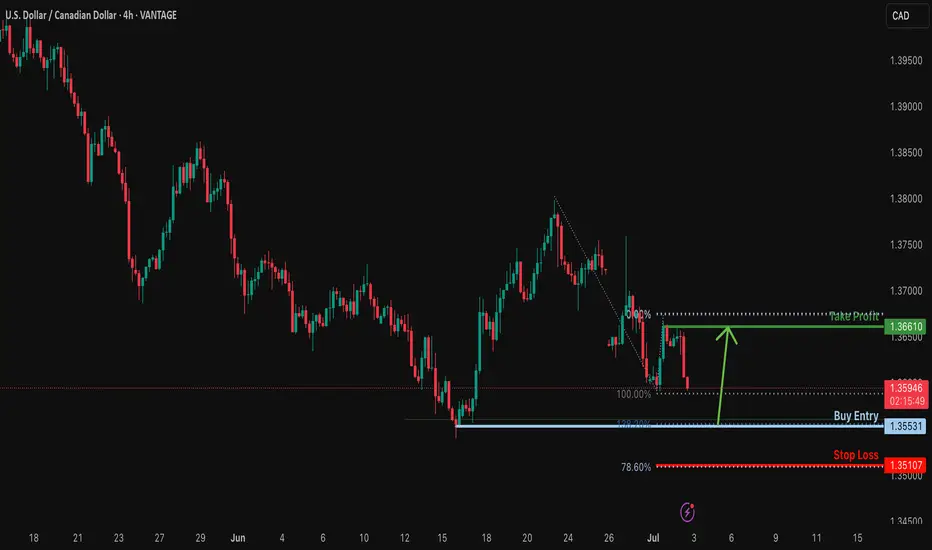
Bullish bounce?USD/CAD is falling towards the support level which is a pullback support that aligns with the 138.2% Fibonacci extension and could bounce from this level to our take profit.
Entry: 1.3553
Why we like it:
There is a pullback support level that lines up with the 138.2% Fibonacci extension.
Stop loss: 1.3510
Why we like it:
There is a support level at the 78.6% Fibonacci projection.
Take profit: 1.3661
Why we like it:
There is a pullback resistance level.
Enjoying your TradingView experience? Review us!
Please be advised that the information presented on TradingView is provided to Vantage (‘Vantage Global Limited’, ‘we’) by a third-party provider (‘Everest Fortune Group’). Please be reminded that you are solely responsible for the trading decisions on your account. There is a very high degree of risk involved in trading. Any information and/or content is intended entirely for research, educational and informational purposes only and does not constitute investment or consultation advice or investment strategy. The information is not tailored to the investment needs of any specific person and therefore does not involve a consideration of any of the investment objectives, financial situation or needs of any viewer that may receive it. Kindly also note that past performance is not a reliable indicator of future results. Actual results may differ materially from those anticipated in forward-looking or past performance statements. We assume no liability as to the accuracy or completeness of any of the information and/or content provided herein and the Company cannot be held responsible for any omission, mistake nor for any loss or damage including without limitation to any loss of profit which may arise from reliance on any information supplied by Everest Fortune Group.
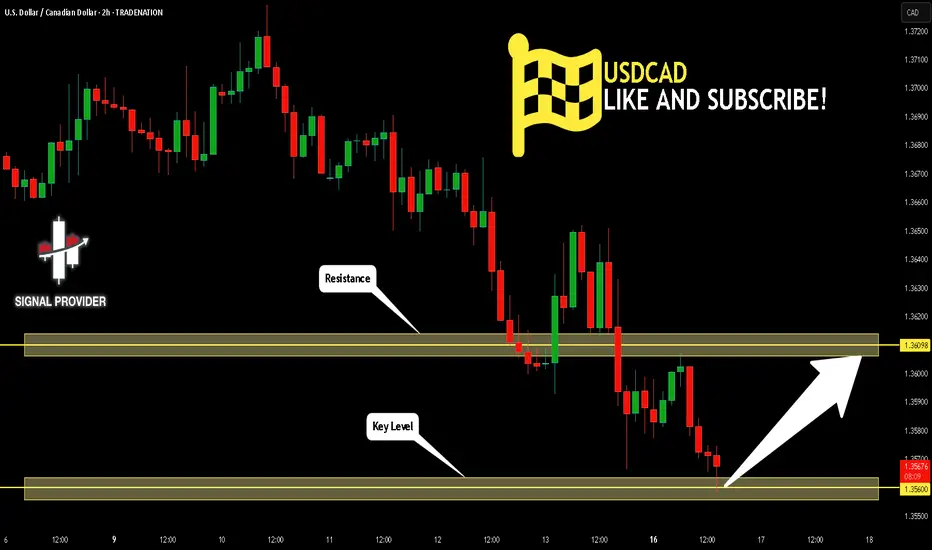
USDCAD bearish consolidation resistance at 1.3700The USDCAD currency pair remains in a bearish technical structure, consistent with the prevailing downtrend. Recent price action suggests sideways consolidation, indicating indecision as the pair pauses before its next directional move.
Key Technical Levels:
Resistance:
1.3700 – Key pivot zone; previously acted as intraday resistance.
1.3740 – Minor resistance.
1.3790 – Stronger resistance zone and potential reversal point.
Support:
1.3566 – Initial downside target on renewed selling pressure.
1.3544 – Intermediate support.
1.3520 – Long-term support and potential demand zone.
Scenario Analysis:
Bearish Case (Favored):
Price is consolidating below the key 1.3700 level. A failure to break above this resistance could trigger a renewed move lower. A bearish rejection from this level may open the path toward 1.3566, then 1.3544 and 1.3520 over a longer timeframe.
Bullish Case (Alternative):
A confirmed breakout and daily close above 1.3700 would invalidate the current bearish setup. This could shift sentiment to bullish and trigger a move toward the next resistance zones at 1.3740 and 1.3790.
Conclusion:
The technical bias for USDCAD remains bearish while price trades below the 1.3700 resistance zone. Traders should watch for a rejection from this level to confirm further downside potential. However, a sustained break above 1.3700 would neutralize the bearish setup and suggest scope for a short-term bullish reversal.
This communication is for informational purposes only and should not be viewed as any form of recommendation as to a particular course of action or as investment advice. It is not intended as an offer or solicitation for the purchase or sale of any financial instrument or as an official confirmation of any transaction. Opinions, estimates and assumptions expressed herein are made as of the date of this communication and are subject to change without notice. This communication has been prepared based upon information, including market prices, data and other information, believed to be reliable; however, Trade Nation does not warrant its completeness or accuracy. All market prices and market data contained in or attached to this communication are indicative and subject to change without notice.

Usd/Cad Intra-Day Analysis 02-Jul-25Breaking down Usd/Cad key levels and areas of interest, in addition to the possible scenarios that could take place.
Disclaimer: easyMarkets Account on TradingView allows you to combine easyMarkets industry leading conditions, regulated trading and tight fixed spreads with TradingView's powerful social network for traders, advanced charting and analytics. Access no slippage on limit orders, tight fixed spreads, negative balance protection, no hidden fees or commission, and seamless integration.
Any opinions, news, research, analyses, prices, other information, or links to third-party sites contained on this website are provided on an "as-is" basis, are intended only to be informative, is not an advice nor a recommendation, nor research, or a record of our trading prices, or an offer of, or solicitation for a transaction in any financial instrument and thus should not be treated as such. The information provided does not involve any specific investment objectives, financial situation and needs of any specific person who may receive it. Please be aware, that past performance is not a reliable indicator of future performance and/or results. Past Performance or Forward-looking scenarios based upon the reasonable beliefs of the third-party provider are not a guarantee of future performance. Actual results may differ materially from those anticipated in forward-looking or past performance statements. easyMarkets makes no representation or warranty and assumes no liability as to the accuracy or completeness of the information provided, nor any loss arising from any investment based on a recommendation, forecast or any information supplied by any third-party.

USDCAD LONG DAILY FORECAST Q3 D2 W27 Y25USDCAD LONG DAILY FORECAST Q3 D2 W27 Y25
Professional Risk Managers👋
Welcome back to another FRGNT chart update📈
Diving into some Forex setups using predominantly higher time frame order blocks alongside confirmation breaks of structure.
Let’s see what price action is telling us today! 👀
💡Here are some trade confluences📝
✅Daily Order block identified
✅4H Order Block identified
✅1H Order Block identified
🔑 Remember, to participate in trading comes always with a degree of risk, therefore as professional risk managers it remains vital that we stick to our risk management plan as well as our trading strategies.
📈The rest, we leave to the balance of probabilities.
💡Fail to plan. Plan to fail.
🏆It has always been that simple.
❤️Good luck with your trading journey, I shall see you at the very top.
🎯Trade consistent, FRGNT X
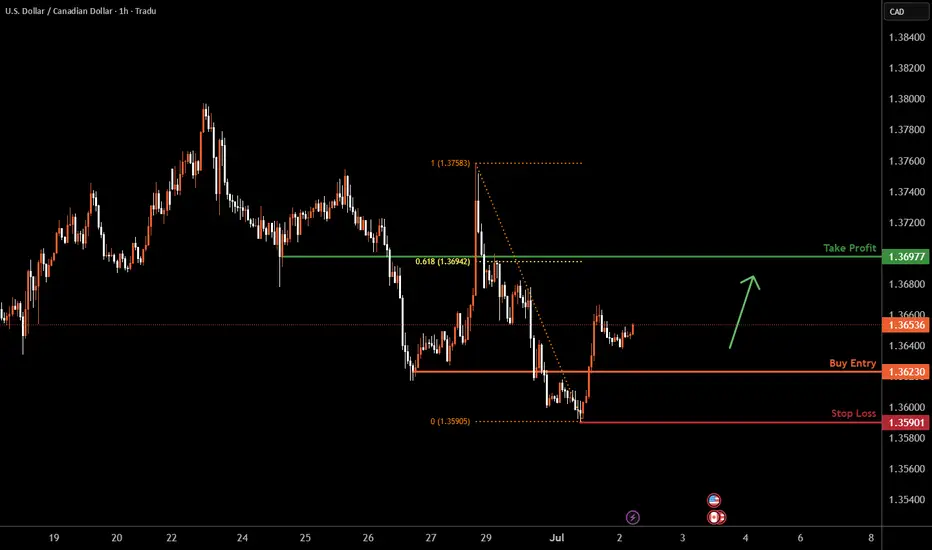
USDCAD H1 I Bearish Reversal Based on the H1chart analysis, the price is approaching our buy entry level at 1,3623, a pullback support.
Our take profit is set at 1.3697, a pullback resistance that aligns with the 61.8% Fib retracement.
The stop loss is placed at 1.3590, a swing low support.
High Risk Investment Warning
Trading Forex/CFDs on margin carries a high level of risk and may not be suitable for all investors. Leverage can work against you.
Stratos Markets Limited (tradu.com ):
CFDs are complex instruments and come with a high risk of losing money rapidly due to leverage. 63% of retail investor accounts lose money when trading CFDs with this provider. You should consider whether you understand how CFDs work and whether you can afford to take the high risk of losing your money.
Stratos Europe Ltd (tradu.com ):
CFDs are complex instruments and come with a high risk of losing money rapidly due to leverage. 63% of retail investor accounts lose money when trading CFDs with this provider. You should consider whether you understand how CFDs work and whether you can afford to take the high risk of losing your money.
Stratos Global LLC (tradu.com ):
Losses can exceed deposits.
Please be advised that the information presented on TradingView is provided to Tradu (‘Company’, ‘we’) by a third-party provider (‘TFA Global Pte Ltd’). Please be reminded that you are solely responsible for the trading decisions on your account. There is a very high degree of risk involved in trading. Any information and/or content is intended entirely for research, educational and informational purposes only and does not constitute investment or consultation advice or investment strategy. The information is not tailored to the investment needs of any specific person and therefore does not involve a consideration of any of the investment objectives, financial situation or needs of any viewer that may receive it. Kindly also note that past performance is not a reliable indicator of future results. Actual results may differ materially from those anticipated in forward-looking or past performance statements. We assume no liability as to the accuracy or completeness of any of the information and/or content provided herein and the Company cannot be held responsible for any omission, mistake nor for any loss or damage including without limitation to any loss of profit which may arise from reliance on any information supplied by TFA Global Pte Ltd.
The speaker(s) is neither an employee, agent nor representative of Tradu and is therefore acting independently. The opinions given are their own, constitute general market commentary, and do not constitute the opinion or advice of Tradu or any form of personal or investment advice. Tradu neither endorses nor guarantees offerings of third-party speakers, nor is Tradu responsible for the content, veracity or opinions of third-party speakers, presenters or participants.
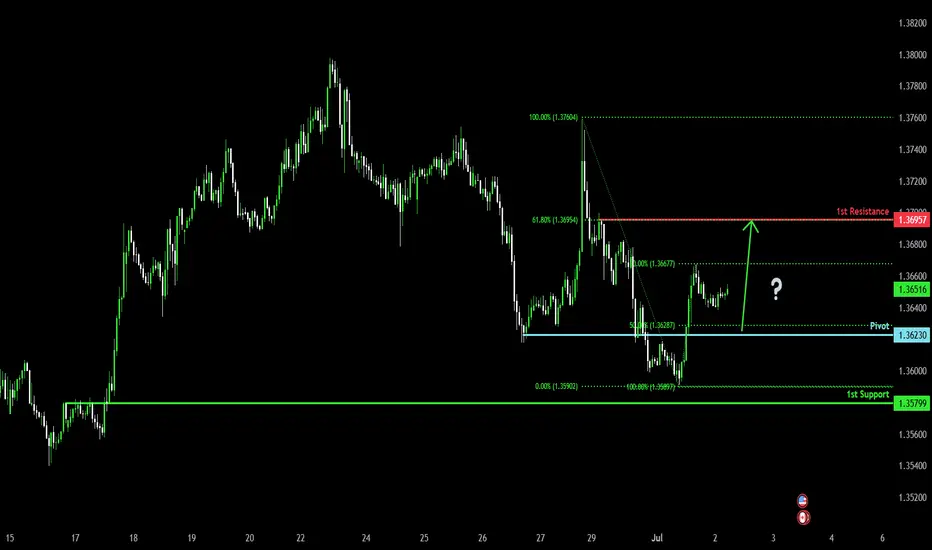
Falling towards 50% Fibonacci support?The Loonie (USD/CAD) is falling towards, the pivot which acts as a pullback support and could bounce to the 61.8% Fibonacci resistance.
Pivot: 1.3623
1st Support: 1.3579
1st Resistance: 1.3695
Risk Warning:
Trading Forex and CFDs carries a high level of risk to your capital and you should only trade with money you can afford to lose. Trading Forex and CFDs may not be suitable for all investors, so please ensure that you fully understand the risks involved and seek independent advice if necessary.
Disclaimer:
The above opinions given constitute general market commentary, and do not constitute the opinion or advice of IC Markets or any form of personal or investment advice.
Any opinions, news, research, analyses, prices, other information, or links to third-party sites contained on this website are provided on an "as-is" basis, are intended only to be informative, is not an advice nor a recommendation, nor research, or a record of our trading prices, or an offer of, or solicitation for a transaction in any financial instrument and thus should not be treated as such. The information provided does not involve any specific investment objectives, financial situation and needs of any specific person who may receive it. Please be aware, that past performance is not a reliable indicator of future performance and/or results. Past Performance or Forward-looking scenarios based upon the reasonable beliefs of the third-party provider are not a guarantee of future performance. Actual results may differ materially from those anticipated in forward-looking or past performance statements. IC Markets makes no representation or warranty and assumes no liability as to the accuracy or completeness of the information provided, nor any loss arising from any investment based on a recommendation, forecast or any information supplied by any third-party.
USDCAD H4 IdeaPotential for a bullish pullback on the USDCAD H4 which could lead to a price movement towards the resistance level at 1.13800. BUY levels from 1.13600

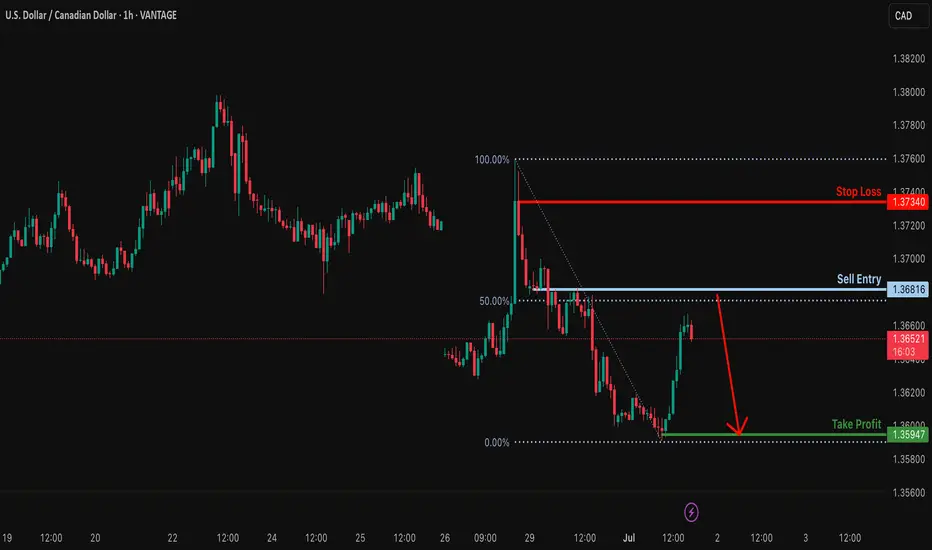
Heading into 50% Fibonacci resistance?USD/CAD is rising towards the resistance level which is a pullback resistance that lines up with the 50% Fibonacci retracement and could drop from this level to our take profit.
Entry: 1.3681
Why we like it:
There is a pullback resistance that aligns with the 50% Fibonacci retracement.
Stop loss: 1.3734
Why we like it:
There is a pullback resistance.
Take profit: 1.3594
Why we like it:
There is a pullback support.
Enjoying your TradingView experience? Review us!
Please be advised that the information presented on TradingView is provided to Vantage (‘Vantage Global Limited’, ‘we’) by a third-party provider (‘Everest Fortune Group’). Please be reminded that you are solely responsible for the trading decisions on your account. There is a very high degree of risk involved in trading. Any information and/or content is intended entirely for research, educational and informational purposes only and does not constitute investment or consultation advice or investment strategy. The information is not tailored to the investment needs of any specific person and therefore does not involve a consideration of any of the investment objectives, financial situation or needs of any viewer that may receive it. Kindly also note that past performance is not a reliable indicator of future results. Actual results may differ materially from those anticipated in forward-looking or past performance statements. We assume no liability as to the accuracy or completeness of any of the information and/or content provided herein and the Company cannot be held responsible for any omission, mistake nor for any loss or damage including without limitation to any loss of profit which may arise from reliance on any information supplied by Everest Fortune Group.
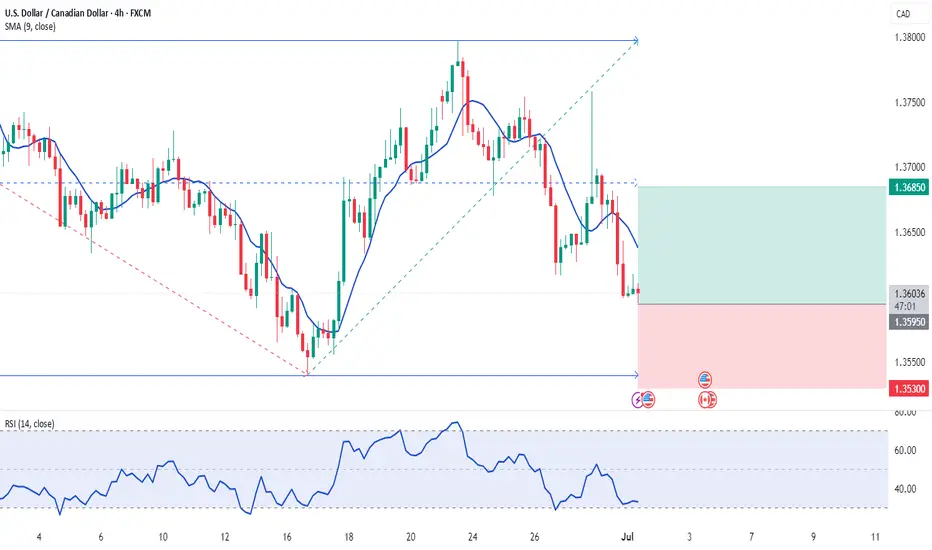
01.07.02025 #USDCADBUY 1.35950 | STOP 1.35300 | TAKE 1.36850 | Upward price movement from the levels of the local support range.
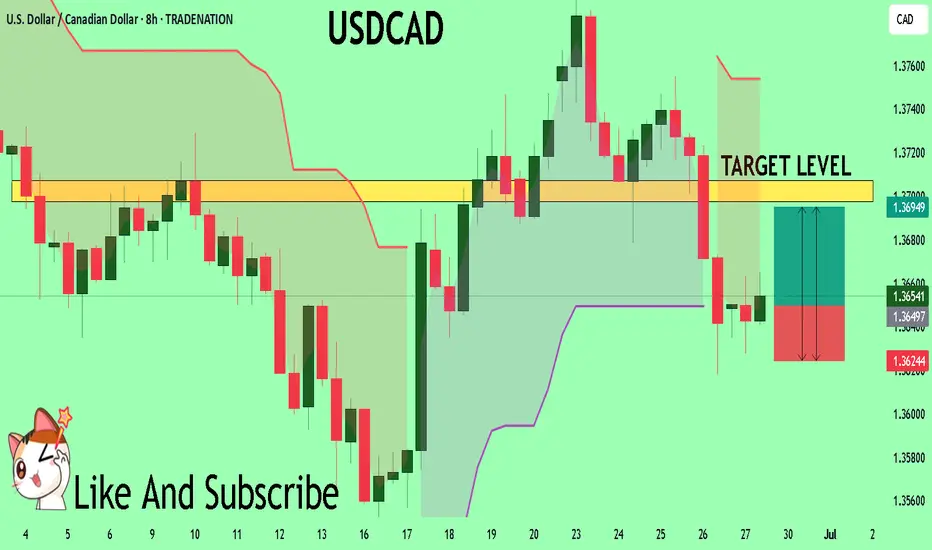
USDCAD Expected Growth! BUY!
My dear friends,
My technical analysis for USDCAD is below:
The market is trading on 1.3649 pivot level.
Bias - Bullish
Technical Indicators: Both Super Trend & Pivot HL indicate a highly probable Bullish continuation.
Target - 1.3697
Recommended Stop Loss - 1.3624
About Used Indicators:
A pivot point is a technical analysis indicator, or calculations, used to determine the overall trend of the market over different time frames.
Disclosure: I am part of Trade Nation's Influencer program and receive a monthly fee for using their TradingView charts in my analysis.
———————————
WISH YOU ALL LUCK
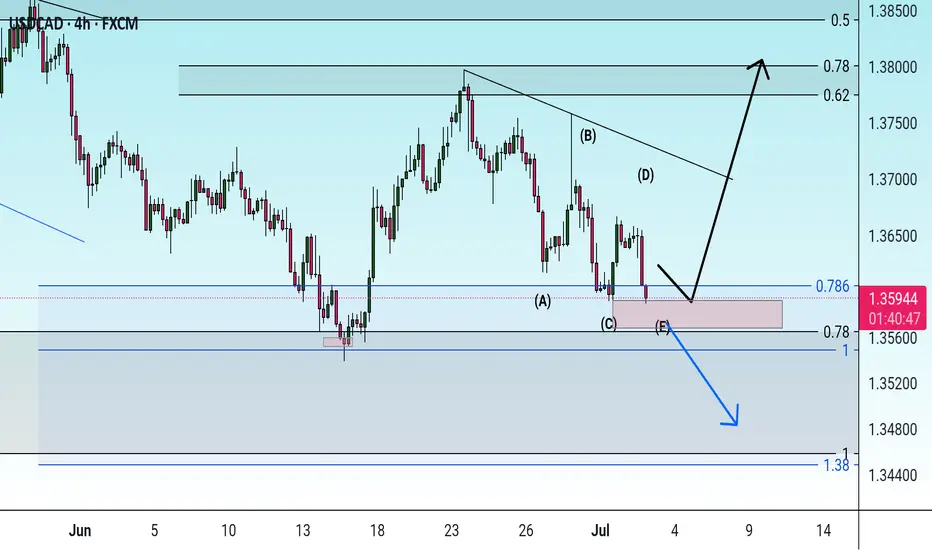
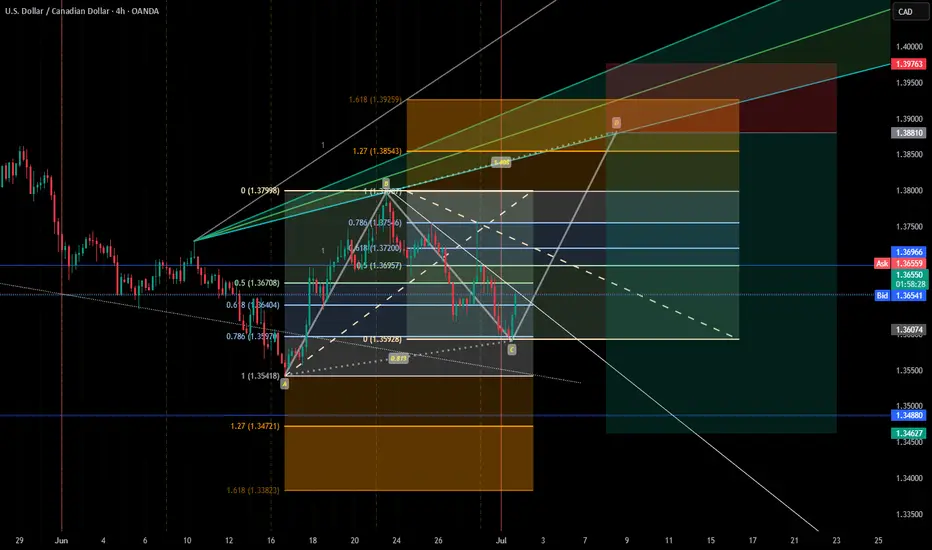
USDCADHere’s a detailed breakdown. Of course, those fully engaged in trading will understand this right away. Basically, when the price reaches the D point zone (ABCD pattern), we start looking for a short setup. Most likely, the price will move toward the projected target zone — and that’s what we’re aiming for.
For those who are impatient, there are also two potential entry zones for long trades. As you can see, there’s a white trendline on the chart. The first buy setup is from the area after a retest of this trendline. The second long opportunity appears if the price breaks above the 61.8% Fibonacci zone — in that case, you can buy again on the retest, aiming for the TP zone.
USDCAD LONG DAILY FORECAST Q3 D1 W27 Y25USDCAD LONG DAILY FORECAST Q3 D1 W27 Y25
IS USDCAD FINALLY READY TO LONG !
Professional Risk Managers👋
Welcome back to another FRGNT chart update📈
Diving into some Forex setups using predominantly higher time frame order blocks alongside confirmation breaks of structure.
Let’s see what price action is telling us today! 👀
💡Here are some trade confluences📝
✅Daily Order block identified
✅4H Order Block identified
✅1H Order Block identified
🔑 Remember, to participate in trading comes always with a degree of risk, therefore as professional risk managers it remains vital that we stick to our risk management plan as well as our trading strategies.
📈The rest, we leave to the balance of probabilities.
💡Fail to plan. Plan to fail.
🏆It has always been that simple.
❤️Good luck with your trading journey, I shall see you at the very top.
🎯Trade consistent, FRGNT X
USDCAD – Buy the Dip Near Pivot SupportTrade Idea
Type: Buy Limit
Entry: 1.3575
Target: 1.3675
Stop Loss: 1.3525
Duration: Intraday
Expires: 02/07/2025 06:00
Technical Overview
A lower correction is expected, providing an opportunity to buy into a potential reversal setup.
Pivot support at 1.3550 aligns with the Buy Limit entry area, offering a solid technical foundation for a rebound.
A move above 1.3625 will confirm renewed bullish momentum, supporting a push toward the target at 1.3675.
The current risk/reward does not favor chasing at higher levels, making buying dips the preferred strategy.
Watch for potential volatility from upcoming U.S. events:
Fed Chair Powell speech at 14:30 UTC, and
ISM Manufacturing PMI at 15:00 UTC, which may impact USD flows.
Key Technical Levels
Support: 1.3550 / 1.3525 / 1.3500
Resistance: 1.3625 / 1.3675 / 1.3700
Disclosure: I am part of Trade Nation's Influencer program and receive a monthly fee for using their TradingView charts in my analysis.

USD/CAD H4 | Potential bearish breakoutUSD/CAD is falling towards a potential breakout level and could drop lower from here.
Sell entry is at 1.3601 which is a potential breakout level.
Stop loss is at 1.3662 which is a level that sits above an overlap resistance.
Take profit is at 1.3539 which is a swing-low support that aligns closely with a 161.8% Fibonacci extension.
High Risk Investment Warning
Trading Forex/CFDs on margin carries a high level of risk and may not be suitable for all investors. Leverage can work against you.
Stratos Markets Limited (tradu.com ):
CFDs are complex instruments and come with a high risk of losing money rapidly due to leverage. 63% of retail investor accounts lose money when trading CFDs with this provider. You should consider whether you understand how CFDs work and whether you can afford to take the high risk of losing your money.
Stratos Europe Ltd (tradu.com ):
CFDs are complex instruments and come with a high risk of losing money rapidly due to leverage. 63% of retail investor accounts lose money when trading CFDs with this provider. You should consider whether you understand how CFDs work and whether you can afford to take the high risk of losing your money.
Stratos Global LLC (tradu.com ):
Losses can exceed deposits.
Please be advised that the information presented on TradingView is provided to Tradu (‘Company’, ‘we’) by a third-party provider (‘TFA Global Pte Ltd’). Please be reminded that you are solely responsible for the trading decisions on your account. There is a very high degree of risk involved in trading. Any information and/or content is intended entirely for research, educational and informational purposes only and does not constitute investment or consultation advice or investment strategy. The information is not tailored to the investment needs of any specific person and therefore does not involve a consideration of any of the investment objectives, financial situation or needs of any viewer that may receive it. Kindly also note that past performance is not a reliable indicator of future results. Actual results may differ materially from those anticipated in forward-looking or past performance statements. We assume no liability as to the accuracy or completeness of any of the information and/or content provided herein and the Company cannot be held responsible for any omission, mistake nor for any loss or damage including without limitation to any loss of profit which may arise from reliance on any information supplied by TFA Global Pte Ltd.
The speaker(s) is neither an employee, agent nor representative of Tradu and is therefore acting independently. The opinions given are their own, constitute general market commentary, and do not constitute the opinion or advice of Tradu or any form of personal or investment advice. Tradu neither endorses nor guarantees offerings of third-party speakers, nor is Tradu responsible for the content, veracity or opinions of third-party speakers, presenters or participants.

USDCAD OVERVIEW I am bearish on USDCAD.I will be looking more for sells.CAD is also largely influenced by Oil but remember their have been also bearish outlook on the dollar.Dollar weakness is a big factor

USDCAD 4-hour chart
USDCAD is consistently trading within a clearly defined descending price channel, indicating a prevailing downtrend.
Price action is characterized by a series of lower highs and lower lows, respecting both the upper and lower boundaries of this channel.
The pair has recently encountered resistance near the upper channel boundary, leading to a turn lower.
Based on the established channel, the current price trajectory suggests a potential move towards the lower boundary of the descending channel.
Disclaimer:
The information provided in this chart is for educational and informational purposes only and should not be considered as investment advice. Trading and investing involve substantial risk and are not suitable for every investor. You should carefully consider your financial situation and consult with a financial advisor before making any investment decisions. The creator of this chart does not guarantee any specific outcome or profit and is not responsible for any losses incurred as a result of using this information. Past performance is not indicative of future results. Use this information at your own risk. This chart has been created for my own improvement in Trading and Investment Analysis. Please do your own analysis before any investments.

USDCAD long trade setup for this week📈 USDCAD Long Setup Idea – Weekly Play 💯
Here’s a clean bullish setup on USDCAD (2H timeframe) I’m eyeing for this week:
🔹 Key Zones:
- Demand Zone: Strong reaction from the 1.35500–1.36000 area, with price respecting this grey support block multiple times.
- Supply Flip: Previous structure zone turned potential demand.
🔹 Entry:
- Long position placed after liquidity grab and bullish rejection within the demand zone.
- Market structure is beginning to shift bullish after consecutive lower highs and lows broke.
🔹 Risk Management:
- SL below the demand zone at ~1.35512
- TP set near previous high around 1.37960 (resistance zone)
🔹 RRR (Risk to Reward Ratio):
- Solid risk/reward potential on this play – targeting a 3R move if momentum holds.
🔹 Trade Bias:
- Looking for a deeper retracement continuation up, aligning with possible DXY pullback.
- Watching for confirmations like bullish engulfing or structure break for entry trigger.
📊 Stay patient, follow price action, and manage risk properly.

USDCAD SC112M
BM
M
Inv H&S
W
Ind. candle
Structure (-)
D
Inv H&S
News liq S1
fib completion -68
4H
Decel 3

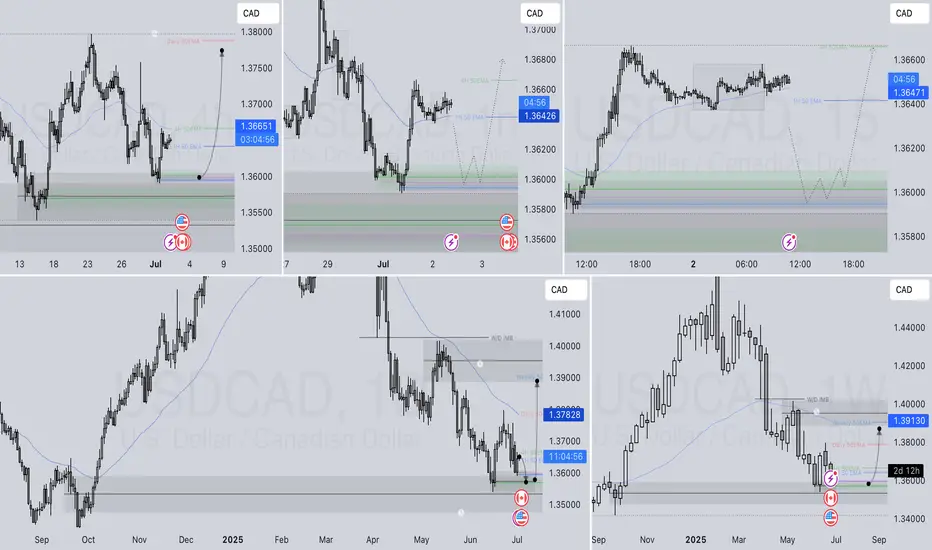
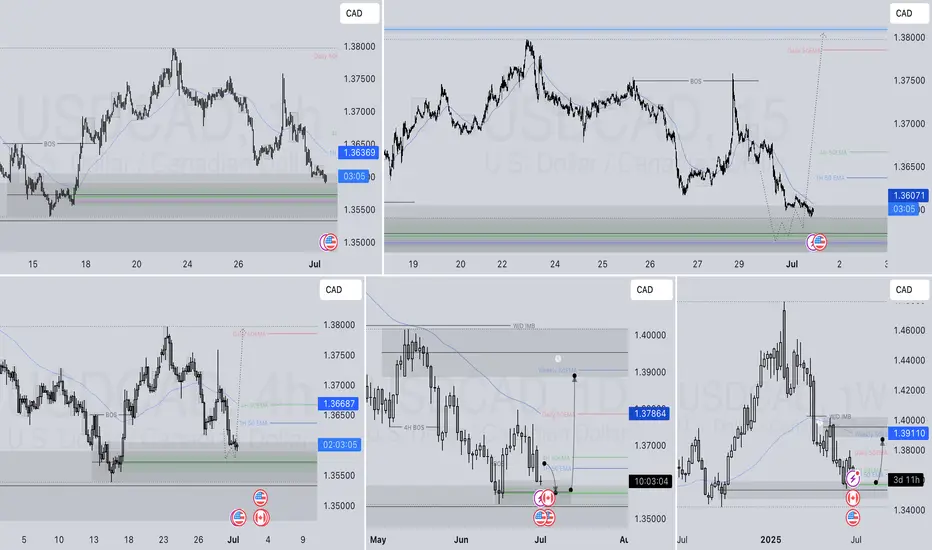
Weekly Forecast Based on Simplified Wave Analysis for USD/CADThe downward wave that formed on the USD/CAD chart tis year has been followed by a corrective move since late May. The pair is largely confined to a sideways price channel. The current wave structure remains incomplete, lacking final segment.
Forecast:
The pair may decline further in the coming days, reaching the support zone. A reversal and upward movement from support may follow. The resistance zone reflects the upper boundary of the pair's expected weekly volatility.
Potential Reversal Zones
Resistance: 1.3800/ 1.3850
Support: 1.3640/ 1.3590
Recommendations:
Selling: Possible intraday in small volumes, not beyond the support zone.
Buying: Consider only after confirmed reversal signals appear near support.
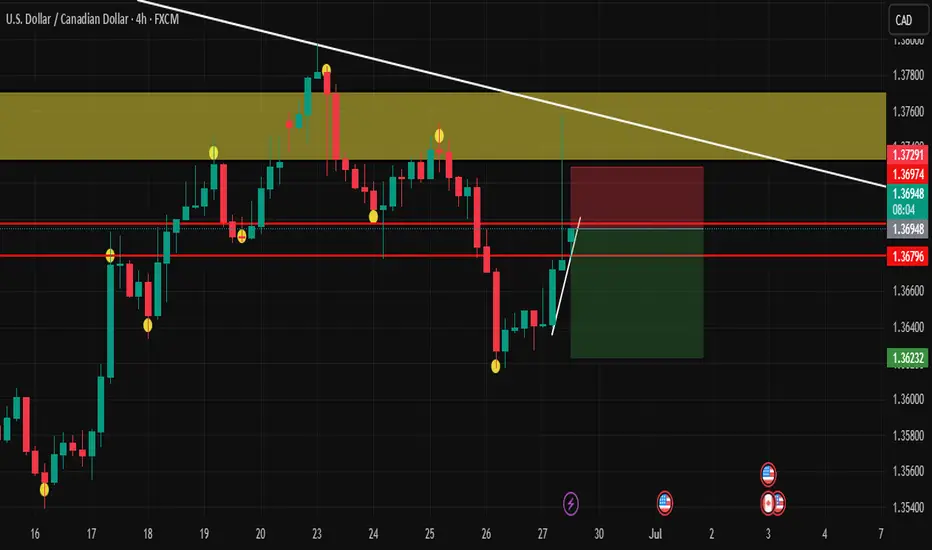
USDCAD -bias long Bullish indications :
Inverted hammer candle daily
previous day support respected.
IHS formation in 1 hr at higher low.
Fib level 0.786 respected and bounced
Bearish indications:
LLLH in daily frame.
Trade plan buy stop at 1.36766
SL:1.3651
TP1:1.37034
TP2:1.3730

USDCAD Is Going Up! Buy!
Please, check our technical outlook for USDCAD.
Time Frame: 2h
Current Trend: Bullish
Sentiment: Oversold (based on 7-period RSI)
Forecast: Bullish
The market is approaching a key horizontal level 1.356.
Considering the today's price action, probabilities will be high to see a movement to 1.360.
P.S
We determine oversold/overbought condition with RSI indicator.
When it drops below 30 - the market is considered to be oversold.
When it bounces above 70 - the market is considered to be overbought.
Disclosure: I am part of Trade Nation's Influencer program and receive a monthly fee for using their TradingView charts in my analysis.
Like and subscribe and comment my ideas if you enjoy them!