SELL POI expectancy USDCAD approaching Friday high,800Ema and a round number 1.3750 and hopefully we might get a rejection around that zone before it starts selling
USDCAD trade ideas
USDCAD LONG DAILY FORECAST Q3 D30 W27 Y25USDCAD LONG DAILY FORECAST Q3 D30 W27 Y25
Professional Risk Managers👋
Welcome back to another FRGNT chart update📈
Diving into some Forex setups using predominantly higher time frame order blocks alongside confirmation breaks of structure.
Let’s see what price action is telling us today! 👀
💡Here are some trade confluences📝
✅Daily Order block identified
✅4H Order Block identified
✅1H Order Block identified
🔑 Remember, to participate in trading comes always with a degree of risk, therefore as professional risk managers it remains vital that we stick to our risk management plan as well as our trading strategies.
📈The rest, we leave to the balance of probabilities.
💡Fail to plan. Plan to fail.
🏆It has always been that simple.
❤️Good luck with your trading journey, I shall see you at the very top.
🎯Trade consistent, FRGNT X
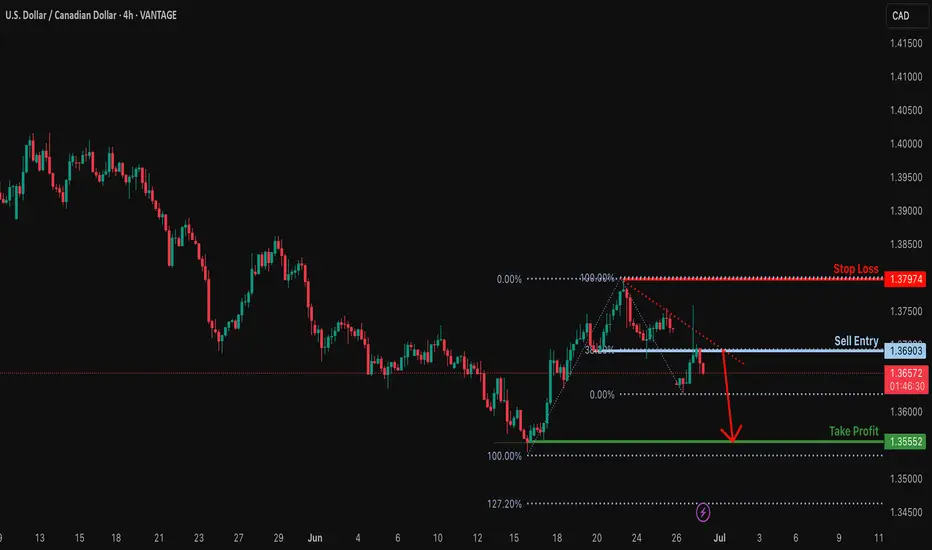
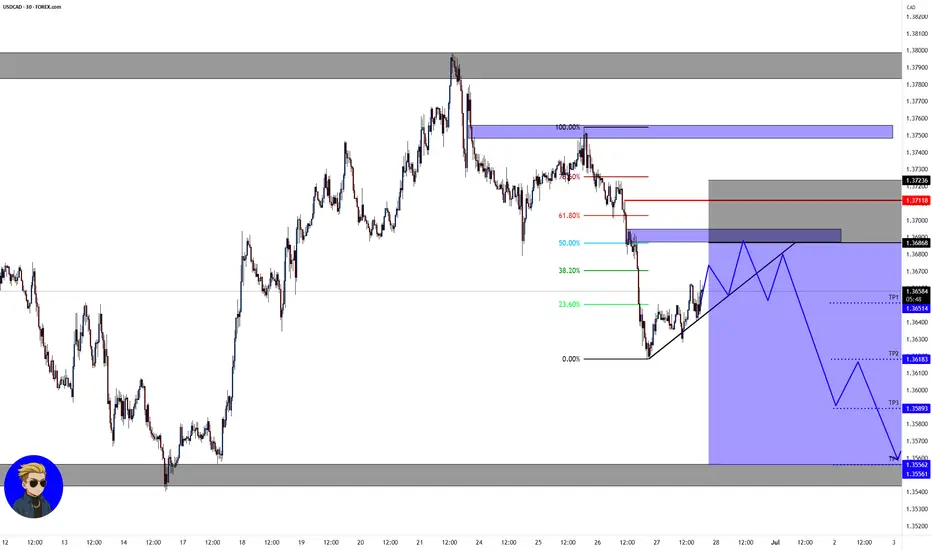
Bearish drop?USD/CAD is reacting off the resistance level which is pullback resistance that aligns with the 38.2% Fibonacci retracement and could drop from this level to our take profit.
Entry: 1.3690
Why we like it:
There is a pullback resistance that aligns with the 38.2% Fibonacci retracement.
Stop loss: 1.3797
Why we like it:
There is a pullback resistance.
Take profit: 1.3555
Why we like it:
There is a pullback support level.
Enjoying your TradingView experience? Review us!
Please be advised that the information presented on TradingView is provided to Vantage (‘Vantage Global Limited’, ‘we’) by a third-party provider (‘Everest Fortune Group’). Please be reminded that you are solely responsible for the trading decisions on your account. There is a very high degree of risk involved in trading. Any information and/or content is intended entirely for research, educational and informational purposes only and does not constitute investment or consultation advice or investment strategy. The information is not tailored to the investment needs of any specific person and therefore does not involve a consideration of any of the investment objectives, financial situation or needs of any viewer that may receive it. Kindly also note that past performance is not a reliable indicator of future results. Actual results may differ materially from those anticipated in forward-looking or past performance statements. We assume no liability as to the accuracy or completeness of any of the information and/or content provided herein and the Company cannot be held responsible for any omission, mistake nor for any loss or damage including without limitation to any loss of profit which may arise from reliance on any information supplied by Everest Fortune Group.
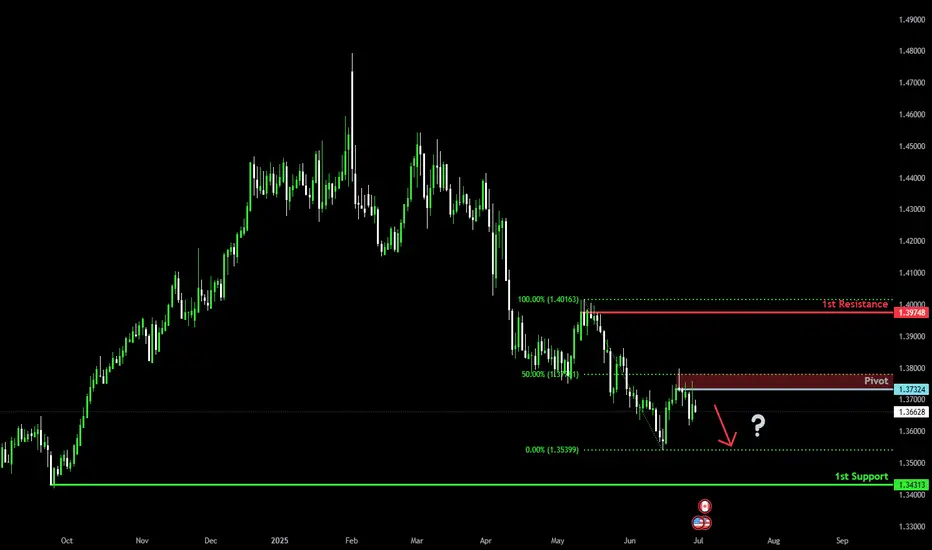
Bearish continuation?The Loonie (USD/CAD) has rejected off the pivot and could drop to the 1st support.
Pivot: 1.3732
1st Support: 1.3431
1st Resistance: 1.3974
Risk Warning:
Trading Forex and CFDs carries a high level of risk to your capital and you should only trade with money you can afford to lose. Trading Forex and CFDs may not be suitable for all investors, so please ensure that you fully understand the risks involved and seek independent advice if necessary.
Disclaimer:
The above opinions given constitute general market commentary, and do not constitute the opinion or advice of IC Markets or any form of personal or investment advice.
Any opinions, news, research, analyses, prices, other information, or links to third-party sites contained on this website are provided on an "as-is" basis, are intended only to be informative, is not an advice nor a recommendation, nor research, or a record of our trading prices, or an offer of, or solicitation for a transaction in any financial instrument and thus should not be treated as such. The information provided does not involve any specific investment objectives, financial situation and needs of any specific person who may receive it. Please be aware, that past performance is not a reliable indicator of future performance and/or results. Past Performance or Forward-looking scenarios based upon the reasonable beliefs of the third-party provider are not a guarantee of future performance. Actual results may differ materially from those anticipated in forward-looking or past performance statements. IC Markets makes no representation or warranty and assumes no liability as to the accuracy or completeness of the information provided, nor any loss arising from any investment based on a recommendation, forecast or any information supplied by any third-party.
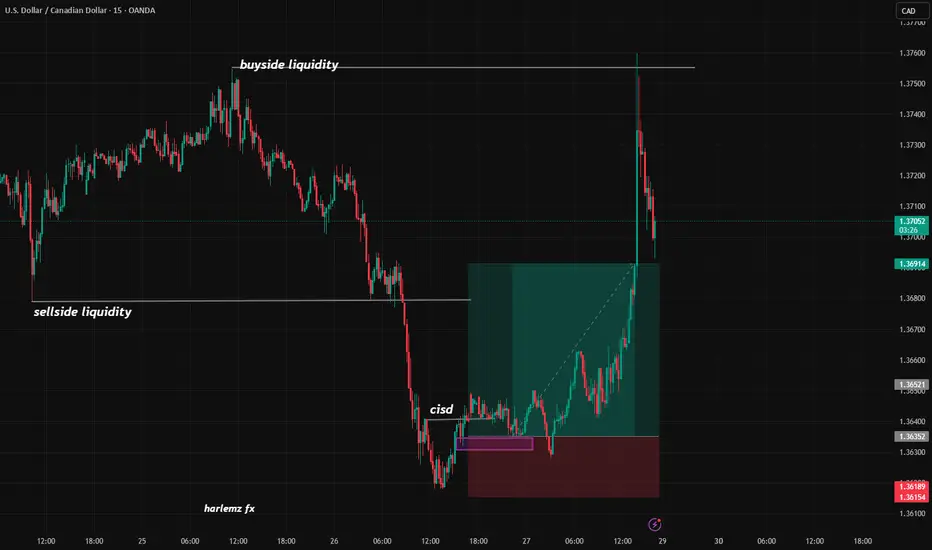
USD/CAD 15-Minute Time Frame (15TF) Technical & Fundamental AnalUSD/CAD 15-Minute Time Frame (15TF) Technical & Fundamental Analysis
Last week, we highlighted potential bullish momentum building in USD/CAD. That narrative continues to develop, supported by the latest economic data.
The U.S. Core PCE Price Index came in at 0.2%, slightly higher than the previous 0.1%, indicating persistent inflationary pressure that could keep the USD supported. On the other hand, Canada’s GDP contracted by -0.1%, a significant drop from the previous 0.2% growth, weighing on the CAD.
Technical Outlook:
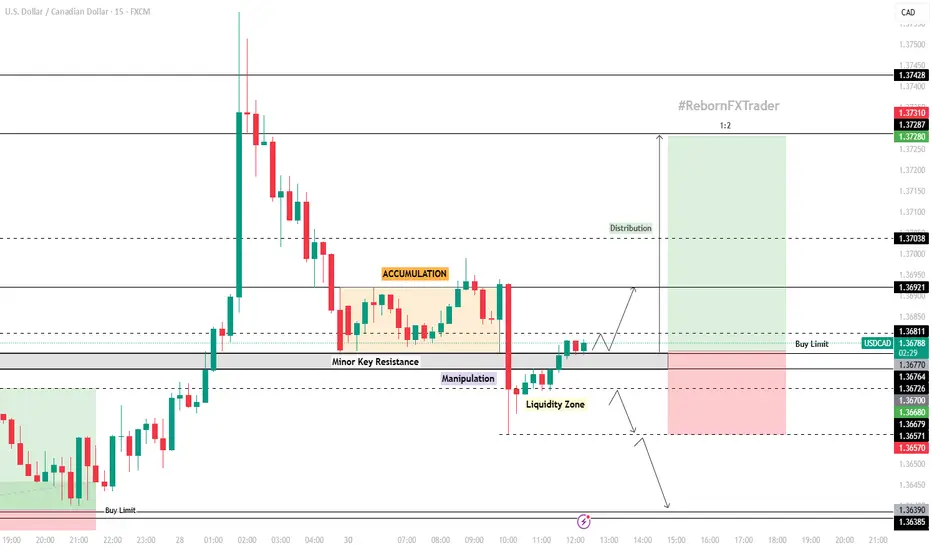
Following the price rejection near 1.37500, USD/CAD entered an accumulation phase around 1.3680–1.3690, signaling smart money building long positions.
After accumulating buy orders and sweeping liquidity below the key level at 1.36750, price has broken above a minor resistance zone, indicating bullish intent. A visible manipulation pattern within a liquidity pocket further supports this move.
We now anticipate a continuation higher from a key re-entry zone around recent breakout structure.
📊 Trade Setup
📍 Area of Interest (AOI): 1.36770 (Buy Limit Order)
🛡 Stop-Loss: 1.36570 (Below liquidity zone)
🎯 Take Profit: 1.37280 (Next key resistance / ~1:2.5 RR)
This trade aligns with institutional behavior — accumulation, liquidity grab, and break of structure — suggesting a bullish continuation as long as price respects the recent breakout zone.
📌 Disclaimer:
This is not financial advice. Always wait for proper confirmation before executing trades. Manage risk wisely and trade what you see—not what you feel.
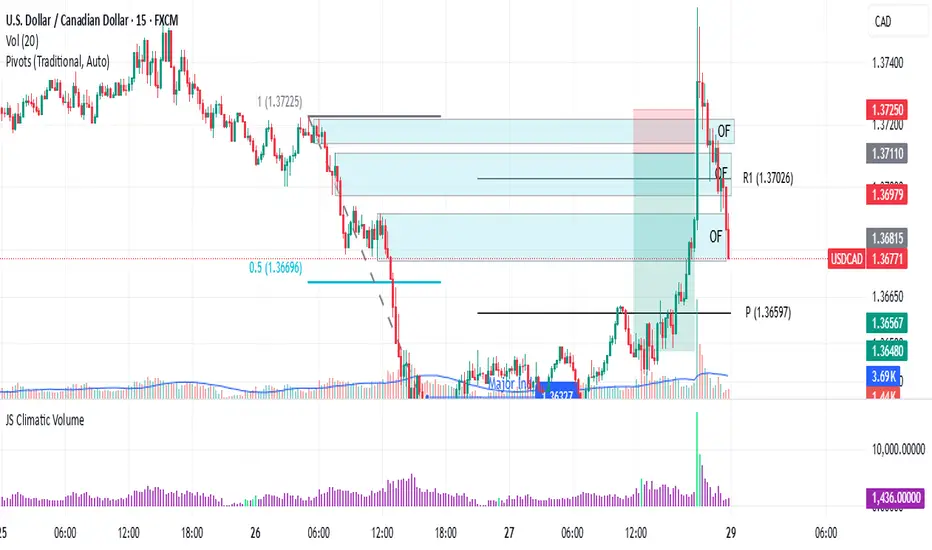
USDCAD – Long Bias LiveUSDCAD – Long Bias Live
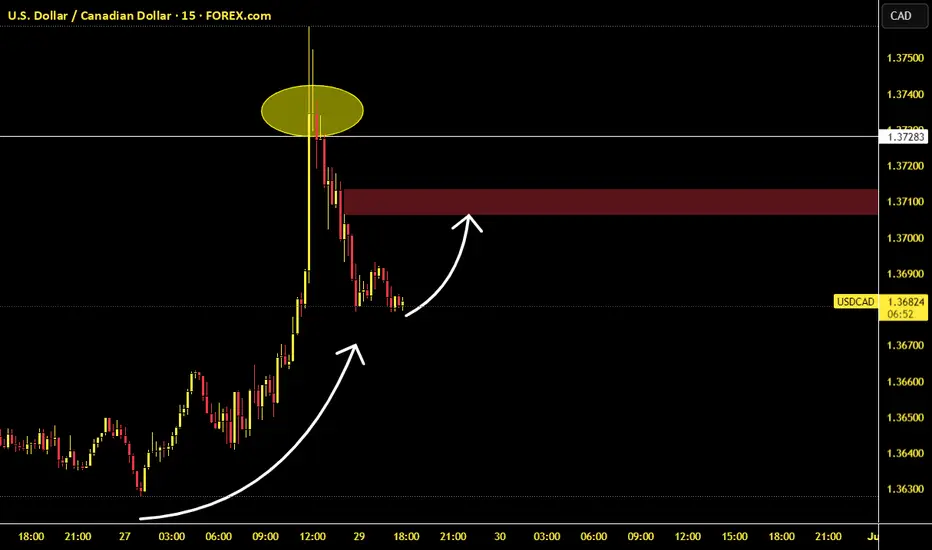
🔹 Entered long near market open at ~1.36780
🎯 Target: 1.37112 (previous swing area highlighted)
⏳ Expect to hold into next London/New York session
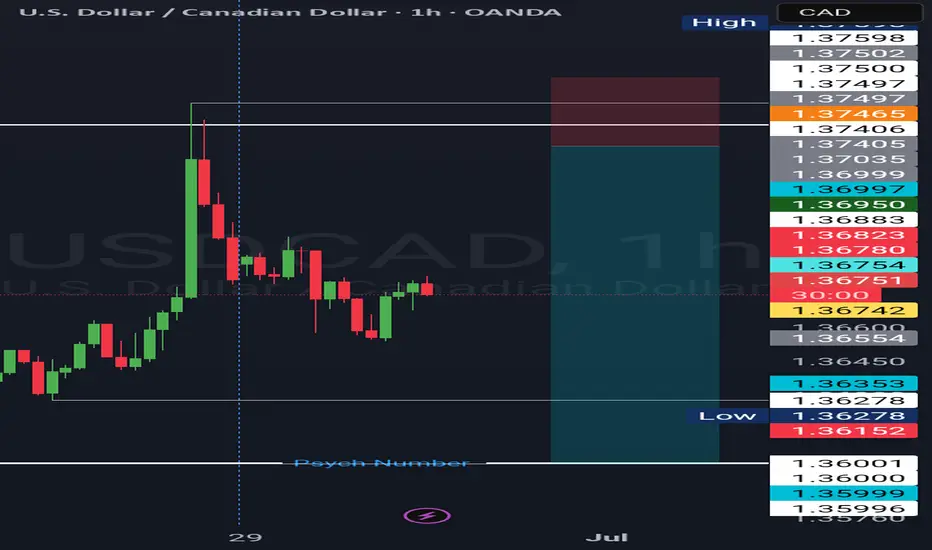
After a sharp spike up into the yellow zone (~1.37283) and subsequent retrace, price has found support around 1.36780 (lower white curve). I’m anticipating a bounce back up toward the red resistance band at 1.37112 (former swing level).
• Entry: ~1.36780 support
• Target: 1.37112 resistance
• Timeframe: 15 min chart, swing through today’s London open
All setups can be replayed on TradingView for confirmation.
⚠️ Not financial advice—always trade with proper risk management!
#USDCAD #Forex #TradingView #PriceAction #SwingTrade
CADUSD - BullishMarket formed a BUllihs divergence on 1H time frame followed by the inverse H&S pattern. Market broke the last LH, and then formed the 1st HH and HL and 2nd HL is being formed. which is clear sign of bullish trend. we take instant entry and place our SL below the right Shoulder of pattern.
we anticipate the market to remain bullish and put TPs 1 and 2 accordingly with 1:1 and 1:2 R:R ratio.
Happy Trading Guyz .

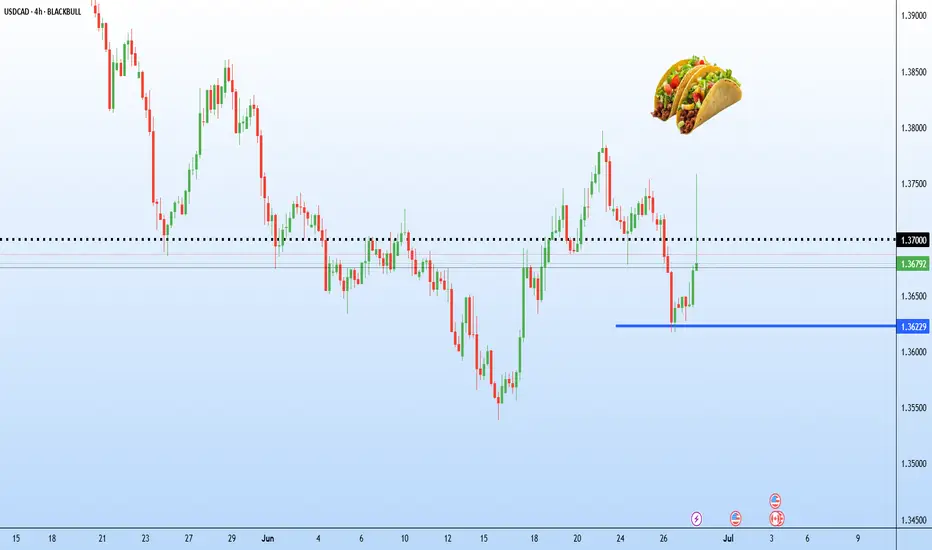
Is it too late for a TACO trade on USD/CAD? USD/CAD jumped nearly 900 pips on Monday after President Donald Trump announced he is “terminating” trade negotiations with Canada. But the surge didn’t stick. Within hours, the pair gave up most of its gains, slipping back below the 1.3700 breakout level.
There’s been no reversal from Trump — not yet. But price action suggests the market might be front-running one. Traders have seen this before: the “TACO” setup — Trump Always Chickens Out.
In that context, traders may be cautious about chasing the spike without confirmation that the trade breakdown will be long-lasting. The USD/CAD trade now hinges on updates from Trump for more TACO setups.
If USD/CAD stays below 1.3700, the focus shifts back to 1.3628 and possibly lower. Below that, the long-term structure suggests a broader range between 1.3500 and 1.3770.
USDCAD TRADE SETUPWait for retest the entry level and bearish momentum candle then take a trade for Sell otherwise skip this setup
USDCAD Trade Plan 26/06/2025Dear Traders,
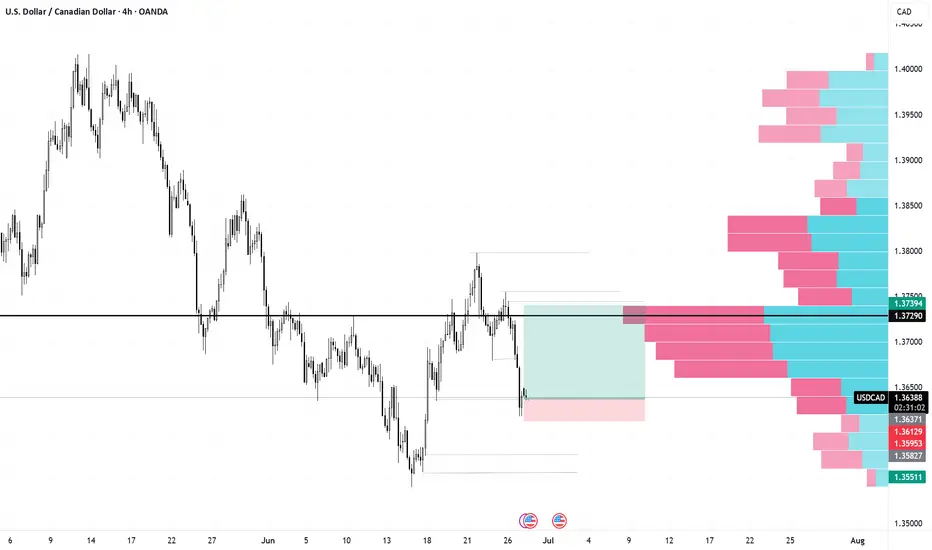
🧠 USD/CAD Technical Analysis – June 26, 2025
On the 4H chart, we observe a confirmed breakout from the descending trendline, followed by a correction. Price is now retracing toward the demand zone between 1.3635 – 1.3610, which is expected to act as support.
✅ Support Zone: 1.3635 – 1.3610
📌 Resistance Zone: 1.3885 – 1.3925
🎯 Final Target: 1.4020
🛡 Stop Loss: Below 1.3515
⚖ Risk-to-Reward Ratio: 1 : 3.17
The structure of higher lows along with the broken trendline confirms a bullish bias. A confirmation candle in the demand zone may offer a solid long entry opportunity.
Regards,
Alireza!

USDCAD possible Long ideaUSDCAD seems to have turned bullish and doing a retracement in H4.
Based on existing confirmation, there is a chance that it reach to liquidity level 1.37392
This is for educational purpose only. Not an investment or financial advise.
USDCAD - Bullish Story: Strong Bullish rally from previous - Market make a corrective move till 0.382 level of FIB and followed by Bullish Flag pattern.
Anticipate : we anticipate market to continue the bullish trend and we plan our entry on the breakout of flag neck line.
PLAN : entry point is break of neckline level, TPs will be as projected through Pole of FLAG.

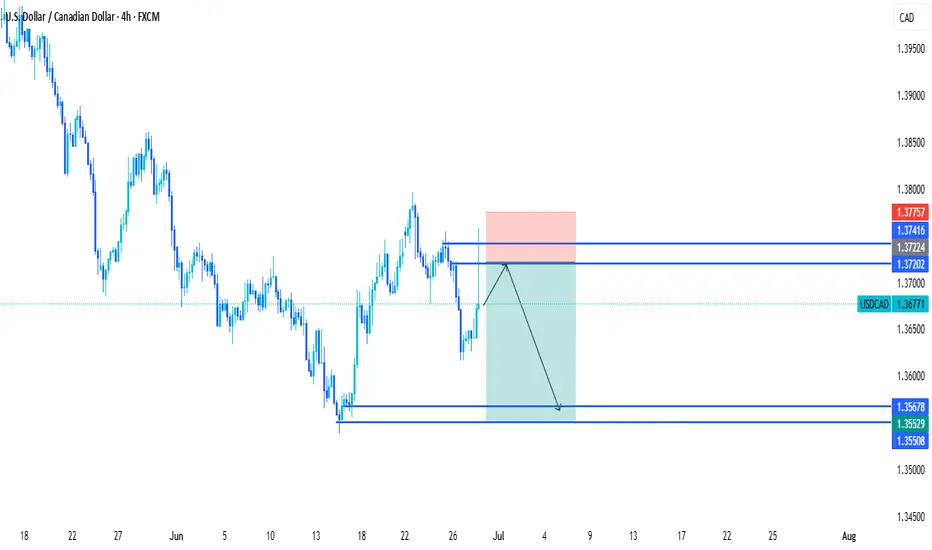
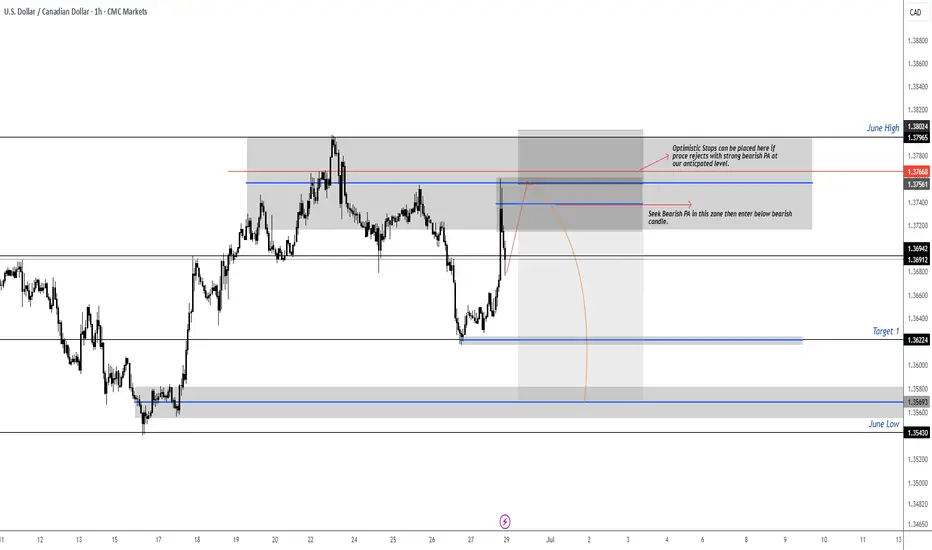
USDCAD RT of Supply Zone then ShortPrice has retraced back into a key supply zone just under the June High. We are now watching for strong bearish price action (PA) to confirm a potential short entry from this area.
Key Zone to Watch:
Supply Zone: 1.3756 – 1.3796
Optimistic stops can be placed above the zone if strong rejection occurs
Plan:
Seek bearish PA within the highlighted supply zone
Wait for confirmation via a bearish candle close
Enter below the trigger candle once setup forms
Targets:
Target 1: 1.3622
Extended Target / June Low: 1.3543
If no rejection occurs and price breaks above the zone with conviction, the setup becomes invalid and we reassess.
Execution will be reactive, not predictive — we trade confirmation, not speculation.
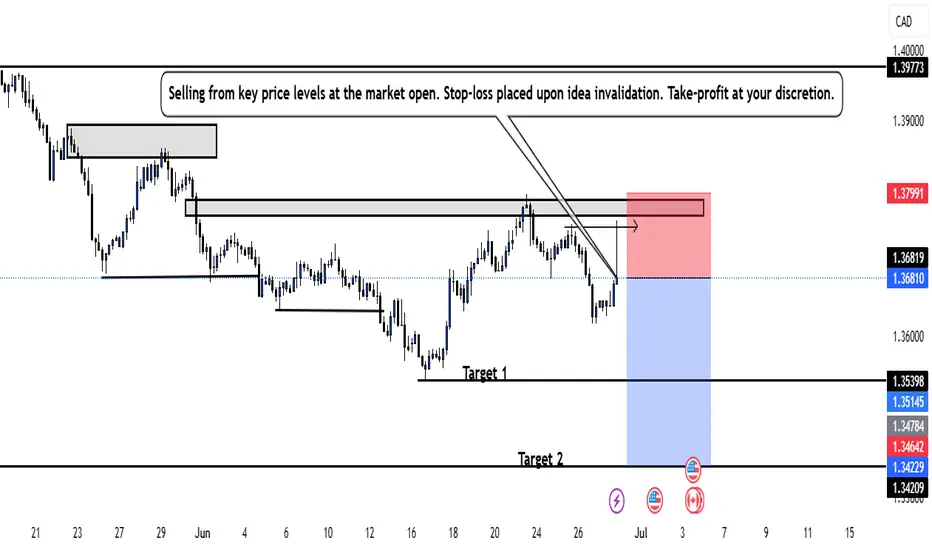
USD/CAD ShortSell-limit order: 1.3838
Stop-loss: 1.3903
Target 1: 1.3705
Target 2: 1.3605
Target 3 (optional runner): 1.3455
Place the limit at 1.3838 and keep the stop above 1.3900; scale out at the listed targets as price moves in your favor.

Should we keep an eye on it?!Hello friends..
This week we should be more on the chart, because most of the charts are in an attractive range for trading.
What our team sees is that the chart (US Dollar to Canadian Dollar) has hit a good range that we previously identified in the daily time frame and has managed to change the trend from a bearish to an upward trend. In the 4-hour time frame, the price shows us the trend change. Now we have to wait and look for a buy trade in the specified range.
The target for this trade can also be 1.3924.
It should be noted that as long as the price does not break the swing low (the line at the bottom) with the candle body, the trend remains upward.
So this week you can put this chart on your watch list.
You can follow our page to see more analysis.

USDCAD ( Weekly CLS Setup) Everything is clear here: a bearish order flow, with signs of manipulation and liquidity grabs above the structure highs. EUR/USD is trending upwards, presenting a good opportunity for a short trade on USD/CAD
When Charts Lie: How Fundamentals Rescued My Forex TradingEvery trader knows the frustration: your analysis is technically flawless, but the market moves against you. I learned this brutally in Q1 2024 when my USD/CAD short—backed by textbook bearish divergence and order block rejection—got steamrolled by a 190-pip rally after Canada’s surprise oil export announcement.
The Blind Spot in Pure Technicals
Price action traders often dismiss fundamentals as "noise," but three scenarios consistently break chart-based systems:
Policy Surprises (SNB removing EUR/CHF floor)
Geopolitical Shocks (Rubles during Ukraine invasion)
Structural Shifts (BOJ abandoning YCC)
These events share one trait: they change the market’s fundamental DNA, invalidating historical patterns.
A Practical Filter
I need to train myself to do something like this: To overlay two fundamental checks before technical entries:
Central Bank Calendar
No trades 12 hours before scheduled meetings
Monitor yield spreads (10YR US vs. DE)
Commodity Links
AUD/USD: Iron ore inventories
USD/CAD: WTI backwardation
Case Study: April 2024 GBP/USD
Technicals suggested continuation above 1.2700
Fundamental red flag: UK real wages shrinking
Outcome: False breakout, 140-pip drop
Your Turn
Try this today: On your next trade, ask:
Is there scheduled event risk?
Does this align with rate expectations?
Are commodities/equities confirming?
The goal isn’t perfection—it’s avoiding obvious mismatches.
For me, I read my own words on what should be done, and most probably, I won't do it. I think the above is too much. I believe there must be an easier way to merge Technical and Fundamental Analysis.
USD/CAD💰Symbol: { USD/CAD }
🟩Price: { 1.36868 }
🟥Stop: { 1.37236 }
1️⃣profit: { 1.36594 }
2️⃣profit: { 1.36183 }
3️⃣profit: { 1.35893 }
4️⃣profit: { 1.35562 }
📊Check your chart before entering.
🚨Check before use to make sure there is no important news.🚨
USD/CAD MILKEDUSD/CAD MILKED we went long on this trade as price delivery switched from a bearish program to a bullish program easy trades, easy setups
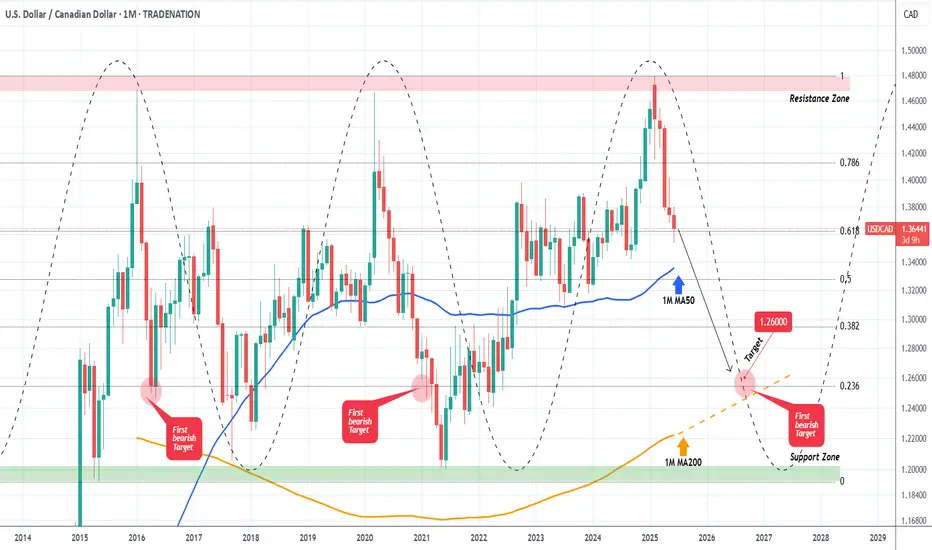
USDCAD Strongest long-term Sell in the market right now.At the beginning of the year (January 15, see chart below), we made an unpopular bearish call at the time, hinting that the USDCAD pair was approaching its Resistance Zone, hence a multi-year Top was in order:
As you can see, the moment the price hit that Resistance Zone, it got instantly rejected and a new Bearish Leg started, which has extended up to this day. This time we view this on the 1M time-frame where the Support levels are more clearly illustrated.
More particularly, the 1M MA50 (blue trend-line) poses as the first one, in fact it has been holding since September 2022. Our Target is still located at 1.26000, which is marginally above the 0236 Fibonacci level, which has been the 1st Target during both previous Bearish Legs. Also it is where the 1M MA200 (orange trend-line) is headed to, and there are high chances of a long-term bounce there.
-------------------------------------------------------------------------------
** Please LIKE 👍, FOLLOW ✅, SHARE 🙌 and COMMENT ✍ if you enjoy this idea! Also share your ideas and charts in the comments section below! This is best way to keep it relevant, support us, keep the content here free and allow the idea to reach as many people as possible. **
-------------------------------------------------------------------------------
Disclosure: I am part of Trade Nation's Influencer program and receive a monthly fee for using their TradingView charts in my analysis.
💸💸💸💸💸💸
👇 👇 👇 👇 👇 👇
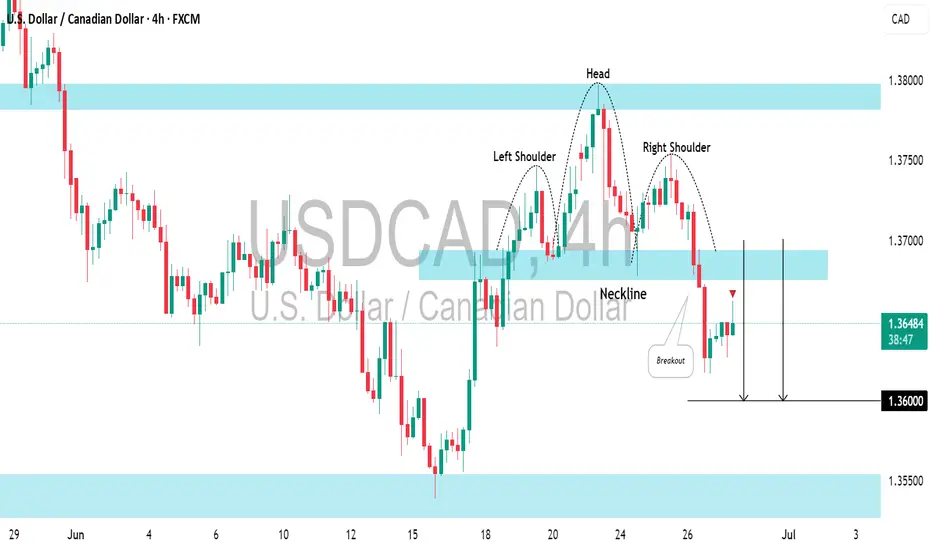
USDCAD: Very Bearish PatternThe USDCAD has created a head and shoulders pattern at a significant intraday horizontal resistance.
A bearish breakout from this neckline indicates strong selling pressure, suggesting that the pair is likely to continue declining, potentially reaching at least the 1.3600 level.
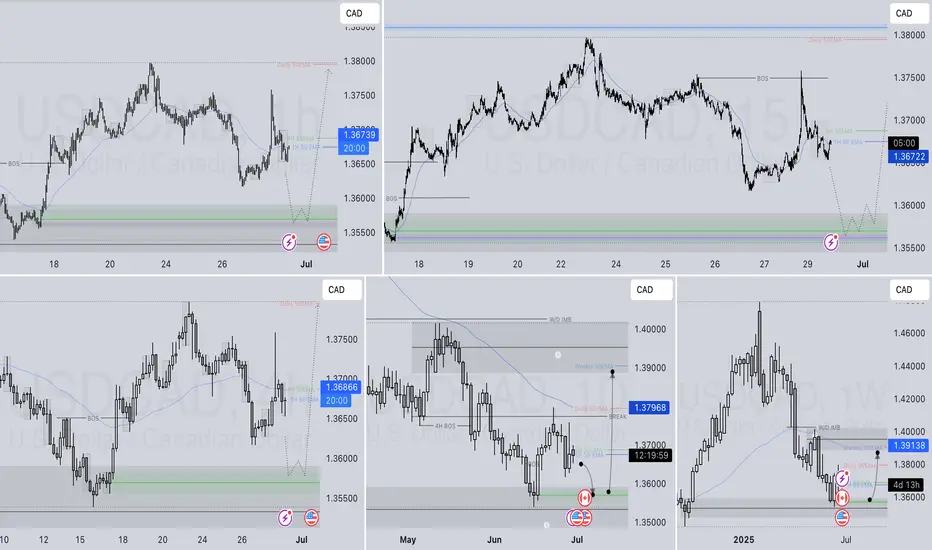
USDJPY and USDCAD Analysis todayHello traders, this is a complete multiple timeframe analysis of this pair. We see could find significant trading opportunities as per analysis upon price action confirmation we may take this trade. Smash the like button if you find value in this analysis and drop a comment if you have any questions or let me know which pair to cover in my next analysis.

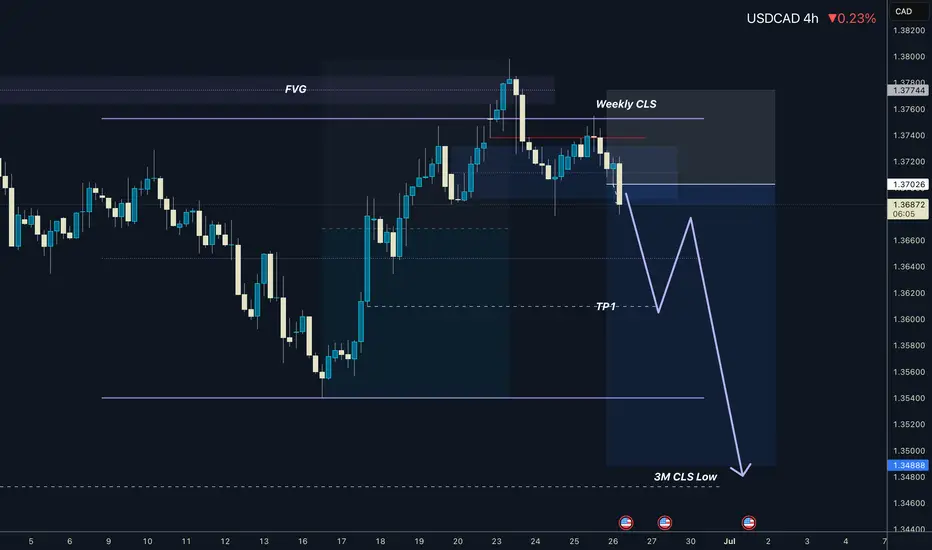
USDCAD I Weekly CLS I Model 1I Target 3M CLS LowHey, Market Warriors, here is another outlook on this instrument
If you’ve been following me, you already know every setup you see is built around a CLS Footprint, a Key Level, Liquidity and a specific execution model.
If you haven't followed me yet, start now.
My trading system is completely mechanical — designed to remove emotions, opinions, and impulsive decisions. No messy diagonal lines. No random drawings. Just clarity, structure, and execution.
🧩 What is CLS?
CLS is real smart money — the combined power of major investment banks and central banks moving over 6.5 trillion dollars a day. Understanding their operations is key to markets.
✅ Understanding the behavior of CLS allows you to position yourself with the giants during the market manipulations — leading to buying lows and selling highs - cleaner entries, clearer exits, and consistent profits.
📍 Model 1
is right after the manipulation of the CLS candle when CIOD occurs, and we are targeting 50% of the CLS range. H4 CLS ranges supported by HTF go straight to the opposing range.
"Adapt what is useful, reject what is useless, and add what is specifically your own."
— David Perk aka Dave FX Hunter ⚔️
👍 Hit like if you find this analysis helpful, and don't hesitate to comment with your opinions, charts or any questions.