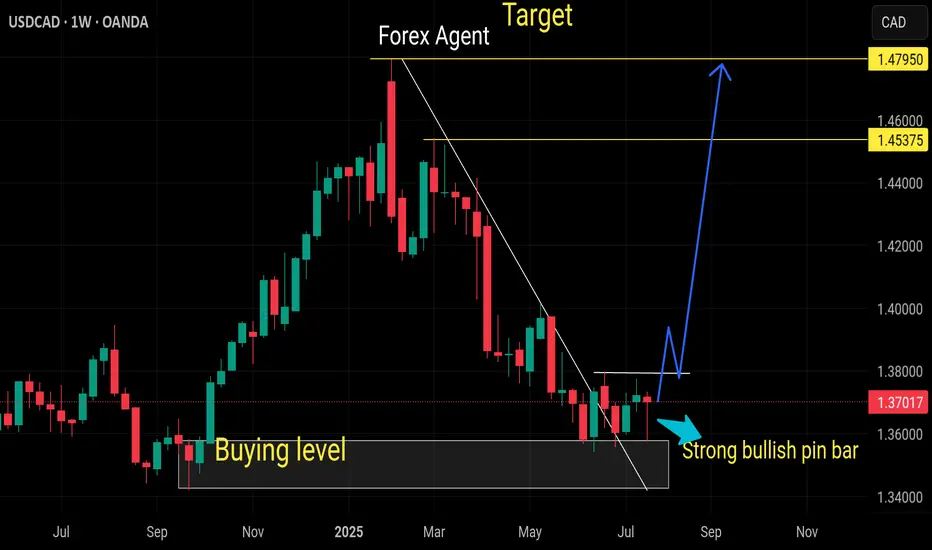
Buy usdcadStrong buyers coming now
Weekly pin rejection
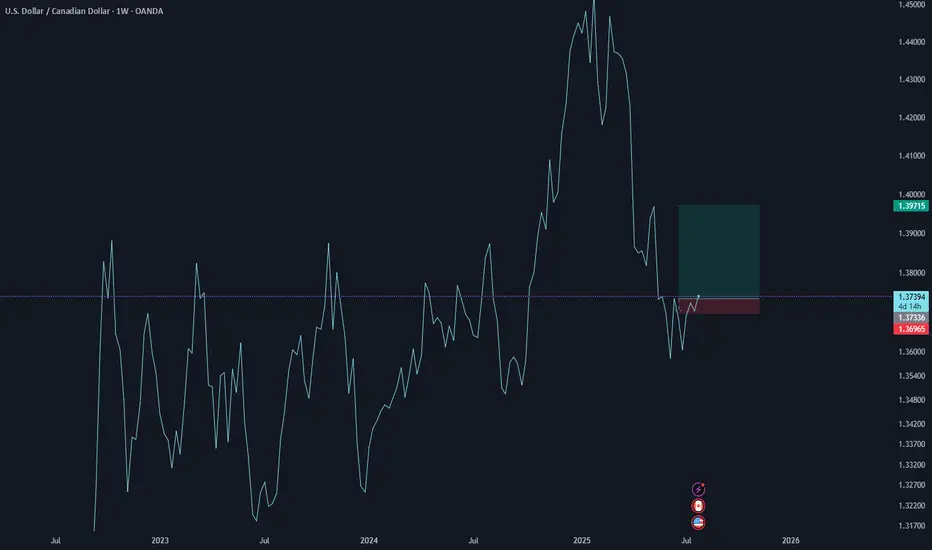
Monthly oversold pair
Daily trend already breaks
USDCAD trade ideas
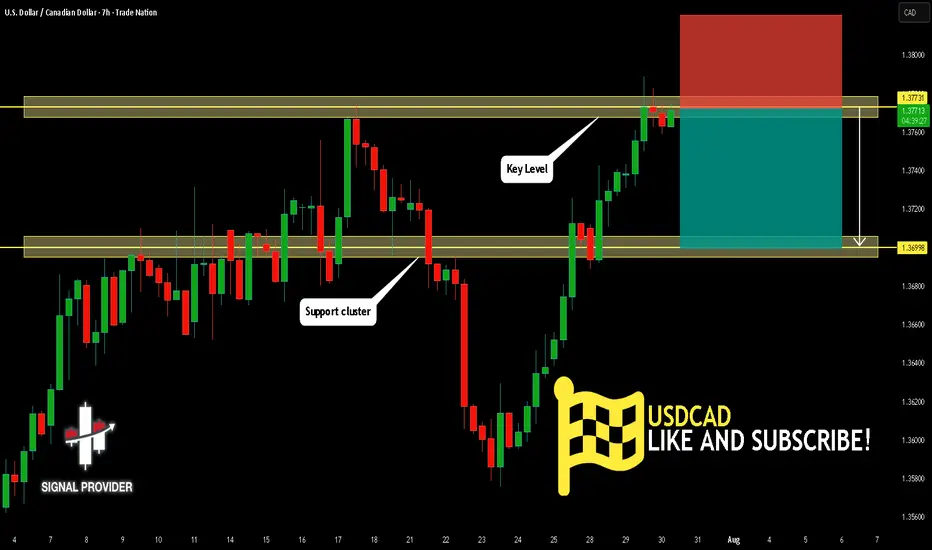
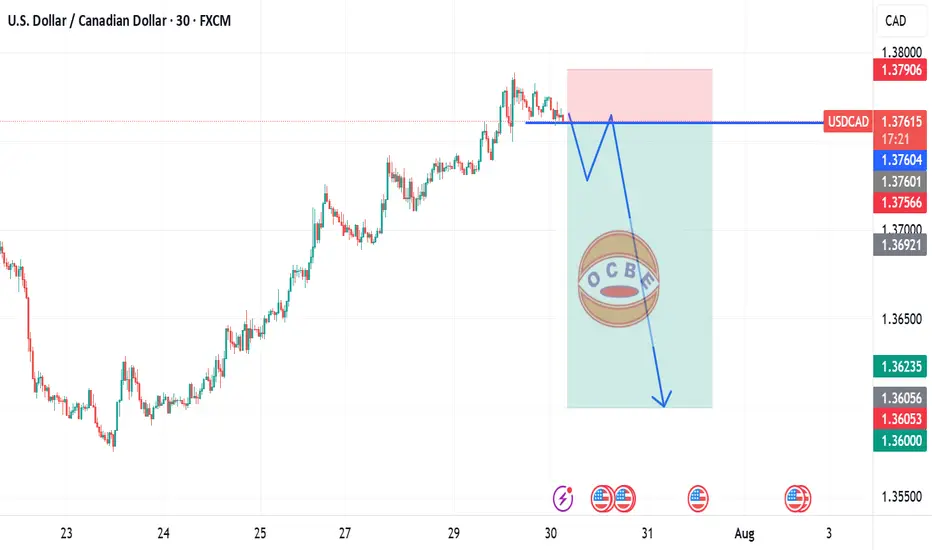
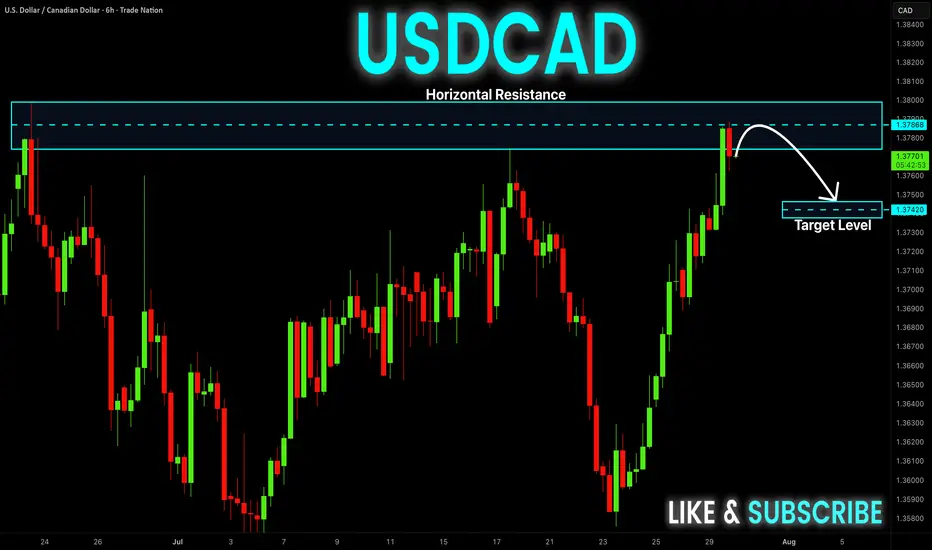
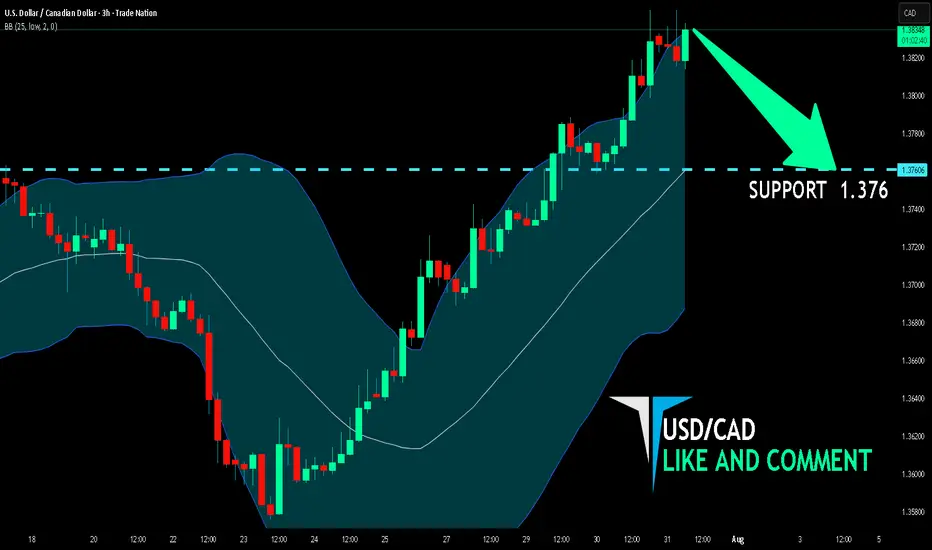
USDCAD Is Bearish! Sell!
Please, check our technical outlook for USDCAD.
Time Frame: 7h
Current Trend: Bearish
Sentiment: Overbought (based on 7-period RSI)
Forecast: Bearish
The market is trading around a solid horizontal structure 1.377.
The above observations make me that the market will inevitably achieve 1.369 level.
P.S
We determine oversold/overbought condition with RSI indicator.
When it drops below 30 - the market is considered to be oversold.
When it bounces above 70 - the market is considered to be overbought.
Disclosure: I am part of Trade Nation's Influencer program and receive a monthly fee for using their TradingView charts in my analysis.
Like and subscribe and comment my ideas if you enjoy them!
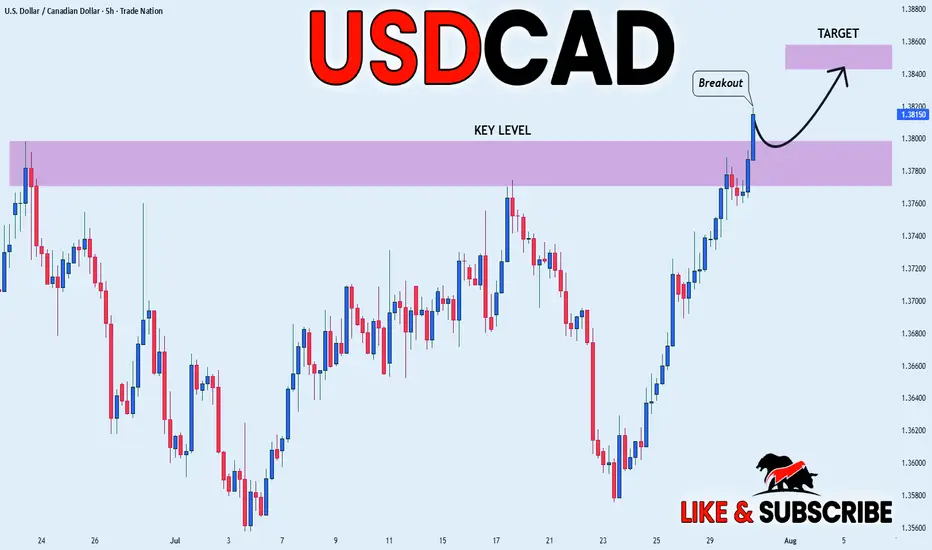
USD_CAD BULLISH BREAKOUT|LONG|
✅USD_CAD is going up
Now and the pair made a bullish
Breakout of the key horizontal
Level of 1.3800 and the breakout
Is confirmed so we are bullish
Biased and we will be expecting
A further bullish move up
LONG🚀
✅Like and subscribe to never miss a new idea!✅
Disclosure: I am part of Trade Nation's Influencer program and receive a monthly fee for using their TradingView charts in my analysis.
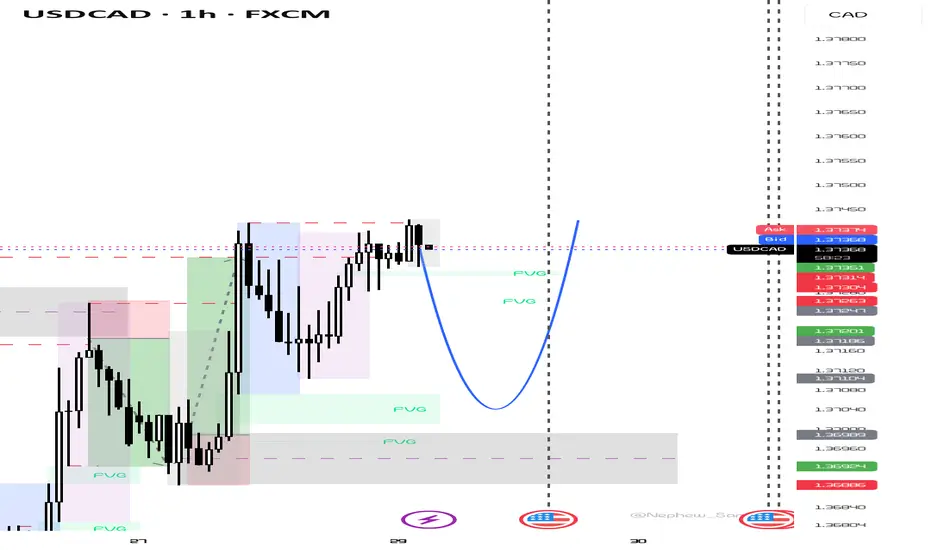
USDCAD 1H buyHello friends. If the price in USDCAD returns to the specified area on the 1h timeframe, it is suitable for a buy position.
This is just a theory

usdcad long Fundamental and candle stick , market structure
up to 1.39750
possible moving
swing long idea for 2 months
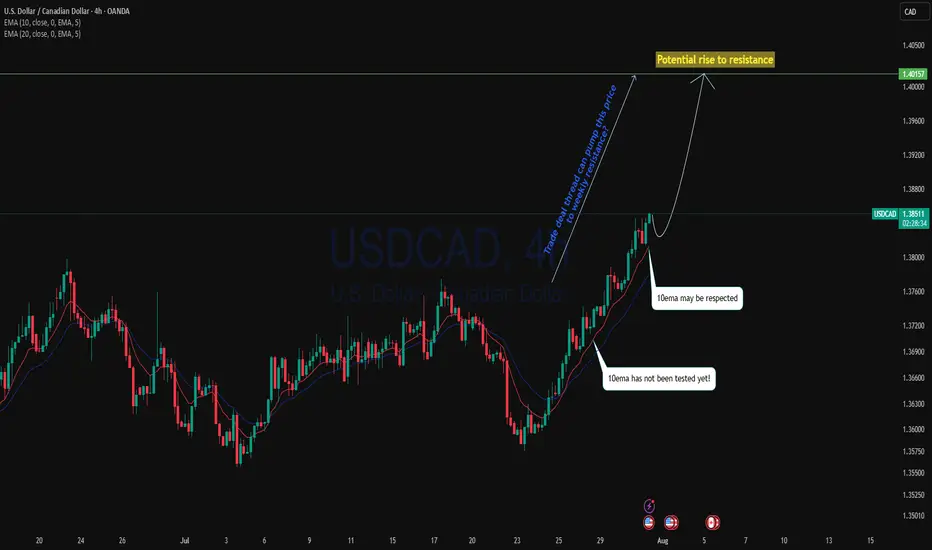
Trade deal thread could pump USDCAD?USDCAD as with the bounce off the monthly support level, current is a strong uptrend.4H perspective, price is trading above 10ema since the cross over of 20ema and 10ema price is pushing back to the upside. With trade deal thread, including upcoming GDP on CAD could pump this price back to the resistance ?
As 10ema has not been tested since cross over, we may see the price to back to the upside with respecting the 10ema.
Buying on EMA is a high probability trade setup.
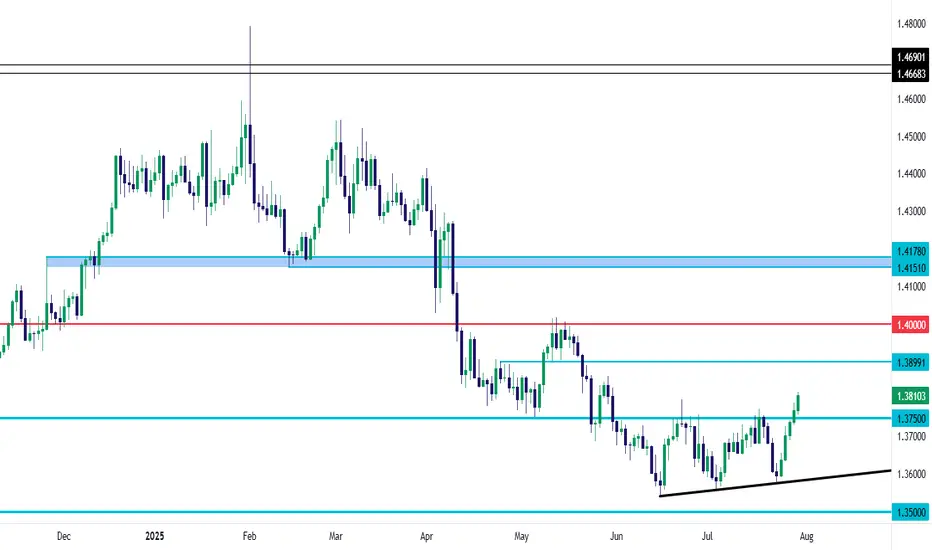
USD/CAD Ascending Triangle BreakoutUSD/CAD was hit hard during the Q2 sell-off in the USD. And with the almost decade long range still in-play for the pair, with the reversal around 1.4500 in February, that makes sense.
The problem quickly became sentiment as sellers jumped on the move so aggressively, and since mid-June bears have had trouble breaking down to any fresh lows.
We can even see an element of this from May, when prices found support at 1.3750 and sellers were suddenly stalled despite a clear downside trend.
This is a great illustration of why sentiment is so important - if anyone that wants to sell or that can sell the pair already has - even the worst news in the world would have trouble pushing fresh lows. Because if there's no supply coming into the market and there's more demand, well, then prices will go up just given basic supply/demand dynamics. And with a heavy built in short position following a clean downside trend, there will be some sellers looking to take profit which is what generates the start of that demand. And then more shorts will be motivated to take profit as they see price rising even with negative news flow, when prices should be falling.
This can continue all the way until we get to a point that is attractive again to draw fresh sellers into the market and in USD/CAD, that was the 1.4000 handle that held a clean show of resistance in mid-May, and that ushered in another wave of selling. But in mid-June, as price got close to the 1.3500 handle, a similar type of thing started to happen as sellers began to shy away from chasing the move.
Initially that allowed for pullback to that same 1.3750 level that was support in May. Sellers took another shot and even as the USD was setting fresh three-year-lows on the first day of Q3, USD/CAD was setting a higher-low above the prior swing. The trendline produced from those two lows came into play just last week - and when combined with the 1.3750 level made for a textbook ascending triangle formation.
Those setups are often tracked with aim of bullish breakout as it's essentially showing a line in the sand that sellers have defended, in this case at 1.3750; but there's a diminishing impact of that resistance as shown from the increasingly higher-lows. The thought is that, eventually, sellers will give way to the buyers that have been defending higher-lows and that will lead to a breakout and fresh highs.
This is what's taking place now in USD/CAD.
This doesn't necessarily mean that bears are done for, as the big question here is the same from back in May, whether we get to a resistance level that's appealing enough to draw fresh shorts into the market. From the chart attached, I've outlined three areas of interest for such, with 1.3900 nearby and 1.4000 above that. If we do see a prolonged push of USD-strength, there's a zone of support-turned-resistance around 1.4151-1.4178 that becomes of interest for bigger-picture scenarios. - js
USDCAD short move
Price is currently at a support level and if there should be a break then i will be expecting more downward movement in price.
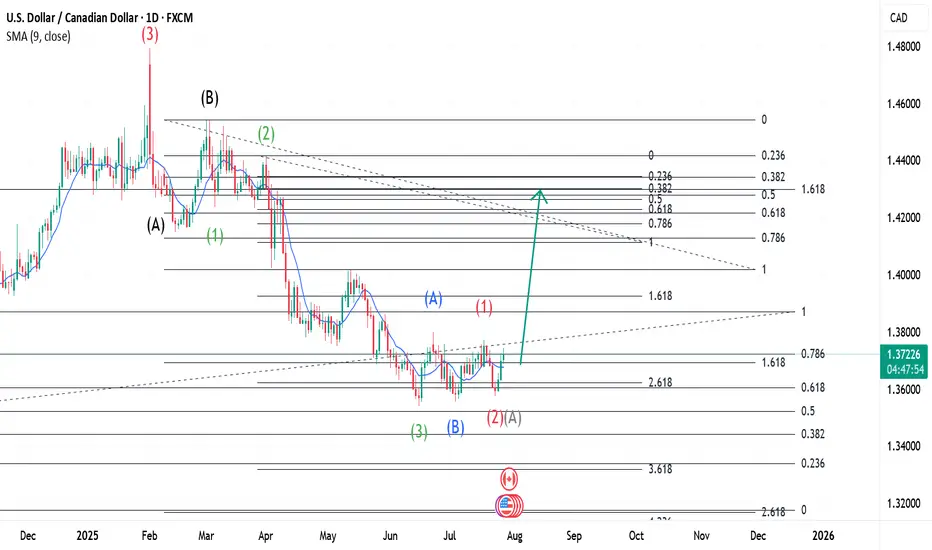
USDCAD ~ Real Time Elliott Wave UpdatesThis is an update of a USDCAD chart I had previously posted. Wave 1(Red) completed and a Wave 2(Red) or Wave A(Grey) has a lso completed. This wave has two readings at the moment because it could be a completed Zigzag or the first Wave of a Flat formation. I will provide updates soon. Analysis remains the same as my previous post and can be used for references. Sentiment still remains buy.
USD/CAD(20250730)Today's AnalysisMarket News:
According to a Reuters/Ipsos poll, Trump's approval rating has fallen to 40%, the lowest level since his second term.
Technical Analysis:
Today's Buy/Sell Levels:
1.3762
Support and Resistance Levels:
1.3820
1.3798
1.3784
1.3739
1.3725
1.3704
Trading Strategy:
If the price breaks above 1.3784, consider a buy entry, with the first target price at 1.3798. If the price breaks below 1.3762, consider a sell entry, with the first target price at 1.3739.
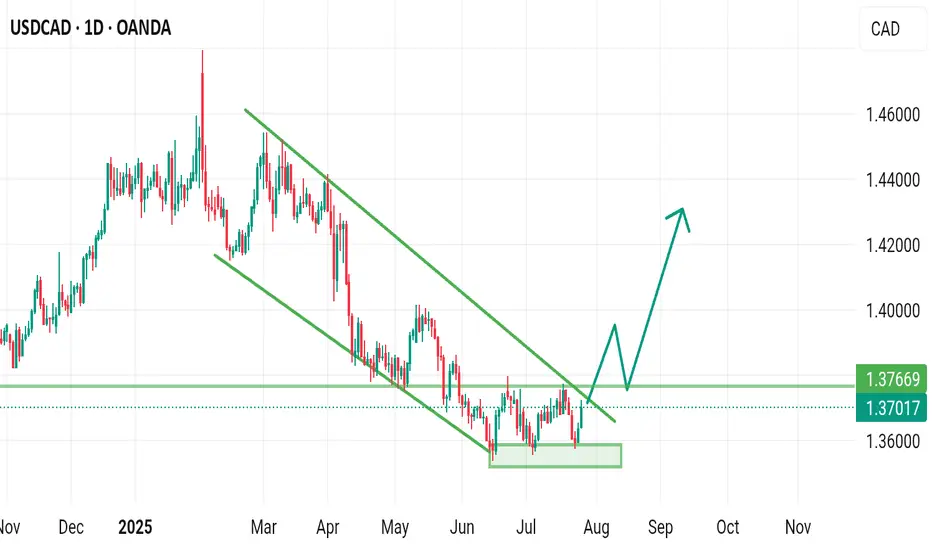
USDCAD USDCAD has entered a range since the start of June.
retesting very strong resistance levels again.
creating a rising wedge reversal at this key high level of resistance.
looking for a sell off

Buy usdcadWe have seen how price create a reversal pattern Wich is triple bottom advisable we are to wait for breaking of the above resistant (and retest) before buying
USDCAD Update: Don’t Sleep on This Uptrend’s First LegYo traders, Skeptic from Skeptic Lab here! 🚀 USDCAD’s serving a hot long trigger for pattern traders chasing the first leg of a big uptrend! We’ve got an ascending triangle breakout on the daily, with bullish candles stacking up, hinting at a return to the weekly bullish trend. Too early to confirm, but the momentum’s fire.
📈 Today’s FOMC meeting’s got everyone buzzing—will Powell cut, hold, or drop resignation hints? Check the full setup in the video, but with crazy news like Federal Funds Rate
, s tick to high-probability trades, keep risk low, and no FOMO or revenge trading! Drop your thoughts, boost if it vibes <3

ENTRY USDCADDisclaimer:
This is merely a chart-based analytical trading idea and is not considered investment advice. Please manage your risks carefully and conduct your own research before making any trading decisions.
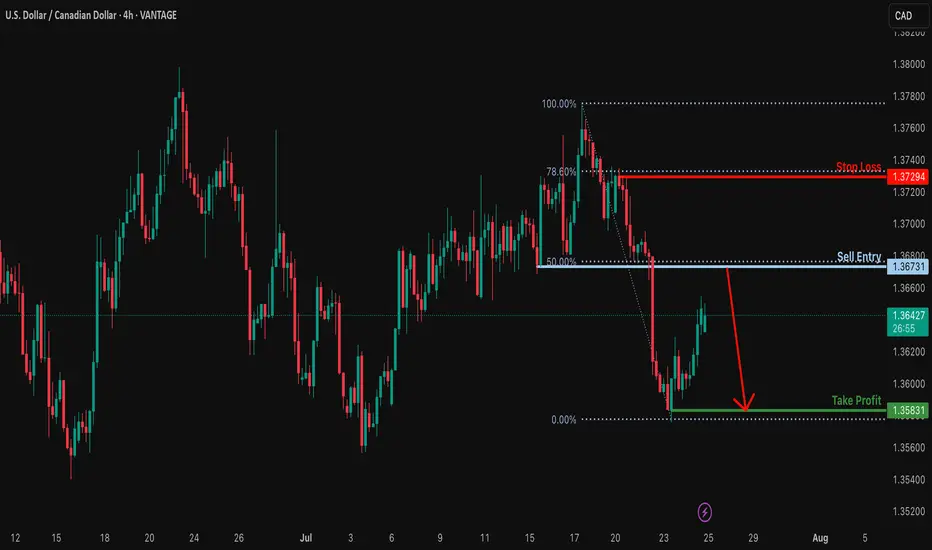
Heading into 50% Fibonacci resistance?USD/CAD is rising towards the resistance level, which serves as a pullback resistance that aligns with the 50% Fibonacci retracement and could reverse from this level to our take-profit target.
Entry: 1.3673
Why we like it:
There is a pullback resistance that lines up with the 50% Fibonacci retracement.
Stop loss: 1.3729
Why we like it:
There is a pullback resistance that lines up with the 78.6% Fibonacci retracement.
Take profit: 1.3583
Why we like it:
There is a swing low support.
Enjoying your TradingView experience? Review us!
Please be advised that the information presented on TradingView is provided to Vantage (‘Vantage Global Limited’, ‘we’) by a third-party provider (‘Everest Fortune Group’). Please be reminded that you are solely responsible for the trading decisions on your account. There is a very high degree of risk involved in trading. Any information and/or content is intended entirely for research, educational and informational purposes only and does not constitute investment or consultation advice or investment strategy. The information is not tailored to the investment needs of any specific person and therefore does not involve a consideration of any of the investment objectives, financial situation or needs of any viewer that may receive it. Kindly also note that past performance is not a reliable indicator of future results. Actual results may differ materially from those anticipated in forward-looking or past performance statements. We assume no liability as to the accuracy or completeness of any of the information and/or content provided herein and the Company cannot be held responsible for any omission, mistake nor for any loss or damage including without limitation to any loss of profit which may arise from reliance on any information supplied by Everest Fortune Group.
USD-CAD Short From Resistance! Sell!
Hello,Traders!
USD-CAD went up and
Retested a horizontal
Resistance of 1.3800
From where we are
Already seeing a local
Bearish pullback and
As we are locally bearish
Biased so we will be
Expecting a local move down
Sell!
Comment and subscribe to help us grow!
Check out other forecasts below too!
Disclosure: I am part of Trade Nation's Influencer program and receive a monthly fee for using their TradingView charts in my analysis.
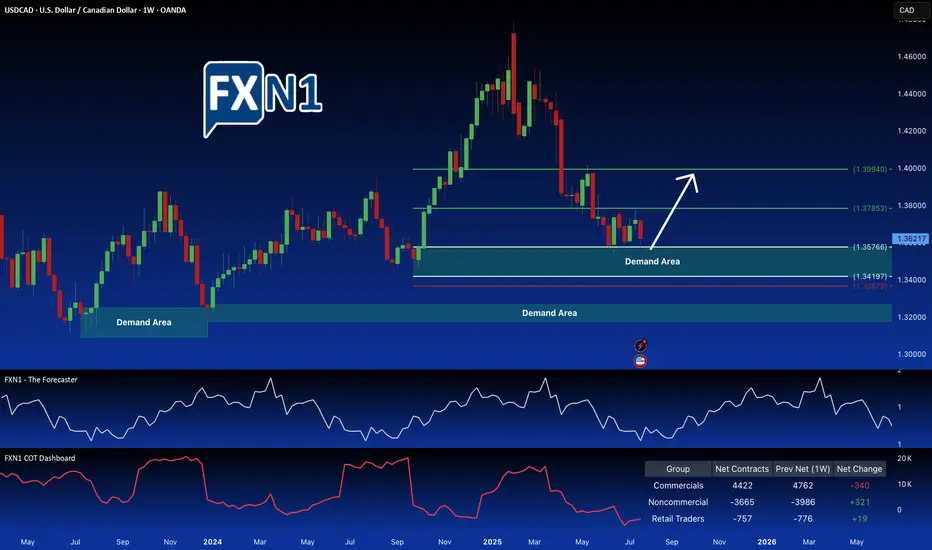
USDCAD Trade Idea: Potential for Further GainsI've initiated a long position on USDCAD at the retest of the key demand zone at 1.35766. Positive indicators support this trade: non-commercial traders are also accumulating long positions, and a notable shift is observed in the CAD futures market, with commercials moving from a bearish to a potentially bullish stance. Furthermore, seasonal trends favor a USD strengthening against the CAD. A further drop in price could present another attractive entry point at a lower demand zone.
✅ Please share your thoughts about USD/CAD in the comments section below and HIT LIKE if you appreciate my analysis. Don't forget to FOLLOW ME; you will help us a lot with this small contribution.
USD/CAD SHORT FROM RESISTANCE
Hello, Friends!
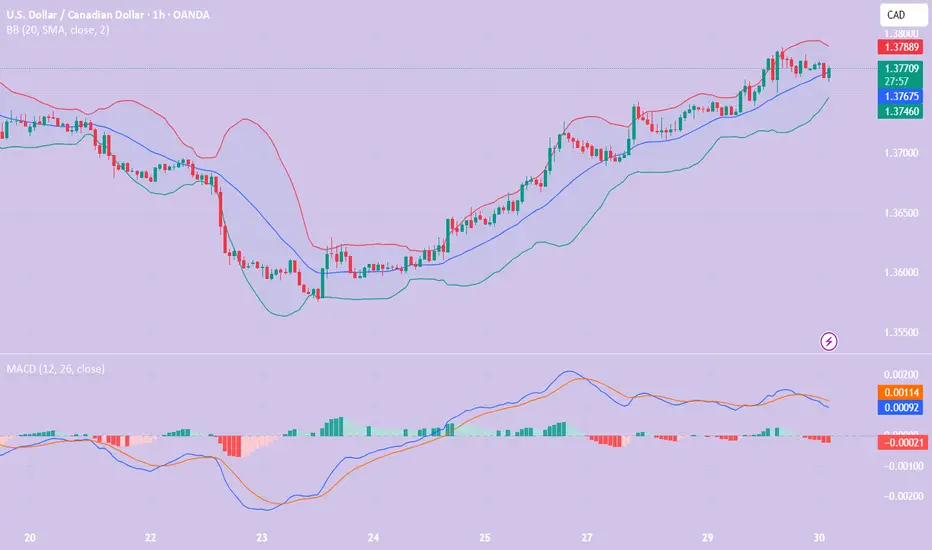
It makes sense for us to go short on USD/CAD right now from the resistance line above with the target of 1.376 because of the confluence of the two strong factors which are the general downtrend on the previous 1W candle and the overbought situation on the lower TF determined by it’s proximity to the upper BB band.
Disclosure: I am part of Trade Nation's Influencer program and receive a monthly fee for using their TradingView charts in my analysis.
✅LIKE AND COMMENT MY IDEAS✅
USDCAD SELLUSD/CAD rallies further, approaches 1.3900 on higher levies to Canada
The US Dollar keeps marching higher, as the Canadian Dollar struggles after Trump decided to increase tariffs to Canada to 35% from the previous 25%, escalating the trading tension with one of its main trading partners. The US President justified his decision on Canada’s alleged reluctance to cooperate on curbing the traffic of fentanyl and other drugs across the US border
The year will be politically marked by Trump’s return to the White House. A Republican government is seen as positive for financial markets, but Trump’s pledge to cut taxes and impose tariffs on foreign goods and services may introduce uncertainty to both the political and economic landscape.
Canada’s political crisis peaked in late 2024 with a no-confidence vote against Prime Minister Justin Trudeau, leading to snap elections and a weakened Liberal minority government. Policy uncertainty and economic challenges dominate 2025’s outlook, raising concerns over market stability and investor confidence.
The BoC is set to continue easing interest rates through 2025, at least at a faster pace than the Fed is expected to, which could apply pressure on CAD’s already-rising rate differential.
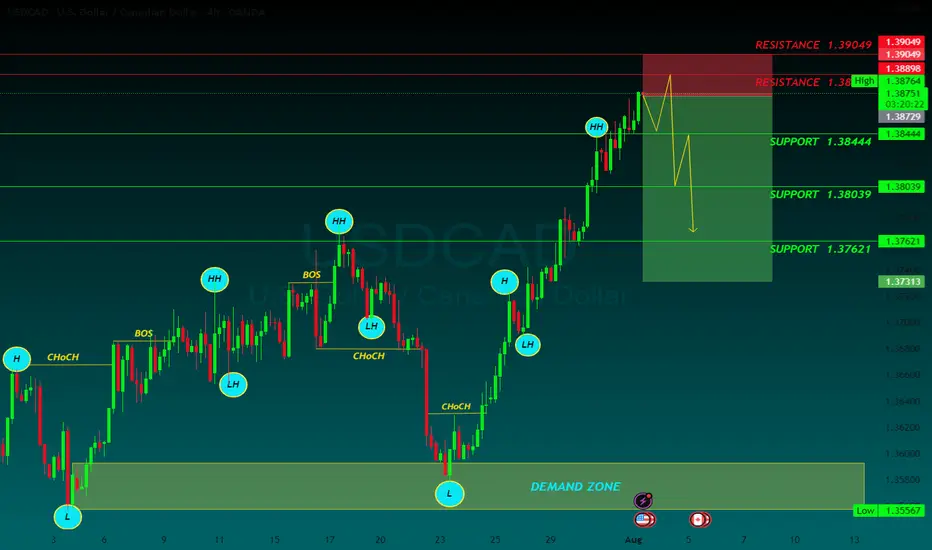
SUPPORT 1.38444
SUPPORT 1.38039
SUPPORT 1.37621
RESISTANCE 1.38889
RESISTANCE 1.39049
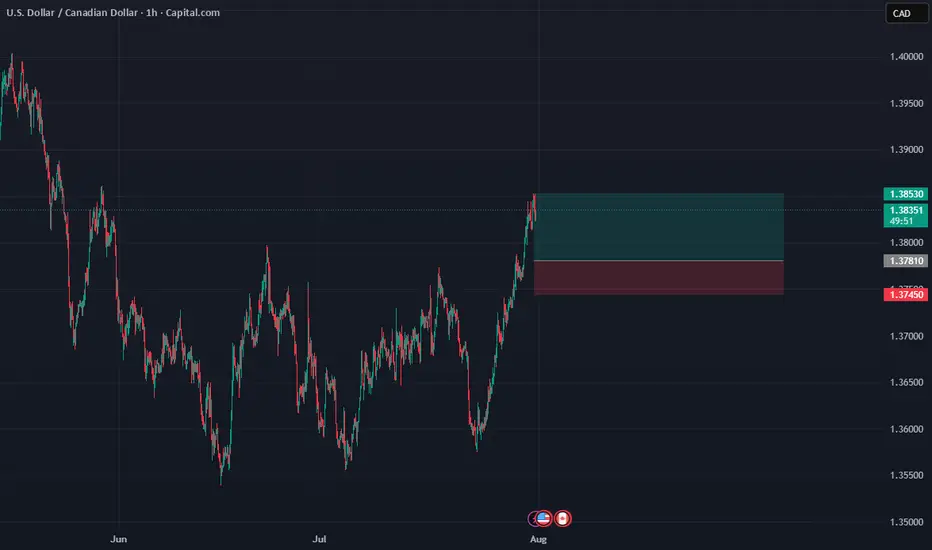
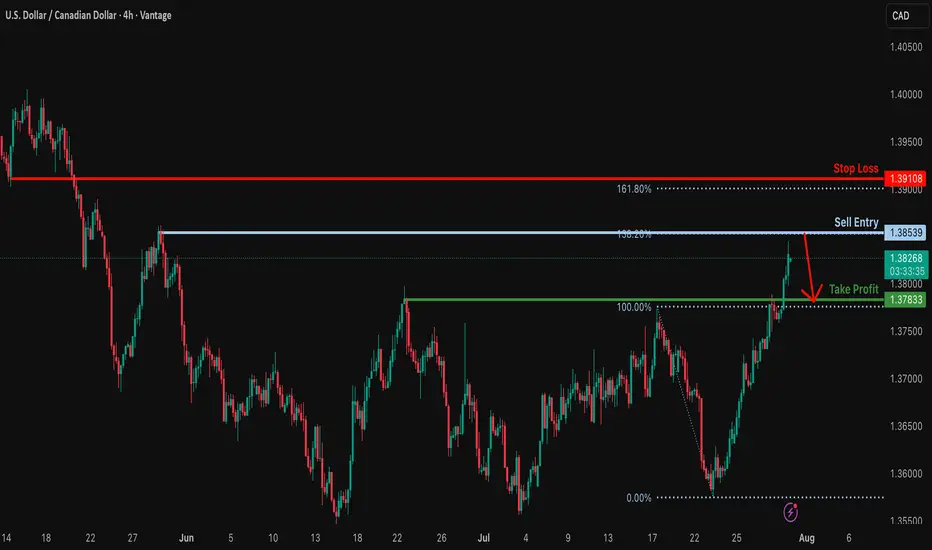
Could the Loonie reverse from here?The price is rising towards the resistance level, which is a swing high resistance that aligns with the 138.2% Fibonacci extension and could potentially reverse from this level to our take-profit.
Entry: 1.3853
Why we like it:
There is a swing high resistance that lines up with the 138.2% Fibonacci extension.
Stop loss: 1.3910
Why we like it:
There is a pullback resistance that is slightly above the 161.8% Fibonacci extension.
Take profit: 1.3783
Why we like it:
There is a pullback support.
Enjoying your TradingView experience? Review us!
Please be advised that the information presented on TradingView is provided to Vantage (‘Vantage Global Limited’, ‘we’) by a third-party provider (‘Everest Fortune Group’). Please be reminded that you are solely responsible for the trading decisions on your account. There is a very high degree of risk involved in trading. Any information and/or content is intended entirely for research, educational and informational purposes only and does not constitute investment or consultation advice or investment strategy. The information is not tailored to the investment needs of any specific person and therefore does not involve a consideration of any of the investment objectives, financial situation or needs of any viewer that may receive it. Kindly also note that past performance is not a reliable indicator of future results. Actual results may differ materially from those anticipated in forward-looking or past performance statements. We assume no liability as to the accuracy or completeness of any of the information and/or content provided herein and the Company cannot be held responsible for any omission, mistake nor for any loss or damage including without limitation to any loss of profit which may arise from reliance on any information supplied by Everest Fortune Group.
USD/ CAD Are We Heading to $1.46 Territory Watch OUT Afternoon Trading Family
Based on what we are seeing is a nice bullish run up to the following levels :
Levels To Watch For:
1) $1.39
2) $1.41
3) $1.43
4) $1.46
However be aware if we for whatever reason we sink back into the 1.35 territory then we could see a drop down to 1.34
Trade Smarter Live Better
Kris
