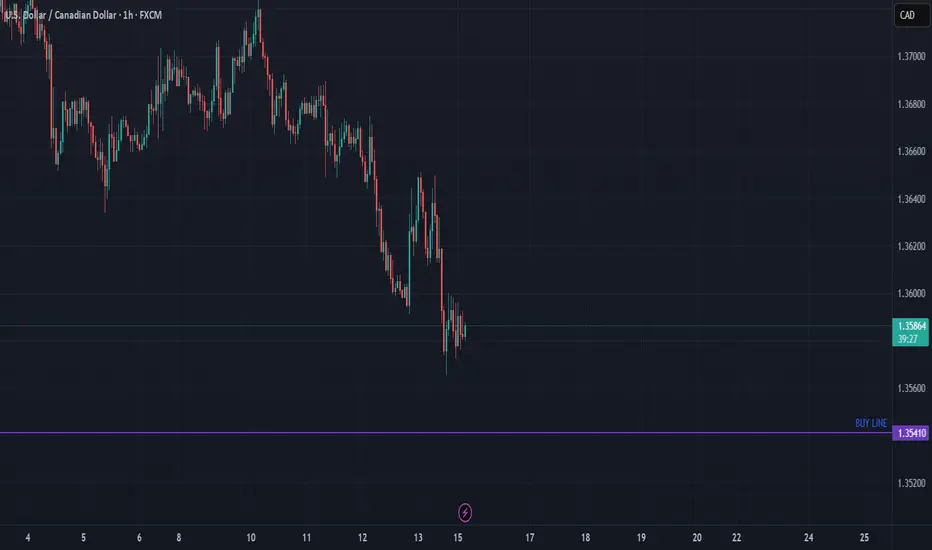
usd cad for buying Hi usd cad good zone for buying now
good zone trend on small frame
volume for buying now
USDCAD trade ideas
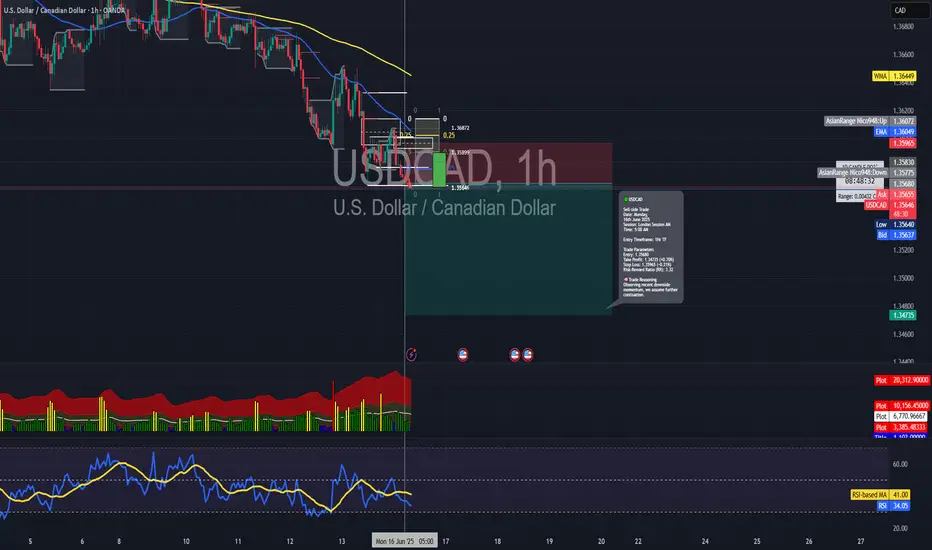
Short trade 🔻 USDCAD – Sell-side Trade
Date: Monday, 16th June 2025
Session: London Session AM
Time: 5:00 AM
Entry Timeframe: 1Hr TF
Trade Parameters
Entry: 1.35680
Take Profit: 1.34735 (+0.70%)
Stop Loss: 1.35965 (−0.21%)
Risk-Reward Ratio (RR): 3.32
🧠 Trade Reasoning
USDCAD has shown sustained bearish momentum on both 1Hr and 4Hr timeframes, with a clear lower high forming beneath the 1.35800 area. This trade was initiated on confirmation of a bearish rejection from a supply zone during the early London session volatility.
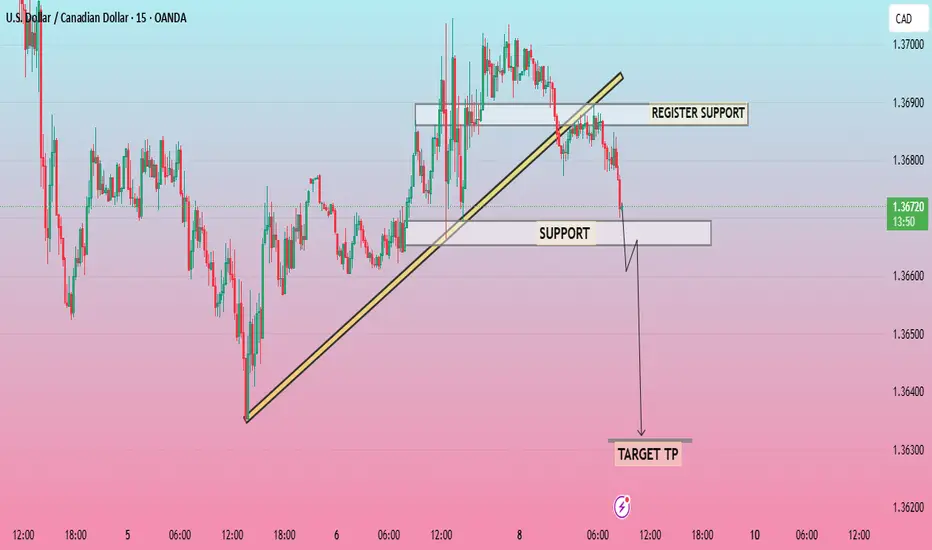
USDCAD 15 MINUTEYour chart on USD/CAD (15-minute timeframe) clearly shows a bearish breakdown from the ascending trendline, and here’s a quick analysis based on what you’ve marked:
---
📉 Technical Breakdown
🔻 Trendline Broken: Price has broken below the ascending trendline, indicating loss of bullish momentum.
🧱 Register Support (turned resistance): Price rejected after testing this area – confirms a bearish flip.
🧭 Support Zone (gray box): Price is currently testing this level. If it breaks below, continuation to TP is likely.
🎯 Target TP: Marked around 1.3625–1.3630, showing good confluence with prior swing lows.
---
✅ Bearish Bias Confirmation
This looks like a textbook setup:
Break of trendline ✅
Retest of broken support (now resistance) ✅
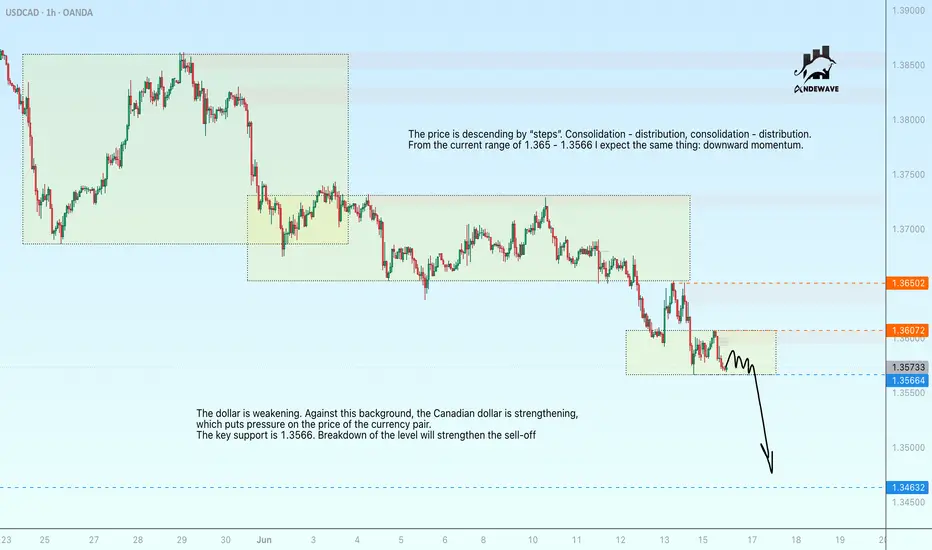
USDCAD may hit bottom amid DXY declineThe dollar is weakening. Against this background, the Canadian dollar is strengthening, which puts pressure on the price of the currency pair.
The key support is 1.3566. Breakdown of the level will strengthen the sell-off
The price is descending by “steps”. Consolidation - distribution, consolidation - distribution.
From the current range of 1.365 - 1.3566 I expect the same thing: downward momentum.
Scenario: consolidation and price sticking to 1.3566, decrease in volatility and squeeze to the urvon may lead to a breakdown and a fall.
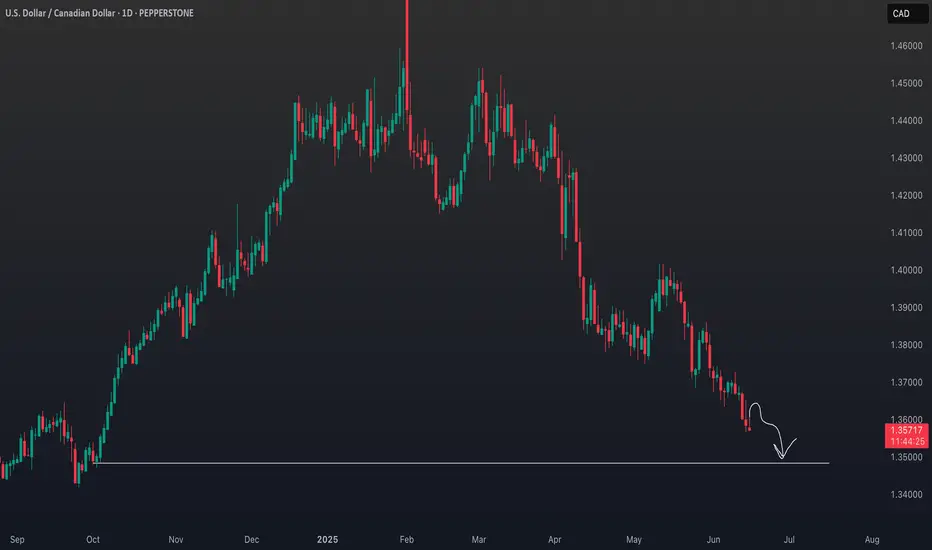
USDCAD Under Pressure: Chart Signals & Macro Forces Point South!The USDCAD pair is under clear pressure, as illustrated in this chart 📊. The visual structure highlights a persistent bearish trend, with price action consistently forming lower highs and lower lows. The chart is reinforcing the idea that sellers are dominating the market. Notably, the drawn arrow in the chart points toward previous higher timeframe lows, suggesting that these areas could be the next logical targets for price action if the current trend persists.
On the fundamental side, the US dollar has been weakened by dovish signals from the Federal Reserve and softer economic data, fueling expectations of potential rate cuts later this year 🏦. In contrast, the Canadian dollar has been buoyed by strong commodity prices—especially oil—and a relatively hawkish Bank of Canada. The bearish structure seen in the chart aligns with these macro drivers, as the CAD continues to benefit from both domestic strength and global demand for commodities.
Geopolitically, ongoing global trade tensions and shifting risk sentiment have further supported the Canadian dollar, as investors seek stability in commodity-backed currencies 🌍. The combination of these factors, as reflected in the chart, suggests that USDCAD remains vulnerable, and a move down to retest previous higher timeframe lows is a real possibility unless there’s a significant shift in the underlying fundamentals.
Traders should keep an eye on the key support zones highlighted in the chart, as these could provide clues for potential exhaustion or reversal in the current trend 🔎.
Disclaimer: This analysis is for informational purposes only and does not constitute financial advice. Please conduct your own research or consult a professional before making any trading decisions.
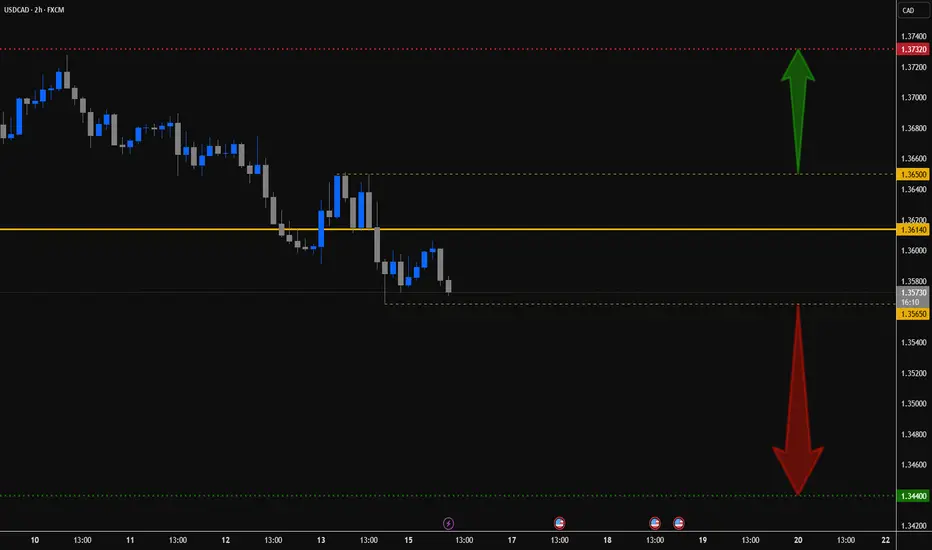
USD/CAD - Potential TargetsDear Friends in Trading,
How I see it,
Key Confluence - NOW RESISTANCE @ 1.36140
Potential "SHORT" Target:
1] Monitor psychological level @ 1.3500 for a possible bounce
2] 1.34400
Alternatively - A strong break above1.36500
Potential "LONG" Target -
1] 1.37320
I sincerely hope my point of view offers a valued insight.
Thank you for taking the time to study my analysis.
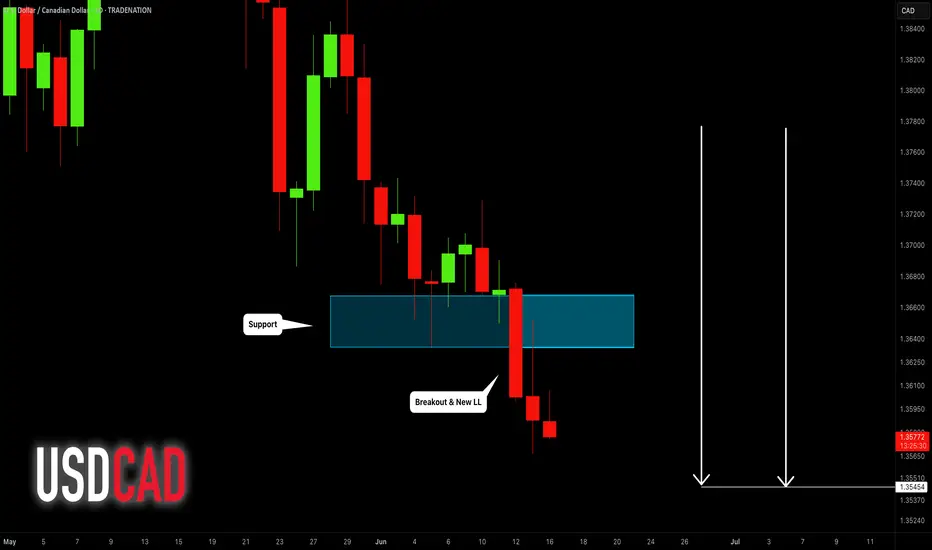
USDCAD: Bearish Trend Continues 🇺🇸🇨🇦
Amid the geopolitical tensions and a bullish rally on Crude Oil,
USDCAD is going to drop more.
The closest support that I see is 1.3545.
It will be the next goal for the sellers.
❤️Please, support my work with like, thank you!❤️
I am part of Trade Nation's Influencer program and receive a monthly fee for using their TradingView charts in my analysis.
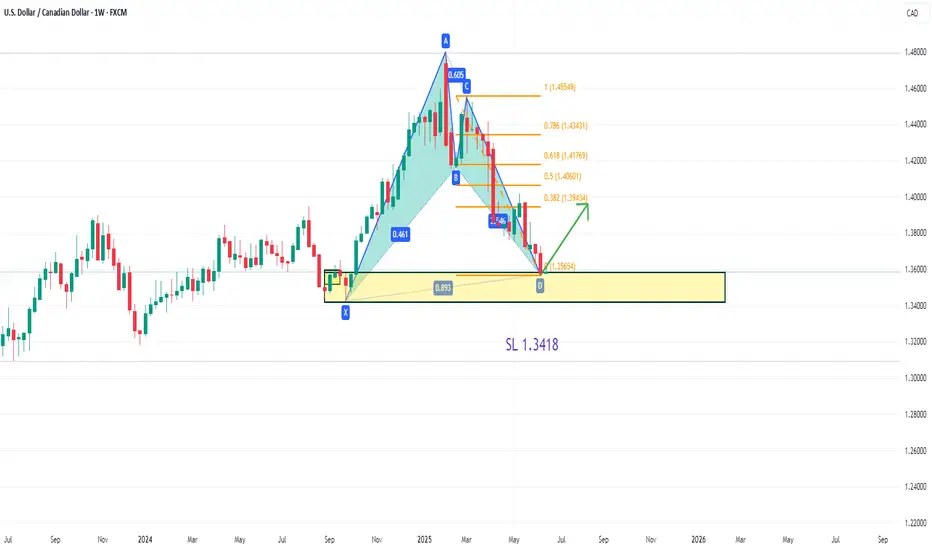
USDCAD has formed a bullish bat patternOn the weekly chart, USDCAD formed a bullish bat pattern. The current market is in the previous demand area. You can consider buying around 1.3580, and the upside target is around 1.3943.
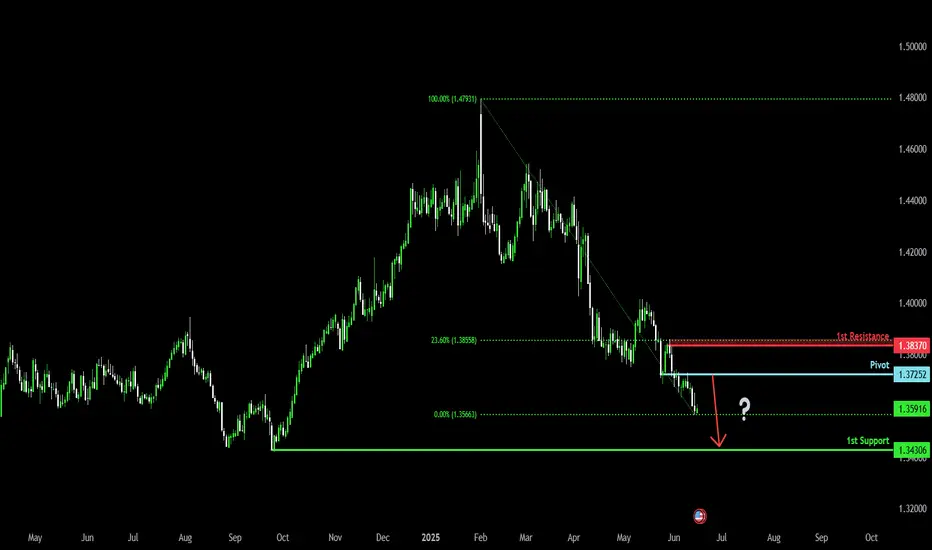
Bearish continuation for the Loonie?The price has rejected off the pivot and could drop to the 1st support which acts as a pullback support.
Pivot: 1.3725
1st Support: 1.3430
1st Resistance: 1.3837
Risk Warning:
Trading Forex and CFDs carries a high level of risk to your capital and you should only trade with money you can afford to lose. Trading Forex and CFDs may not be suitable for all investors, so please ensure that you fully understand the risks involved and seek independent advice if necessary.
Disclaimer:
The above opinions given constitute general market commentary, and do not constitute the opinion or advice of IC Markets or any form of personal or investment advice.
Any opinions, news, research, analyses, prices, other information, or links to third-party sites contained on this website are provided on an "as-is" basis, are intended only to be informative, is not an advice nor a recommendation, nor research, or a record of our trading prices, or an offer of, or solicitation for a transaction in any financial instrument and thus should not be treated as such. The information provided does not involve any specific investment objectives, financial situation and needs of any specific person who may receive it. Please be aware, that past performance is not a reliable indicator of future performance and/or results. Past Performance or Forward-looking scenarios based upon the reasonable beliefs of the third-party provider are not a guarantee of future performance. Actual results may differ materially from those anticipated in forward-looking or past performance statements. IC Markets makes no representation or warranty and assumes no liability as to the accuracy or completeness of the information provided, nor any loss arising from any investment based on a recommendation, forecast or any information supplied by any third-party.
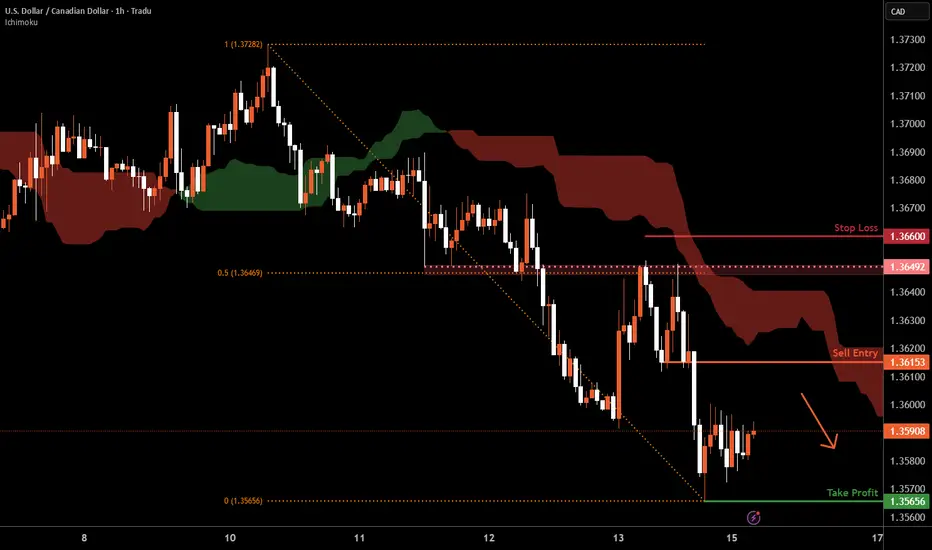
USD/CAD H1 | Bearish downtrend to extend deeper?USD/CAD is rising towards a pullback resistance and could potentially reverse off this level to drop lower.
Sell entry is at 1.3615 which is a pullback resistance.
Stop loss is at 1.3660 which is a level that sits above the 50% Fibonacci retracement and an overlap resistance.
Take profit is at 1.3565 which is a swing-low support.
High Risk Investment Warning
Trading Forex/CFDs on margin carries a high level of risk and may not be suitable for all investors. Leverage can work against you.
Stratos Markets Limited (tradu.com ):
CFDs are complex instruments and come with a high risk of losing money rapidly due to leverage. 63% of retail investor accounts lose money when trading CFDs with this provider. You should consider whether you understand how CFDs work and whether you can afford to take the high risk of losing your money.
Stratos Europe Ltd (tradu.com ):
CFDs are complex instruments and come with a high risk of losing money rapidly due to leverage. 63% of retail investor accounts lose money when trading CFDs with this provider. You should consider whether you understand how CFDs work and whether you can afford to take the high risk of losing your money.
Stratos Global LLC (tradu.com ):
Losses can exceed deposits.
Please be advised that the information presented on TradingView is provided to Tradu (‘Company’, ‘we’) by a third-party provider (‘TFA Global Pte Ltd’). Please be reminded that you are solely responsible for the trading decisions on your account. There is a very high degree of risk involved in trading. Any information and/or content is intended entirely for research, educational and informational purposes only and does not constitute investment or consultation advice or investment strategy. The information is not tailored to the investment needs of any specific person and therefore does not involve a consideration of any of the investment objectives, financial situation or needs of any viewer that may receive it. Kindly also note that past performance is not a reliable indicator of future results. Actual results may differ materially from those anticipated in forward-looking or past performance statements. We assume no liability as to the accuracy or completeness of any of the information and/or content provided herein and the Company cannot be held responsible for any omission, mistake nor for any loss or damage including without limitation to any loss of profit which may arise from reliance on any information supplied by TFA Global Pte Ltd.
The speaker(s) is neither an employee, agent nor representative of Tradu and is therefore acting independently. The opinions given are their own, constitute general market commentary, and do not constitute the opinion or advice of Tradu or any form of personal or investment advice. Tradu neither endorses nor guarantees offerings of third-party speakers, nor is Tradu responsible for the content, veracity or opinions of third-party speakers, presenters or participants.
POSSIBLE BUY OPPORTUNITY ON USDCADUSDCAD has been pushing down for some time and is somewhat over sold. We seem to have found a good demand zone at which to go long!
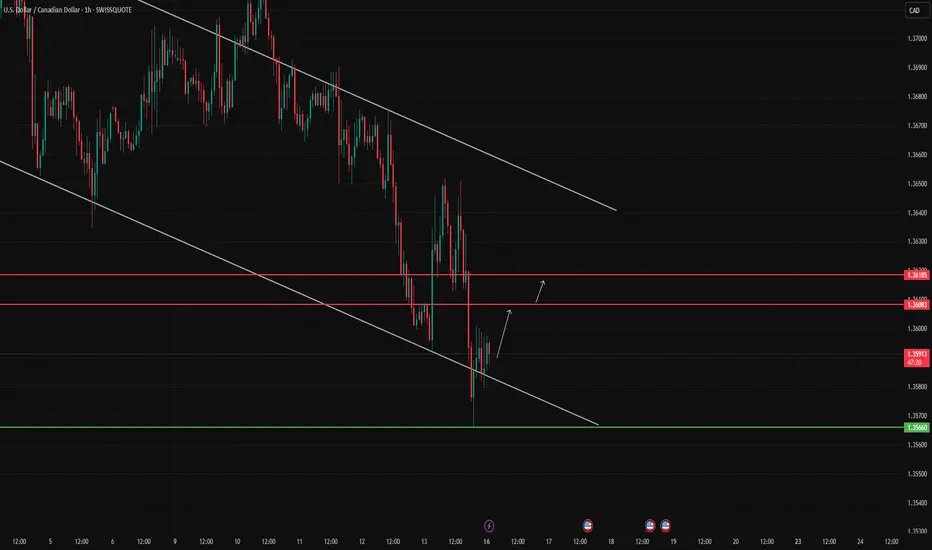
USD/CAD Testing Channel Support – Watching for Bullish Rebound
USD/CAD is currently trading near the lower boundary of a well-defined descending channel. The price has shown signs of holding near 1.35660 support, which may lead to a short-term rebound.
If momentum builds, the first resistance to watch is 1.36083, followed by 1.36185. However, a confirmed break below 1.35660 would invalidate the bullish scenario and open room for further downside.
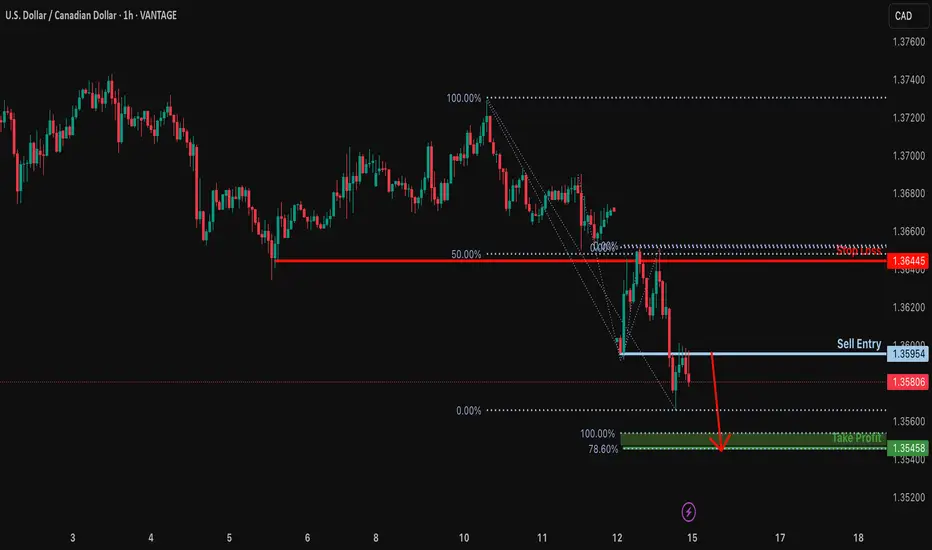
Bearish continuation?USD/CAD has rejected off the resistance level which is a pullback resistance and could drop from this level to our take profit.
Entry: 1.3595
Why we like it:
There is a pullback resistance level.
Stop loss: 1.3644
Why we like it:
There is an overlap resistance level that aligns with the 50% Fibonacci retracement.
Take profit: 1.3545
Why we like it:
There is a support level at the 100% and the 78.6% Fibonacci projection.
Enjoying your TradingView experience? Review us!
Please be advised that the information presented on TradingView is provided to Vantage (‘Vantage Global Limited’, ‘we’) by a third-party provider (‘Everest Fortune Group’). Please be reminded that you are solely responsible for the trading decisions on your account. There is a very high degree of risk involved in trading. Any information and/or content is intended entirely for research, educational and informational purposes only and does not constitute investment or consultation advice or investment strategy. The information is not tailored to the investment needs of any specific person and therefore does not involve a consideration of any of the investment objectives, financial situation or needs of any viewer that may receive it. Kindly also note that past performance is not a reliable indicator of future results. Actual results may differ materially from those anticipated in forward-looking or past performance statements. We assume no liability as to the accuracy or completeness of any of the information and/or content provided herein and the Company cannot be held responsible for any omission, mistake nor for any loss or damage including without limitation to any loss of profit which may arise from reliance on any information supplied by Everest Fortune Group.
USDCAD TRADE SETUPWait for retest the entry level then take a trade for Sell otherwise skip this setup
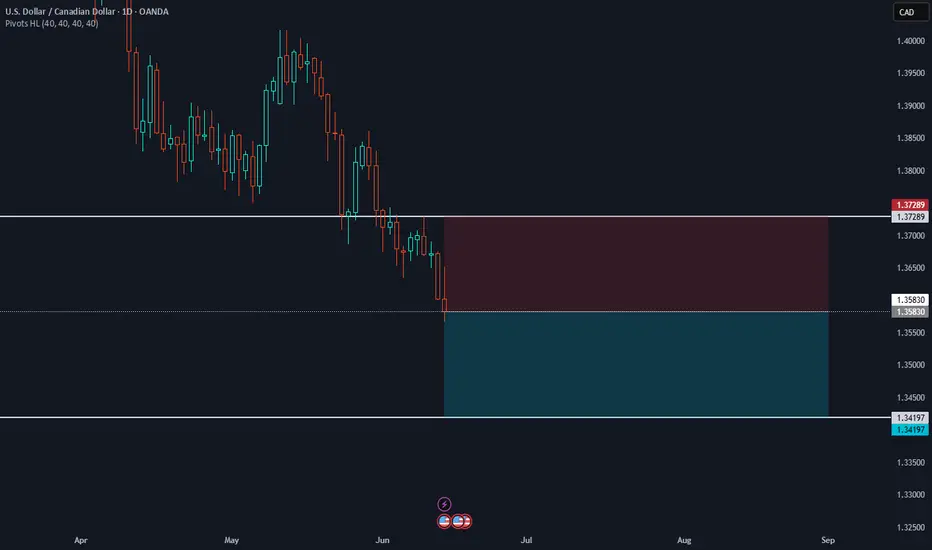
USDCAD - Medium term prediction - 16/06/25Given the daily down-trend and your clear break below the 1.3729 pivot, the path of least resistance is down toward 1.3420 rather than back up to 1.3729:
Trend
USD/CAD has been in a multi-month down-trend from the 1.4800 highs, carving lower highs and lower lows.
Broken support → resistance
That 1.3729 level failed as support in late May and should now act as resistance on any rally.
Momentum
Recent daily closes are rolling over into new lows, with no bullish divergence to suggest a reversal yet.
Slide to 1.3420 ~70% Down-trend continuation into the next demand zone
Rally back to 1.3729 ~30% Requires reclaiming 1.3600–1.3650 and bullish follow-through
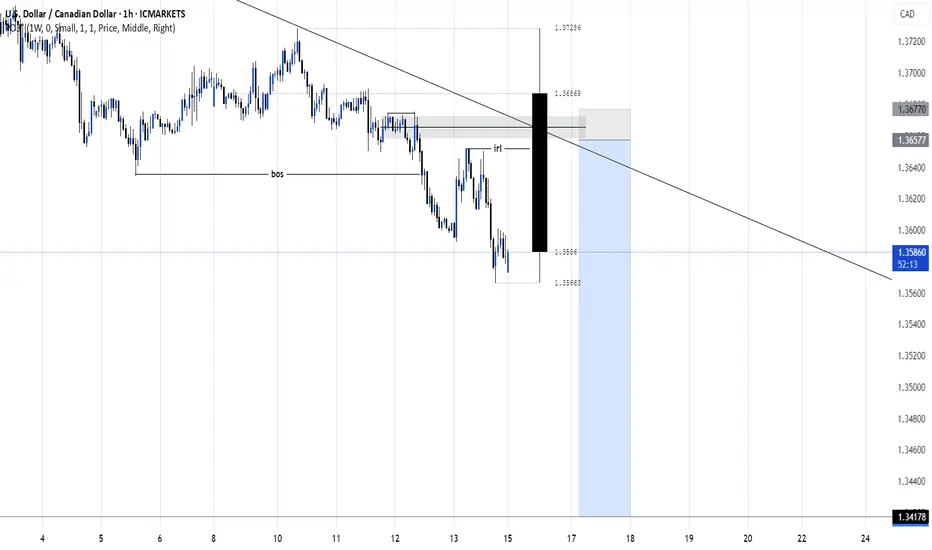
Trend Alert – USD/CAD Could Be Preparing for a Major Reversal!🚨 Trend Alert – USD/CAD Could Be Preparing for a Major Reversal! 🚨
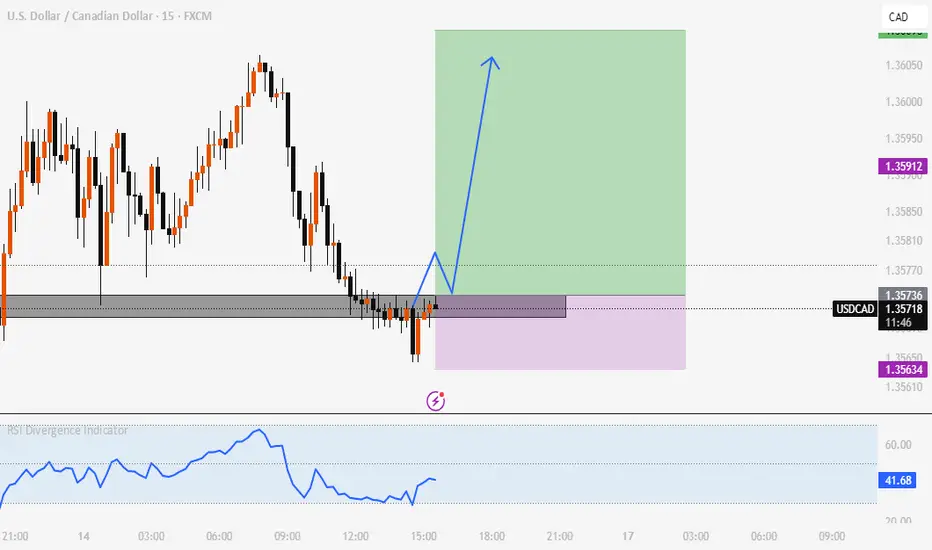
Traders, be cautious! The USD/CAD pair appears to be approaching a critical turning point. The market has now reached significant monthly support levels, and we are currently hovering around a marked green zone — a region known for potential bullish reactions.
For quite some time, the market has been in a strong bearish trend, consistently showing Breaks of Structure (BOS) to the downside. If you've been observing closely, you'll notice that the price action has been favoring sellers for weeks, if not months.
However, the dynamics might be changing soon.
There’s a large pool of liquidity building up above the current price levels. This creates the perfect condition for a strong bullish pump. The market could seize this opportunity to shift its direction and initiate a fresh uptrend.
💡 Key Insight: The current setup suggests that the bearish phase might be exhausted, and we could see the start of a bullish rally from this green support zone.
📉 Selling traders – proceed with caution! The risk of a sudden upside move is high, and holding onto short positions without proper risk management could be dangerous.
🧠 As always: Do Your Own Research (DYOR).
📛 This is not financial advice — just a heads-up from a market observer who’s keeping an eye on the charts!

Possible bullish outlook Structure wise , price is currently sitting on the first poi for a bullish reaction, I would be watching either poi , to see how price reacts bullishly

USDCADBank of Canada (BoC) June 2025 Interest Rate Decision
The BoC held its key interest rate steady at 2.75% on June 4, 2025, marking the second consecutive hold after a series of cuts totaling 225 basis points since mid-2024.
The Bank Rate remains at 3.00%, and the deposit rate at 2.70%.
The decision reflects ongoing uncertainty from U.S. trade policies and tariffs, which continue to pose risks to Canada’s economic growth and inflation outlook.
The BoC emphasized the need to monitor the effects of trade tensions and inflation pressures before making further moves.
The next BoC rate announcement is scheduled for July 30, 2025.
Federal Reserve (Fed) June 2025 Interest Rate Decision
The Fed held its target federal funds rate at 4.25–4.50% in its June 2025 meeting, maintaining a cautious, data-dependent stance amid mixed inflation and labor market signals.
Recent data showed inflation moderating but still above target, and the labor market softening but resilient, leading the Fed to pause rate changes while assessing incoming economic information.
Market pricing indicates a growing probability of a rate cut later in 2025, possibly starting in September, contingent on sustained disinflation and labor market trends.
The Fed continues to monitor risks from tariffs and global economic uncertainties.
JUNE 18th economic data will be watched by BOC Gov Macklem Speaks and BOC Summary of Deliberations
Federal Reserve will update Federal Funds Rate 4.50% 4.50%,FOMC Economic Projections,FOMC Statement and FOMC Press Conference
In summary: Both the BoC and Fed paused rate changes in June 2025, reflecting a cautious approach amid economic uncertainties—trade tensions for Canada and inflation/labor market data for the US. Markets expect potential easing later in the year if conditions deteriorate
1. USD/CAD and Oil Price Correlation
Strong Negative Correlation:
USD/CAD and oil prices exhibit a strong inverse correlation. When oil prices rise, the Canadian dollar (CAD) tends to appreciate against the US dollar (USD), causing USD/CAD to fall, and vice versa.
Reason: Canada is a major oil exporter (over 3 million barrels/day), so oil revenues significantly impact Canada’s trade balance and economic health. Higher oil prices improve Canada’s terms of trade and strengthen CAD.
Recent Trends:
Although this correlation remains strong, its intensity has somewhat weakened recently due to other factors like global risk sentiment and trade dynamics. Still, oil remains a key driver of CAD strength.
2. USD/CAD and 10-Year Bond Yields
Interest Rate Differentials Influence:
The difference between US and Canadian 10-year government bond yields affects USD/CAD. A higher US yield relative to Canada tends to strengthen USD versus CAD, pushing USD/CAD higher. Conversely, if Canadian yields rise relative to US yields, CAD strengthens, lowering USD/CAD.
Risk Sentiment and Yield Movements:
Bond yields reflect economic growth expectations and monetary policy outlooks. Diverging economic conditions or central bank actions between the US and Canada influence these yields and thus USD/CAD.
Example: If US yields rise due to Fed tightening while Canadian yields stay stable, USD/CAD may rise.
3. Central Bank Interest Rate Decisions
Monetary Policy Impact:
The Federal Reserve (Fed) and Bank of Canada (BoC) interest rate decisions are crucial drivers of USD/CAD.
Rate Hikes: If the Fed raises rates or signals hawkishness while BoC holds or cuts, USD tends to strengthen against CAD, pushing USD/CAD higher.
Rate Cuts: Conversely, if BoC hikes or signals hawkishness and Fed eases, CAD strengthens, lowering USD/CAD.
Policy Divergence: Market expectations around these decisions create volatility in USD/CAD.
4. Carry Trade Advantage
Carry Trade Basics:
Carry trade involves borrowing in a currency with low interest rates and investing in a currency with higher rates to earn the interest differential.
USD/CAD Context:
If Canadian interest rates are higher than US rates, investors may borrow USD to invest in CAD assets, supporting CAD and lowering USD/CAD.
Interest Rate Differentials: The attractiveness of carry trades depends on the interest rate spread between the two countries and market risk appetite.
Risk Considerations: Carry trades can unwind quickly during market stress, causing sharp USD/CAD moves.
5. Uncovered Interest Rate Parity (UIP)
UIP Theory:
Uncovered Interest Rate Parity (UIP) is an economic and financial theory that explains the relationship between interest rates and exchange rates between two countries.
Key Points of UIP:
Definition: UIP states that the difference in nominal interest rates between two countries equals the expected change in exchange rates between their currencies over the same period. In other words, if one country has a higher interest rate, its currency is expected to depreciate relative to the currency of the country with the lower interest rate.
Implication: This means investors should expect no arbitrage opportunities from interest rate differentials alone because any potential gains from higher interest rates in one country will be offset by losses from currency depreciation.
Example:
Suppose the US has a 6% interest rate and India has a 14% interest rate. According to UIP, the Indian rupee is expected to depreciate against the US dollar by approximately 8% (the difference in interest rates) over the investment period. So, although an investor might earn higher interest in India, the currency depreciation offsets the gain.
Relation to Law of One Price: UIP is similar to the "Law of One Price," which states that identical goods or securities should have the same price globally when adjusted for exchange rates.
Difference from Covered Interest Rate Parity (CIP):
UIP does not involve hedging exchange rate risk with forward contracts; it uses expected future spot rates.
CIP involves using forward contracts to lock in exchange rates, eliminating currency risk.
Formula:
The expected change in exchange rate ≈ difference in interest rates between two countries.
USD/CAD Implication:
Traders watch interest rate differentials and expectations to forecast USD/CAD moves, but must consider that other factors (oil prices, risk sentiment) also influence the pair.
Summary Table
Factor Impact on USD/CAD Explanation
Oil Prices Higher oil → CAD strengthens → USD/CAD ↓ Canada’s oil exports support CAD
10-Year Bond Yield Differential Higher US yields → USD strengthens → USD/CAD ↑ Reflects monetary policy and growth outlooks
Central Bank Rate Decisions Fed hike > BoC hike → USD/CAD ↑ Interest rate differentials drive flows
Carry Trade Higher CAD rates → carry trade inflows → USD/CAD ↓ Investors seek higher yields in CAD
Uncovered Interest Rate Parity Interest rate gap ≈ expected exchange rate change Theoretical equilibrium, often imperfect
Conclusion
The USD/CAD pair is heavily influenced by oil prices, with a strong negative correlation due to Canada’s oil export dependence.
Interest rate differentials and central bank policies between the US and Canada also play a critical role, affecting bond yields and carry trade flows.
While carry trade strategies can amplify movements, they carry risk during market volatility.
Uncovered Interest Rate Parity provides a theoretical framework for exchange rate expectations but is often influenced by other market factors, including commodity prices and risk sentiment.
#USDCAD

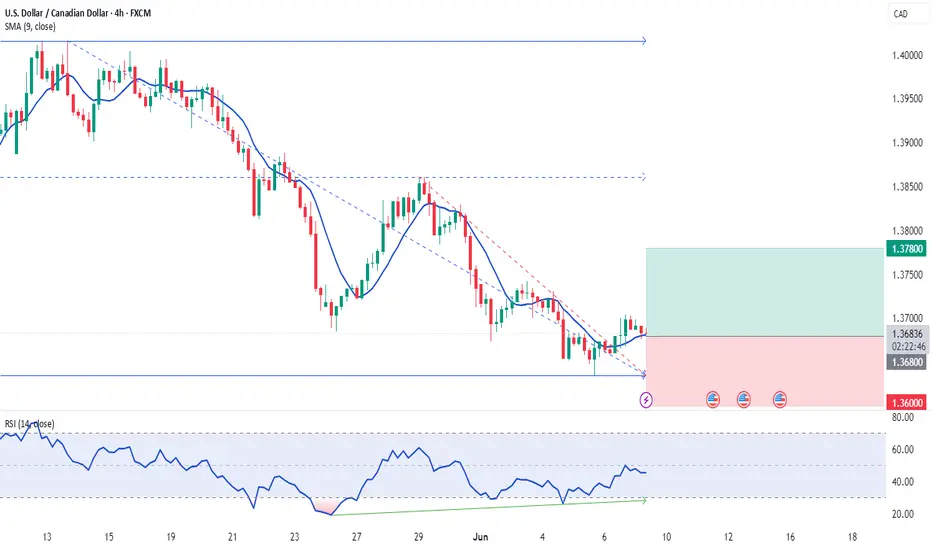
USDCAD | 09.06.2025BUY 1.36800 | STOP 1.36000 | TAKE 1.37800 | Technically, a local upward reversal pattern and divergence is forming.
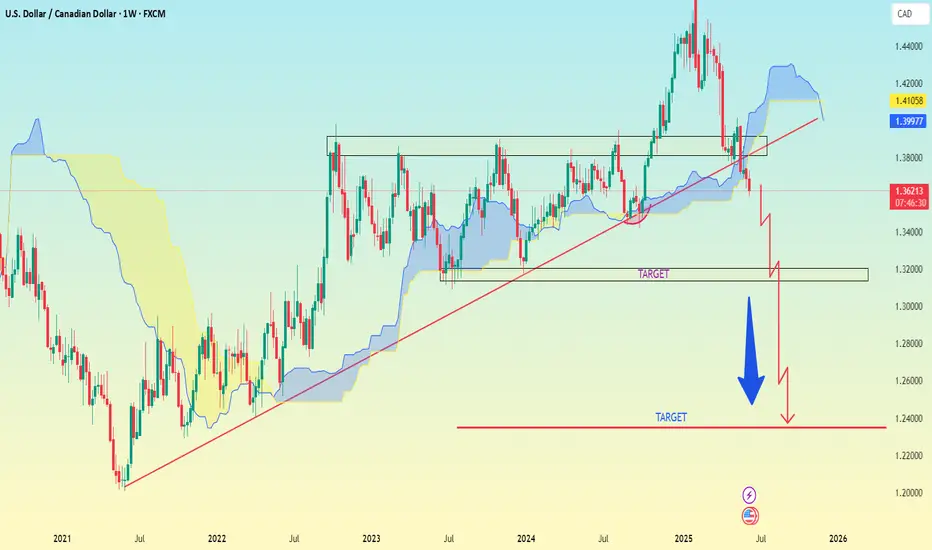
USD/CAD.1week chart pattern.It looks like me discussing a trade setup for USD/CAD with:
Sell Entry: 1.36200
Target Point 1: 1.23504
Target Point 2: 2.31000 ← This seems like a mistake
Let’s break it down:
---
🔍 Trade Analysis:
Sell at 1.36200: This is a reasonable short entry, near recent resistance (depending on current market context).
Target Point 1 (1.23504): This is plausible, as it's a historically significant support level — a good long-term take-profit zone.
Target Point 2 (2.31000): This appears illogical for a short (sell) position — it's higher than the entry price. If you're shorting, you profit from a decline, not a rise.
---
✅ Corrected Setup (Sell Idea):
Sell USD/CAD @ 1.36200
Take Profit 1: 1.30000 (medium-term support)
Take Profit 2: 1.23500 (long-term support)
Stop Loss: 1.37200 (just above recent highs)
Would you like a chart analysis or backtest of this strategy?
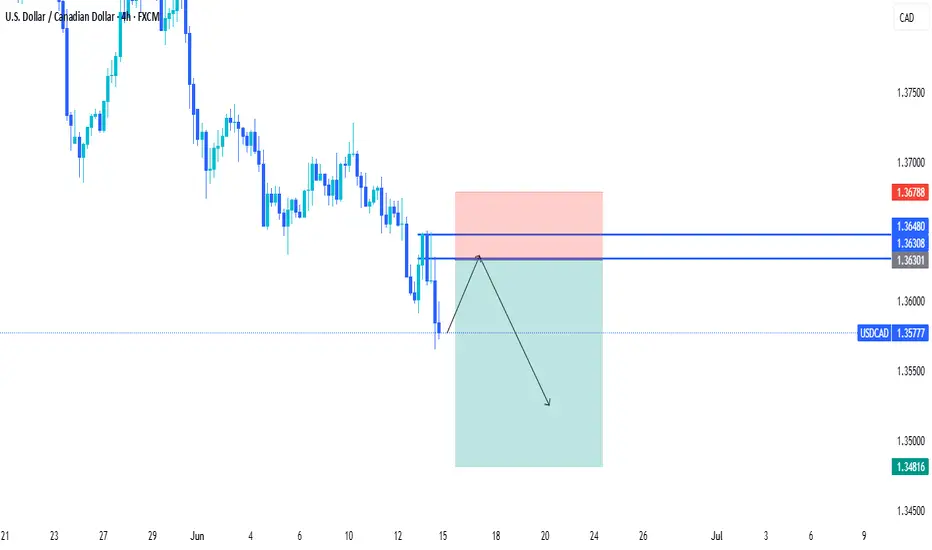
Bearish Bias Holds as Oil Rises & Rate Differentials NarrowUSDCAD – Bearish Bias Holds as Oil Rises & Rate Differentials Narrow
🌍 Macro & Fundamental Outlook
The Canadian Dollar (CAD) continues to gain ground this week, supported by two key drivers:
Crude oil prices surged due to Middle East tensions and renewed demand optimism — boosting CAD as a commodity-linked currency.
US-Canada yield spreads narrowed, following revised expectations that the Bank of Canada (BoC) may keep rates higher for longer, while the Fed is seen pausing.
Short-term event risks to watch:
🇨🇦 Canadian Manufacturing Sales data today at 13:30 GMT
🇨🇦 G7 Summit in Alberta from June 15–17, which may influence oil and energy policy sentiment
Our latest fair value estimate for USDCAD has shifted lower to 1.3613, reflecting tighter rate spreads and stronger oil. Technical structure remains tilted to the downside.
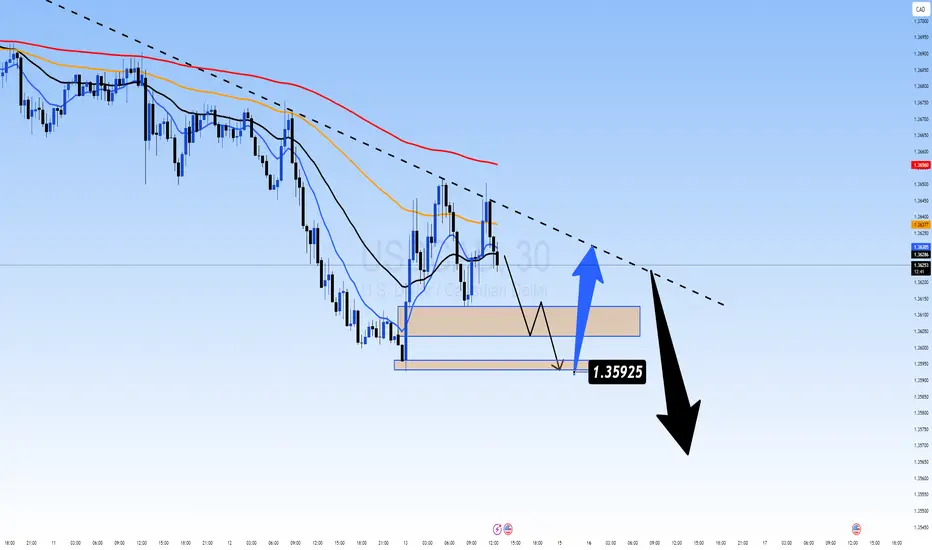
📉 Technical Outlook – M30 Chart
🔹 Structure:
Price remains in a short-term downtrend, with a well-defined descending trendline capping upside attempts.
The pair recently tested the EMA 89–200 zone and failed, suggesting continued bearish pressure.
🔹 Key Zones:
Dynamic Resistance: 1.3638 – 1.3660 (trendline + EMA cluster)
Support Area: 1.3592 → 1.3578
A break below 1.3578 could expose deeper downside toward 1.3420 (September lows)
🔹 Momentum Indicators:
RSI has bounced from oversold (30) but remains in bearish territory.
The current rebound looks corrective — potentially a dead cat bounce.
🧠 Market Sentiment
Flows favour commodity-backed currencies like CAD, especially with energy prices rising.
USD has weakened slightly as the Fed is expected to hold rates steady next week.
Sentiment is leaning toward "sell the rallies" on USDCAD for now.
🎯 Trade Setup Scenarios
🔻 SELL SCENARIO – If price retests and rejects 1.3638 – 1.3660
Entry: 1.3640 – 1.3655
Stop-Loss: 1.3685
Targets: 1.3592 → 1.3578 → 1.3510
🔺 BUY SCENARIO – If strong bullish reaction occurs at 1.3592 – 1.3578
Entry: 1.3580
Stop-Loss: 1.3545
Targets: 1.3620 → 1.3640
⚠️ Focus on trend continuation. Only consider buys if clear rejection or bullish confirmation appears at support.
✅ Conclusion
The current trend in USDCAD favours sellers, with fundamental momentum supporting CAD via higher oil and narrowing yield differentials. Key resistance at 1.3638–1.3660 remains the pivot zone to monitor. With Canadian data and the G7 Summit ahead, volatility could increase.
USDCAD Long – Wyckoff Spring PlaybookCause > Effect. Behavior > Breakouts.
We just printed a classic Spring + Test setup.
Here’s how the puzzle came together:
🔍 Accumulation Context:
Market ranged quietly for hours – demand building below the surface.
Spike down into previous demand zone with climax volume – the shakeout.
Quick reclaim of the zone with bullish absorption signals the Spring.
📈 Execution Plan:
Entry just above the spring low at 1.3617
Stop below spring at 1.3612
Targeting inefficiencies at 1.3645 and 1.3651 (prior supply pockets)
🎯 Why I Like This Setup:
Structure: Matches Wyckoff Spring logic (Phase C → D transition)
Volume: Shakeout came with high effort, followed by efficient reclaim
Timing: Happens in a zone where other traders might still be stuck short
> “In trading, the ones who recognize intent get in before confirmation.”
This trade idea isn’t about being right — it’s about understanding behavior.
I’m not reacting to candles. I’m tracking the motive behind them.
